

Abstract
Key differences between urban and rural populations can influence the adoption and impacts of new cooking technologies and fuels. We examine these differences among urban and rural households that are part of the REACCTING study in Northern Ghana. While urban and rural populations in the study area all use multiple stoves, the types of stoves and fuels differ, with urban participants more likely to use charcoal and LPG while rural households rely primarily on wood. Further, rural and urban households tend to use different stoves/fuels to cook the same dishes—for example, the staple porridge Tuo Zaafi (TZ) is primarily cooked over wood fires in rural areas and charcoal stoves in urban settings. This suggests that fuel availability and ability to purchase fuel may be a stronger predictor of fuel choice than cultural preferences alone. Ambient concentrations of air pollutants also differ in these two types of areas, with urban areas having pollutant hot spots to which residents can be exposed and rural areas having more homogeneous and lower pollutant concentrations. Further, exposures to carbon monoxide and particulate matter differ in magnitude and in timing between urban and rural study participants, suggesting different behaviors and sources of exposures. The results from this analysis highlight important disparities between urban and rural populations of a single region and imply that such a characterization is needed to successfully implement and assess the impacts of household energy interventions.
Export citation and abstract BibTeX RIS
1. Introduction
Significant efforts are on-going to change energy systems in the global south, particularly for cooking, heating, and lighting. One expected benefit of such endeavors is to reduce air pollutant emissions and therefore improve public health through decreased exposures, improved air quality, and reductions in climate impacts. While these efforts can have multiple potential benefits, many questions arise about the value, efficacy, and long-run usage of new technologies, such as improved cookstoves. The adoption and effectiveness of such technologies are dependent on the location, the population, the behaviors associated with cooking activities, and the technology itself (e.g. [1, 2]). Many of these factors are likely to vary substantially between rural and urban populations, suggesting a need for differentiated strategies to address household energy challenges in these different areas.
Here, we take advantage of results from a multi-disciplinary study in northern Ghana, the Research of Emissions, Air Quality, Climate, and Cooking Technologies In Northern Ghana (REACCTING) study [3], to examine characteristics of urban and rural households and how they may impact the effectiveness of improved stove interventions. The REACCTING study involved a randomized intervention conducted with 200 rural households, as well as an observational (non-intervention) cohort of 48 urban households. Here we compare cooking activities, exposures, and the physical and environmental conditions between rural and urban populations of northern Ghana, and use these results to address the implications for stove intervention, adoption, and impact studies.
2. Methods
The REACCTING study took place in the Kassena-Nankana (K-N) districts of the Upper East Region (figure 1) in Northern Ghana from November 2013 through January 2016. Full details of the REACCTING protocols and measurements are described elsewhere [3, 4] as are details about the demographics of the study region [5]. The main focus of this study was an intervention, centered on the rural areas of the district where wood is the primary cooking fuel, designed to test the adoption, acceptance, and impacts of two improved cookstoves: a locally-made rocket stove (Gyapa) and a Philips HD4012 LS gasifier stove (Philips). For this intervention, 200 households were systematically randomly selected from four subregions (North, South, East, West) of the rural areas of the K-N districts. Data from a district-wide Demographic Surveillance Survey (DSS, [5]) were used for sample selection. To be eligible for inclusion in the study, households had to report using biomass as their primary cooking fuel and have at least one child under five and one woman between the ages of 18 and 55 (since the intervention study measured exposure and health outcomes for these groups). Twenty five geographic clusters were randomly selected from the four regions (figure 1), in proportion to population size in each region, and then eight households were randomly selected from the eligible population within each cluster.
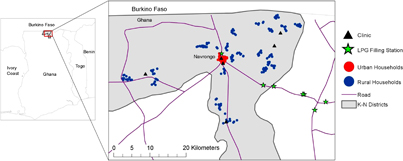
Figure 1 Map of study region. Urban study households (red) are all located in the Navrongo urban area.
Download figure:
Standard image High-resolution imageIn addition to the rural intervention study, the REACCTING project also included observational measurements in a random sample of households from the central area around the town of Navrongo, classified as 'urban' in the DSS (figure 1). For this sample, the central area was stratified by distance from the market center (within ½ mile, ½ to 1 mile), and then by primary cooking fuel (wood/crop residue, charcoal, and liquefied petroleum gas (LPG)). A total of 50 households were then randomly selected from these different strata in proportion to their size in the population. (Surveys were ultimately completed in 48 of these households.) No intervention was done with the urban study households.
Surveys were conducted with study participants throughout the two-year study to measure cooking behaviors, including stove and fuel use. For this paper, we use survey data from the rural baseline survey (conducted in November/December 2013, prior to the intervention), and the urban survey completed in November/December 2014. The results presented here are only for households in which no intervention took place. To our knowledge, there were no major shifts in the cooking practices or fuel usage affecting the general rural or urban populations between 2013 and 2014. Therefore, we feel confident that our survey results reflect fairly stable (over the time period in question) differences between the rural and urban populations of this area.
During the study period, ambient pollutant concentrations were measured at the Navrongo Health Research Center (NHRC), five health centers located across the K-N districts, and in the middle of the primary market place in the Navrongo town center (figure 1). These measurements were made with G-Pod air quality monitors ([3,6], mobilesensingtechnology.com), configured to measure CO with an electrochemical sensor (CO-B4, Alphasense, Essex, UK). Ambient particulate matter with aerodynamic diameters less than 2.5 μm (PM2.5) samples were collected on Quartz filters at the NHRC, and only the carbonaceous component was quantified following the methods described by Piedrahita et al [6].
Other measurements conducted in both rural and urban households included stove use monitoring, microenvironment (kitchen) carbon monoxide (CO) concentrations, and personal exposures of CO and PM2.5. Personal CO exposure measurements for rural participants in the control group (with no intervention stoves) were conducted from November 2013 through August 2015 (n = 193), while measurements for the urban participants were conducted from December 2014 through July 2015 (n = 51) (tables S1 and S2 available at stacks.iop.org/ERL/12/065009/mmedia). 48 h personal CO exposure was measured with Lascar USB-CO monitors, and cooking-area microenvironment CO was measured with Alphasense CO-B4 electrochemical sensors. Measurement methods and protocols are detailed by Piedrahita et al [7]. 48 h personal carbonaceous PM2.5 exposure was collected and measured on a subset of the CO sampling periods (tables S3, S4) using methods described by Piedrahita et al [6]. All PM2.5 samples were collected on quartz filters and were analyzed for particulate organic carbon (OC) and elemental carbon (EC) mass. Organic speciation was quantified and used for source apportionment applications on a subset of the samples [6].
3. Results
3.1. Sample characteristics
Population and sample descriptive statistics, including main cooking fuels and access to electricity, were obtained from the DSS, which was conducted prior to our study period between 2011 and 2012 (table 1). Additionally, wealth quintiles were generated for the K-N population using principal components analysis and a list of household assets and wealth indicators from the DSS. Comparing the rural sample to the general rural population, we note that the sample was selected to include only households that used biomass (wood or crop residue) as their main cooking fuel. As a result, the sample is slightly poorer than the rural population as a whole. Urban sample characteristics match the larger urban population more closely, though we slightly oversampled wood-burning households. Comparing rural and urban areas, it is clear that urban areas rely much more on charcoal and LPG, have higher levels of electricity access, and are much less poor than rural households.
Table 1. Sample characteristics (from DSS)
| Variable | K-N districts | Rural areas | Urban areas | ||
|---|---|---|---|---|---|
| Population | Population | Sample | Population | Sample | |
| # households | 29 403 | 25 458 | 200 | 3945 | 48 |
| Main cooking fuel | |||||
| - Wood or crop residue | 21 639 (75%) | 21 458 (85%) | 200 (100%) | 181 (5%) | 5 (10%) |
| - Charcoal | 5212 (18%) | 2838 (11%) | 0 (0%) | 2374 (62%) | 29 (60%) |
| - LPG | 2134 (7%) | 834 (3%) | 0 (0%) | 1300 (34%) | 14 (29%) |
| Has electricity | 6526 (22%) | 3340 (13%) | 12 (6%) | 3186 (80%) | 40 (83%) |
| Wealth quintile | |||||
| - Poorest | 5966 (20%) | 5896 (23%) | 67 (34%) | 8 (.2%) | 0 (0%) |
| - Poorer | 6019 (20%) | 5906 (23%) | 54 (27%) | 23 (.6%) | 1 (2%) |
| - Poor | 5893 (20%) | 5707 (22%) | 36 (18%) | 93 (2%) | 1 (2%) |
| - Less poor | 5946 (20%) | 5161 (20%) | 37 (19%) | 677 (17%) | 8 (17%) |
| - Least poor | 5955 (20%) | 2783 (11%) | 6 (3%) | 3142 (80%) | 38 (80%) |
3.2. Stove and fuel stacking
Household surveys collected information on the number and types of stoves owned in rural and urban households. Results indicate that stove and fuel stacking (i.e. use of multiple stoves, and multiple different types of stoves and fuel combinations) is common in both urban and rural study populations. The total number of stoves owned is similar in both rural and urban households, ranging from one to six stoves per household in both samples with a mean of 2.6 (median = 3) in the rural sample and a mean of 2.8 (median = 2) in urban households. However, the types of stoves and fuels in the stack vary between rural and urban areas (figure 2). In the rural areas, wood/biomass is the dominant cooking fuel, with charcoal a very common secondary fuel. All but one household (out of 200) had at least one three stone fire (TSF), i.e. a basic wood stove, and nearly 70% of households had both wood and charcoal stoves. Only two rural households had an LPG stove, and both of these households also had both wood and charcoal stoves. In the urban areas, charcoal is the dominant fuel, with both wood and LPG common secondary fuels. About a fifth of households in this sample had only charcoal stoves, while roughly a third had both charcoal and wood stoves and another third had both charcoal and LPG stoves. Overall, about half of the households in the urban sample had at least one LPG stove, but only one household had only an LPG stove, suggesting that exclusive use of this clean-burning fuel is still rare in this area.

Figure 2 Stove and fuel stacking: bars show the proportion of households owning stoves that use different types of fuel (wood, charcoal, LPG) in rural and urban samples.
Download figure:
Standard image High-resolution imageSurvey questions also asked respondents whether each stove in the household had been used on the day prior to the survey. In the rural sample, 93% of households reported cooking on a TSF on the prior day, while 29% said they had used a charcoal stove. Use of multiple stove types on the same day (both TSF and charcoal) was reported by 26% of households. This suggests that for the majority of households, different types of stoves may be used on different days or during different periods, perhaps depending on fuel availability or the types of meals being prepared. Meanwhile, in urban areas, 76% of households said they had used a charcoal stove on the previous day, while 36% had used a TSF and 24% had used an LPG stove. As in rural areas, use of multiple types of stoves on the same day occurs but is not the dominant practice; 22% reported using both TSF and charcoal stoves, while 13% said they had used both charcoal and LPG stoves on the previous day.
For each stove that a respondent reported using on the previous day, interviewers collected data about the dishes the stove was used to prepare. Figure 3 presents results for four of the most commonly prepared dishes. Tuo Zaafi (TZ) is a thick porridge made with millet or maize flour. A slightly higher proportion of rural households reported preparing this dish relative to the urban households, and there is a marked difference in the types of stoves/fuels used to prepare TZ between the two samples, with rural households predominantly using a TSF while urban households more commonly prepare TZ over a charcoal stove. TZ (and banku) are usually served with a soup, made with various local vegetables and sometimes fish or meat. In rural areas, TSF is again the most common type of stove used to prepare this soup, but charcoal stoves were used among about a third of the rural households who reported cooking this dish. In urban households, vegetable soup is typically cooked on charcoal stoves, with a smaller number of households using TSF or LPG stoves. Multiple rice varieties are available in the area and are used to prepare dishes like jollof rice (made with tomatoes) or plain rice, often served with a sauce or soup. In the rural sample, most households reported cooking rice over a TSF, while LPG stoves were used somewhat more often than charcoal or TSF to prepare rice in urban households. Banku is another thick staple dish, made with fermented corn and cassava dough. Only one rural household reported cooking banku on the day prior to the survey; this dish was more commonly prepared by the urban sample and cooked over charcoal or TSF, not LPG.
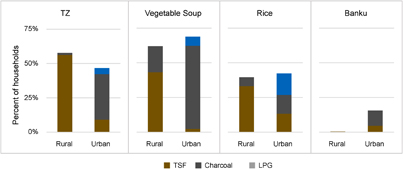
Figure 3 Cooking tasks: summary of foods prepared on the day prior to the survey and the fuels/stoves used for each dish in rural and urban households.
Download figure:
Standard image High-resolution imageFinally, we note that at least some of this stove stacking involves households simultaneously using multiple stoves (and multiple types of stoves). As one example, noted above, TZ and soup are often prepared together: the proportion of households that said they had cooked both of these dishes on the day prior to the survey was roughly 40% in both the rural and urban samples. To the extent that households are preparing multiple dishes simultaneously, one single-burner improved cookstove is unlikely to meet their cooking needs.
3.3. Ambient air quality
One potential difference between urban and rural regions is the level of ambient air pollution to which populations are exposed. Here we compare the measured CO concentrations at the various regional monitors (figure 1). Concentrations of CO are highest in the center of the Navrongo market, followed by concentrations measured at the Navrongo health clinic, which is also located close to the town center (figure 4, figure S1). The CO concentrations and trends at the NHRC (southern side of the Navrongo urban area) are more similar to the regional background concentrations measured at the more remote health clinics, suggesting that the NHRC measurements are representative of the regional conditions. CO concentrations measured at the market were the highest and were markedly different than those measured at the other locations (figure 4, figure S1). The market CO concentrations showed two daily peaks at 06:00–07:00 and again at 18:00–19:00 local time. The daily maximums at the regional clinics also occurred at 19:00, with the exception of the measurements made at the Kologo clinic, which peaked at 06:00. The highest hourly-averaged CO concentrations from the rural locations, including the NHRC, ranged from 0.27–0.41 ppm CO, whereas the highest averaged concentrations at the Navrongo health clinic was 1.5 ppm, and the market 5.8 ppm. The marketplace in the urban center is a hot spot for pollution. However, these emissions are quickly diluted, and therefore concentrations decrease rapidly with distance from this location (figure 4, figure S1). There are many sources of CO in addition to residential biomass burning that contribute to the elevated CO concentrations in the market and throughout the region. The additional sources included cooking activities in the market, as well as traffic from the main roads and trash burning throughout the town. There was also a nearby parking lot near the Navrongo clinic and market in which taxis and buses idle much of the day. In the market, the emissions sources are clustered in the market area, causing elevated concentrations. The peak concentrations that occur in the morning and the evening are presumed to be the result of increased activities (i.e. meal cooking) combined with lowered boundary layer depth that prevents the mixing and dilution of emissions.

Figure 4 Smoothed hourly ambient CO concentrations by location and time of day.
Download figure:
Standard image High-resolution image3.4. Exposure
A linear mixed effects model was used to assess the factors that drive the differences between personal CO exposures in urban and rural populations. The model was specified as in equation (1), with the dependent variable (the log-transformed daily average CO (ppm)) regressed against a categorical variable representing inclusion in the rural or urban population, while controlling for season and a categorical variable that accounts for gender, age group, and primary cook status (categories were female primary cooks, female non-primary cooks greater than five years old, male non-primary cooks greater than five years old, and children under five years old). A random effect was included to account for repeated measures and apportion the variability to between and within-person components as described by Piedrahita et al [7]. The full results from the mixed effects model for CO personal exposure are provided in table 2.
Table 2. Mixed effects model results for CO personal exposure
| Expected exposure (ppm) (95% CI) | % difference from reference (95% CI) | P-value | |
|---|---|---|---|
| Control | 0.52 (0.33, 0.79) | 0.00 | |
| Urban | 0.59 (0.35, 0.99) | 14 (−33, 93) | 0.63 |
| Female primary cooks | |||
| Female non-primary cooks >5y | 0.32 (0.17, 0.59) | −38 (−67, 15) | 0.13 |
| Male non-primary cooks >5y | 0.53 (0.22, 1.3) | 3 (−59, 153) | 0.94 |
| Children <5y | 0.24 (0.14, 0.42) | −53 (−73, −18) | 0.01 |
| Harmattan bush burning (November–mid February) | |||
| Transition (October) | 0.54 (0.15, 2.01) | 6 (−72, 291) | 0.93 |
| Light rainy (May–June) | 0.52 (0.26, 1.03) | 1 (−49, 100) | 0.97 |
| Heavy rainy (June–September) | 0.75 (0.46, 1.23) | 46 (−11, 138) | 0.13 |
| Hot dry (mid February–April) | 0.31 (0.18, 0.53) | −40 (−65, 3) | 0.06 |
| N | Random effect by individual variance | Adjusted R-squared | |
| Fit statistics | 244 | .52 (.28,.96) | 0.11 |
Personal CO exposure was 14% higher among urban participants compared to rural participants, but this difference was not statistically significant (p = 0.63). Children under age 5 had 53% lower exposure than the female primary cooks (p = 0.01), female non-primary cooks had 38% lower exposure than primary cooks (p = 0.13). However, male non-primary cooks had 3% higher exposure (p = 0.94). These results were also observed in models that examined these gender-age differences separately for rural and urban areas (not shown). Thus, it appears that male non-cooks are exposed to a different set of pollution sources, resulting in similar exposure levels overall.
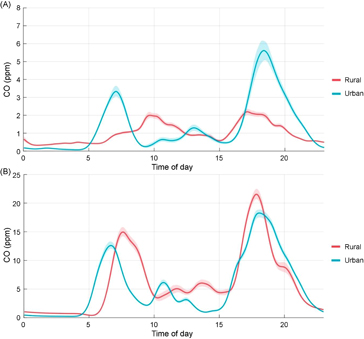
Personal exposure smoothed by time of day was calculated using b-splines (gramm, [8]). The results highlight the differences in exposure trends between the urban and rural study participants (figure 5(a)). This can be contrasted with microenvironment CO concentrations collected in the kitchens of a subset of the homes in which personal exposure was measured (figure 5(b)).
Figure 5 (a) Personal CO exposures for rural and urban participants, and (b) cooking area microenvironment CO concentrations in urban and rural kitchens. Both are smoothed by time of day, with 95% confidence intervals.
Download figure:
Standard image High-resolution image
The early morning time peak in the urban group is consistent between the personal exposure and cooking area time series, while the morning peaks for personal and cooking area rural measurements are not contemporaneous and occur later in the day relative to the urban data. In both the urban and the rural results, the timing of the evening peaks agree well between the cooking area and personal exposure data, but occur earlier in the day for the rural data. The earlier start and later finish of the urban CO levels may reflect the larger time window for urban households to perform household tasks due to electrification, and a greater tendency of household members to spend more time away from the home (e.g. due to formal wage-earning employment) during the day. The evening exposure peaks are also higher in the urban data, possibly reflecting decreased ventilation in typical urban kitchens in the region and close proximity to emissions from nearby houses [9]. Cooking in the rural areas is often performed outdoors, whereas most urban households had dedicated indoor kitchens.
Personal exposure to the carbonaceous components of PM2.5 was measured for 24 study participants in the urban group, and 41 in the rural group (tables S3, S4). A mixed effects model similar to equation (1) was formulated to determine the drivers of exposure for the urban vs. rural participants. The only difference between this model and the one used for the CO exposures was the age categorization, here set to 10 years old rather than 5 since there were no PM measurements collected for participants below age 5. Additionally, the seven measurements for children under age 10 all came from rural children (table S5).
Urban participants had 48.5% (p = 0.06) lower exposure to particulate elemental (EC) and 69.3% (p < 0.01) lower exposure to particulate organic carbon (OC) than rural participants. Male non-primary cooks were found to incur 23.4% higher EC and 78.1% higher OC than primary cook females, but these differences were not significant (p values of 0.66 and 0.26, respectively), and the sample size for those groups was low. Children had 41.9% lower EC exposure (p = 0.28), and 33.0% lower OC exposure than primary cook women (p = 0.44). Ambient carbonaceous PM2.5 concentrations collected at the NHRC, at the periphery of the urban area, were quite low, with mean OC of 4.3 μg m−3 (standard deviation 4.1 μg m−3) and mean EC of 0.3 μg m−3 (standard deviation 0. 3 μg/m3). This further suggests that local sources including but not limited to cooking are the primary drivers for exposure for urban dwellers, as they are for rural dwellers [6], and the density of sources is low enough that regional atmospheric mixing is helping reduce exposures. The influence of local sources is seen by comparing the ratio of personal exposure to ambient total carbonaceous PM (EC + OC), which is 9.7 in REACCTING [6], compared with, for example, 2.4 in Colorado, USA [10], where they compared personal exposure to ambient total PM2.5 mass. The reduced urban PM exposure could also be driven by the higher prevalence of LPG and charcoal use in the urban households. This may also explain the less pronounced differences in CO exposures for the urban participants, since those fuels reduce PM emissions but do not necessarily decrease CO. We did not measure protocol compliance of carrying the sampling equipment for these measurements, bringing into question whether the urban participants may have worn the samplers less than the rural ones.
4. Discussion
Policies, programs, and interventions promoting a transition toward cleaner household energy systems, including cleaner cooking, must be cognizant of target populations' starting points, and the barriers and opportunities that are relevant in each context. Our results highlight that these starting points may be quite different in rural and urban areas, even within a fairly small geographic region. Specifically, we observe key differences in cooking technologies and fuels, environment, and lifestyles between rural and urban populations of the K-N districts. These varied physical and social characteristics will impact the personal exposures to air pollutants from cooking practices, and the potential success of cooking interventions. Here, we highlight three key (potentially interrelated) differences that we observed in the K-N districts, and that we would expect to find in many other areas as well. We discuss the implications of these differences for the design of household energy interventions and the assessment of intervention impacts.
4.1. The mix or 'stack' of stoves and fuel types varies between rural and urban areas
Rural and urban households rely on different cooking technologies and different fuels. In the K-N districts, rural households rely predominantly on wood, while urban households are more dependent on charcoal and, to a lesser extent, LPG. These different starting points have important implications for interventions pushing transitions toward cleaner stoves and fuels.
First, our results suggest that fuel choice is complex, and likely driven by cultural preferences as well as fuel availability and ability to purchase fuel. On the one hand, our finding that rural and urban households cook the same dishes using different types of stoves/fuels indicates that cultural preferences are not deterministic or immutable; many urban households have adapted to cooking TZ, for example, using charcoal rather than wood. On the other hand, we note that even where urban households have LPG stoves, these stoves are rarely used to cook TZ or banku. Thus, further shifts toward cleaner cooking will need to examine and overcome cultural, demand-side barriers as well as availability and supply-side issues.
Second, the monetary and time costs of these stove-fuel systems are quite different. In rural areas, traditional TSF are built with freely available materials, and gathering wood fuel incurs (potentially substantial) time costs but little to no monetary cost. A majority of rural households do also use charcoal stoves, which are fairly inexpensive, and purchase charcoal with some regularity as a secondary fuel. In contrast, most urban households rely on purchased charcoal, and some also purchase LPG (stoves and fuel). Since urban populations are less poor overall and are already using and allocating a portion of their budgets to more advanced fuels, they may be more able to support a successful technological/fuel switch than their rural counterparts. Meanwhile, liquidity constraints (cash on hand) may be a bigger barrier than total price in rural areas. That is, households may be able to pay for new stoves if they are able to pay in small installments over time [11].
Further, if the intent of an intervention is to transition to the 'cleanest' fuel, LPG, consideration of barriers and opportunities unique to urban and rural areas is important. Already, the use of LPG in the urban households is high compared to the rural households. However, several barriers to expanded LPG use exist in all regions. For both urban and rural inhabitants, cost is a factor that limits the use of LPG. When asked for reasons why they didn't have a gas stove, urban participants cited an inability to afford the stove and/or the gas for fuel. Cost concerns were prevalent in the rural sample as well. In addition to monetary costs, refilling LPG cylinders requires traveling to a filling station (figure 1). This time cost may be particularly high for rural households. Finally, 41% of rural respondents cited safety concerns as a reason they did not have LPG stoves; in contrast, 98% of urban sample respondents disagreed that cooking with gas is dangerous (see Supplementary Data). Collectively, these barriers suggest that an immediate switch to LPG for all households may not be realistic for this region. In the short term, improved wood stoves and other clean or improved technologies may need to be part of the technology stack.
4.2. Physical environments, including housing types, housing density, and other pollution sources, are different between rural and urban areas
The physical environments in which rural and urban populations reside differ and influence personal exposures to air pollutants. The structure of homes and the location of the cooking areas (indoor and outdoor) drive household air quality and exposures to air pollutants. Despite the use of improved stove technologies and different fuels, urban residents may be exposed to emissions from cooking activities occurring in close-by neighboring houses and apartments, as has been observed elsewhere [1, 9]. Further, the extent to which cooking versus other sources drives exposures will depend on what other sources are present in the environment (i.e. [6]). For instance, daytime commercial cooking with charcoal burning coalpots and TSF is very common in Navrongo town and virtually non-existent in rural communities. This is highlighted by the elevated pollutant concentrations in the market at the urban center, which is just one example of a strong source that could have impacts on nearby residents and market attendees. These physical and environmental conditions may suggest the need for community-wide interventions, and potentially integrated interventions targeting a suite of pollution sources beyond cooking, rather than focusing only on residential cooking and rolling out new technologies house-by-house. Additionally, community-wide interventions can have increased benefits if higher penetration levels are realized in smaller geographical areas versus lower penetration levels in larger geographical areas [12].
4.3. Lifestyles and activities differ between urban and rural populations
Occupations and lifestyles are likely to differ between rural and urban populations, influencing how people spend their time and the extent to which household air pollution versus other sources drive exposure. For instance, we observe differences in the timing and duration of cooking between rural and urban areas (figure 5(b)). This is one factor that can drive personal exposures to CO and PM, and ultimately impact assessment results. The timing of the cooking events suggest differences in cooking activities, likely driven by the dishes prepared and whether or not meals were cooked in the home or bought elsewhere. The differences in rural kitchen CO concentrations and personal CO exposures (figure 5) suggest that even rural populations are exposed to pollutant sources other than residential cooking. This is also implied by the result that non-cooking men have similar CO and carbonaceous PM2.5 exposures to women, suggesting the importance of other key pollutant sources in the region.
In order to better understand these differences, and their implications for potential strategies to reduce exposures among different populations, intervention and observational studies should collect time-use and time-activity data. Previous efforts have used surveys and time-activity diaries to determine locations and activities, but these data sources are burdensome to collect, low resolution, and prone to reporting bias. Emerging automated time–activity data collection systems [13, 14] provide a reliable and low-cost way to account for every minute of a person's day, substantially improving our understanding of behavior. This type of information can be used to relate details about proximity to specific sources and exposures [13]. Together with source apportionment analysis [6], it helps form a more coherent picture of stove use, emissions, and exposures to assess success of specific interventions among different populations.
5. Conclusion
The results of this study show that important differences in fuel/stove usage, behaviors, and environmental conditions exist between populations in rural and urban areas. For funders, policy makers, practitioners, and researchers, a solid understanding of these differences should inform the choice of where and how to intervene to reduce exposures and improve health outcomes. Clearly, a single intervention design is unlikely to be optimal in both rural and urban settings. Rather, different barriers and opportunities exist in these different areas, and interventions must be designed to overcome and capitalize on these. For example, in rural settings where ambient pollution and spillovers from neighboring households are lower, we might expect changes in cooking fuels or technologies at the household level to have a larger impact on overall exposure than in more densely populated areas. In these settings, interventions may find success by focusing on affordability and credit access to allow households to pay for stoves over time, and by expanding the supply chain for cleaner stoves and fuels. Meanwhile, urban interventions may need to grapple with a wider range of exposure sources, including communal effects; community-scale interventions targeting household energy use as well as, for example, market-driven sources (e.g. commercial cooking) may need to be developed rather than a household-by-household approach.
More broadly, the international research and policy communities focused on household air pollution exposures and their health impacts should continue working to answer questions such as: for a particular country or region, what combination of (well-designed) rural vs urban interventions will have the greatest impact on health and welfare? The results from the REACCTING exposure, cooking area, and ambient data suggest that there is still much uncertainty across multiple domains that limits our ability to answer this question. This includes uncertainty in the air pollutant sources that drive personal pollutant exposures across rural and urban populations; more accurate time-activity information could help to address this by shedding light on when and where people go within and away from the home, if and when stoves are used, and what sources are they exposed to. Additional uncertainty surrounds the demand- and supply-side drivers of sustained adoption of cleaner stoves and fuels. Interdisciplinary, collaborative, and community-engaged research efforts will be needed to make progress towards more effective solutions.
Acknowledgments
The National Center for Atmospheric Research is operated by the University Corporation for Atmospheric Research under the sponsorship of the National Science Foundation. This work is supported by the US National Science Foundation Award #1211668 and US Environmental Protection Agency STAR Award #R835424.