

Abstract
Access to seasonal climate forecasts can benefit farmers by allowing them to make more informed decisions about their farming practices. However, it is unclear whether farmers realize these benefits when crop choices available to farmers have different and variable costs and returns; multiple countries have programs that incentivize production of certain crops while other crops are subject to market fluctuations. We hypothesize that the benefits of forecasts on farmer livelihoods will be moderated by the combined impact of differing crop economics and changing climate. Drawing upon methods and insights from both physical and social sciences, we develop a model of farmer decision-making to evaluate this hypothesis. The model dynamics are explored using empirical data from Sri Lanka; primary sources include survey and interview information as well as game-based experiments conducted with farmers in the field. Our simulations show that a farmer using seasonal forecasts has more diversified crop selections, which drive increases in average agricultural income. Increases in income are particularly notable under a drier climate scenario, when a farmer using seasonal forecasts is more likely to plant onions, a crop with higher possible returns. Our results indicate that, when water resources are scarce (i.e. drier climate scenario), farmer incomes could become stratified, potentially compounding existing disparities in farmers' financial and technical abilities to use forecasts to inform their crop selections. This analysis highlights that while programs that promote production of certain crops may ensure food security in the short-term, the long-term implications of these dynamics need careful evaluation.
Export citation and abstract BibTeX RIS
Corrections were made to this article on 21 April 2017. Figure S9 in the supplementary data was amended.
1. Introduction
Although farmers have historically adapted to seasonal fluctuations in weather, they now face unprecedented shifts in climate patterns (Morton 2007, Senaratne and Scarborough 2011). Increasing temperatures as well as shifting rainfall patterns are expected to negatively impact global agricultural output (Funk and Brown 2009, Quiggin et al 2010, Lobell et al 2011, Gourdji et al 2013). Farmers in sub-Saharan Africa and South Asia are expected to be particularly impacted by climate change because these regions already have high temperatures and less adaptive capacity (Schmidhuber and Tubiello 2007, Skoufias et al 2011, IPCC 2014).
Fortunately, strategies that help farmers adapt to climate change can benefit both farming productivity and revenue (Falco et al 2012). Although infrastructure-driven strategies (such as building new reservoirs) often drive policy conversations, soft adaptation techniques (such as seasonal forecasts) can also buffer farmers from climate risks (Sovacool 2011). Access to weather information is often positively correlated to changes in farming practices (Wood et al 2014), with seasonal forecasts, in particular, having considerable potential to improve livelihoods in regions with high inter-annual rainfall variability (Roncoli 2006, Ash et al 2007, Ziervogel and Opere 2010, Hansen et al 2011). Such forecasts can be used by farmers, for example, to inform their crop diversification strategies by helping them decide which crops to plant (Crane et al 2010).
Both field and modeling approaches have been used to evaluate the impact of forecasts on agricultural communities (Bharwani et al 2005, Patt et al 2005, Ziervogel et al 2005, Roncoli 2006, Ash et al 2007, Everingham et al 2008, Crane et al 2010, Hansen et al 2011, Balaji and Craufurd 2014, Roudier et al 2014, Wood et al 2014, Choi et al 2015, Vervoort et al 2016). Although field studies capture real-world responses to forecasts, their findings can be limited when longitudinal data are absent (Patt et al 2005, Ash et al 2007, Hansen et al 2011). Thus, empirically-grounded agricultural system models play a critical role in the assessment of forecast benefits since they allow for long-term assessment and can take into account the probabilistic realizations of the forecast (Ash et al 2007).
Given the complex and simultaneous interactions among biophysical, social, economic, and perceptual factors in farming communities, a coupled natural and human systems framework is critical to developing a comprehensive understanding of the effectiveness of adaptation strategies (Liu et al 2007, Nay et al 2014). Accordingly, agricultural system models include complex dynamics to account for the various factors that shape farmers' immediate environments and subsequent decisions (Graeub et al 2016, Jain et al 2015). Although market dynamics are often incorporated into modeling studies (e.g. Acosta-Michlik and Espaldon 2008), the combined impact of forecast use and different crop economics (i.e. costs and return dynamics of subsidized vs. market-driven crops) on farmer livelihoods has not received much attention. Bharwani et al (2005) show that garden farmers in the Limpopo province of South Africa who plant butternut squash, a more expensive crop with a perceived guaranteed return, would have much higher income in a drier climate scenario. However, it is unclear, how the crop economics would have affected Limpopo farmers' incomes in a wetter climate scenario. Various countries around the world, including India, Qatar, and the United States have policies that incentivize production of certain crops (Fader et al 2013). Since subsidies and company contracts can greatly change the economics of crops and subsequent farmer decisions, the interplay between the physical and economic environments needs to be explicitly evaluated to develop a comprehensive understanding of seasonal forecast benefits and limitations.
Thus, the primary objective of this study is to assess the impacts of seasonal forecast use on crop diversification in a system with varying crop economics (i.e. costs and returns). The specific questions we aim to answer for our study area are:
- Could incorporating forecasts into planting decisions generate higher net agricultural income for a farmer?
- How do varying crop economics moderate the effect of different climate conditions on changes in net agricultural income?
The dry zone of Sri Lanka, a region with a large agricultural sector and high inter-annual rainfall variability (Gunda et al 2016), serves as an ideal case study for this analysis for two reasons: 1) varying crop economics and 2) forecasts availability. The three main crops in the region (rice, soybean, and onion) have notably different crop economics: rice production is heavily subsidized and has a guaranteed market return while onions are subject to the dynamics of market supply and demand; soybean returns are partially buffered by futures contracts, whereby farmers enter agreements with businesses to buy the crop at a fixed price irrespective of subsequent market fluctuations. Furthermore, the Meteorological Department of Sri Lanka develops ternary seasonal forecasts (i.e. probabilities that rainfall will be dry, normal, and wet) and shares this information with other government agencies (Warnasooriya 2016). Therefore, although available, seasonal forecasts are not currently directly shared with farmers.
To evaluate the objectives, this study draws upon diverse research expertise and incorporates methods and insights from several fields, including hydrology, social psychology, geography, and behavioral economics to develop an integrative model on a system dynamics platform. We use both quantitative and qualitative data to inform and develop our empirically-based model, including games in the field to develop decision rules regarding how farmers translate seasonal climate forecast information to farming decisions; when games are designed to emulate the local environment, farmers' hypothetical choices can approximate real-life behaviors and thus, provide considerable insight (Kühberger et al 2002, Kang et al 2011). Our simulation results suggest that by using seasonal forecasts, farmers' average agricultural income generally increases, albeit with greater variance in income than baseline farmers. Although further work is needed to understand the impact of social interactions on farmers' crop selection decisions, our analysis indicates that the current economic structure will aid livelihood improvement of a forecast-using farmer under a drier climate scenario and reduce income disparity under a wetter climate scenario. Our work extends the ongoing assessment of seasonal climate forecast benefits for farmer livelihoods both conceptually and methodologically by: 1) explicitly incorporating the impacts of crop economics on farmer livelihoods in a changing climate and 2) using games to derive forecast interpretation decision rules.
2. Methods
2.1. Site description
Our study region is System MH, where approximately 56% of the working population is involved in agriculture (Department of Census and Statistics 2012). System MH, located in the Galenbindunuwewa district, is one of the irrigation systems managed by the Mahaweli Authority of Sri Lanka (figure 1). The MH region is chronically water-stressed, in part due to its location in the dry zone, which receives approximately 70% of its annual rainfall during the wet season (from Dec-Feb; locally referred to as 'maha') and relatively little rainfall during the dry season (from May-Sept; locally referred to as 'yala') (Brewer et al 1992, Gunda et al 2016). The Huruluwewa reservoir was constructed and later connected to Sri Lanka's major irrigation system to buffer the MH region from the high seasonal rainfall variability (Rathnayake 2016). However, decreasing rainfall coupled with minimal inflows from the Mahaweli system has meant that Huruluwewa is often rain-fed and under-capacity during the dry season (Hewavisenthi 1992, Mahaweli Authority of Sri Lanka 2004–2013, Abeynayaka et al 2007, Eriyagama and Smakhtin 2010, Gunda et al 2016, Rathnayake 2016).

Figure 1 Study location and areas of field work.
Download figure:
Standard image High-resolution imageWhen water is sufficient during the dry season (for e.g. in 2015), farmers in MH predominantly grow rice (65% of area) followed by soybean (14%) and some onion (1%) for revenue; the remaining production area is either devoted to vegetables for household consumption (2.4%), maize (<1%), other crops (<1%), or left fallow (16%) (Berundharshani and Munasinghe 2015). Growing rice is generally preferred over other food crops like soybean or onion because rice is the staple food of the country (Brewer et al 1992, Weerakoon et al 2011); soybeans are typically sold for use as animal feed and onions are a cash crop. The water requirements for soybeans are comparable to those of rice but soybeans are more tolerant of drought; in a drier climate, however, onions do much better (Brouwer and Heibloem 1986). Generally, there is sufficient water in the Huruluwewa reservoir to grow onions more often than rice or soybean (figure S1 available at stacks.iop.org/ERL/12/034001/mmedia). However, the input and hired labor cost of growing onions is much greater, up to five times the cost for rice and soybean (Department of Agriculture 2010–2011). The cost of planting rice is the lowest of the three crops due to various government support programs, such as heavily subsidized fertilizer specifically for rice (Davis et al 2016). An additional factor discouraging onion production is the volatility of returns associated with the crop relative to that of rice and soybean: the prices for onion are subject to market fluctuations while the returns for rice and soybean are relatively fixed, due to government price ceilings and futures contracts respectively (field notes). Farmers typically plant only one crop per field during the season given that the crops require different land preparation and management efforts. At the start of the season, if the reservoir levels are visibly low, farmers typically leave their fields fallow. Most of the farmers receive information about water availability from their farmer organization representatives, who meet with the Irrigation Engineer, Department of Agriculture, and other government officers (field notes).
2.2. Model development & data sources
The modeling effort is centered on a simplified representation of an individual farmer living in System MH. Interactions between individuals (i.e. social components) and extreme weather events were outside the scope of the model. The model is built on a system dynamics platform (specifically Powersim Studio 10 Expert) with a seasonal time step for a period of 64 dry seasons, which occur once per year. The system dynamics platform was selected because it provides a visual framework that allows for easier integration of the diverse variables in the study. The model is publically available and can be accessed via the openabm platform: www.openabm.org.
The three main components of the model structure are hydrological, economic, and behavioral (figure 2). The objective of the model is to evaluate the impact of seasonal forecasts on a farmer's net agricultural income when their crop choices have different and variable costs and returns. Net agricultural income is defined as the difference between the costs and revenues associated with the crop the farmer plants on their field. In the model, net agricultural income is a function of the crops planted, actual seasonal weather, and market returns. Three climate scenarios are simulated in the model: 1) climate consistent with historical conditions, 2) drier climate, and 3) a wetter climate. Each season, the forecast is sampled from the specified climate scenario and the actual weather is subsequently sampled (moderated by the forecast skill) from the forecast. To understand the impact of the seasonal forecasts, the farmer's behavior when using seasonal forecasts ('Adaptive: Forecasts') is compared to: 1) a farmer who only uses climate conditions (i.e. the climate condition from which the forecast was sampled) to select crops ('Baseline: Climate') and 2) a farmer who consistently plants rice every season regardless of the weather ('Baseline: Rice Alone').
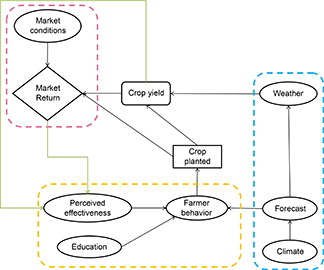
Figure 2 Influence diagram of hydrological (dashed blue), economic (dashed purple), and farmer behavior (dashed orange) components of the system dynamics model. The two green arrows note the updating process of the farmer's perceived effectiveness (i.e. prior experience) of the adaptation practice of crop diversification at the end of each season.
Download figure:
Standard image High-resolution imageThe model variables and assumptions, including how the various empirical data sources were consulted to define model variables and dynamics, are described in detail in appendix A (available at stacks.iop.org/ERL/12/034001/mmedia). A summary of the primary variables is provided in table 1 and variables that were excluded from analysis are listed in table S1. Brief descriptions about the primary sources consulted for the model are provided below:
- Game: Since games can provide insight into decision processes (Kühberger et al 2002, Castillo et al 2011, Kang et al 2011, Nay et al 2014), we designed a contextualized, dynamic game to investigate how farmers in the field respond to and interpret weather forecasts within their specific environment. Specifically, the farmers were provided with a randomly selected seasonal forecast (figure 3) and asked to select which crops (if any) they would plant for the season. Once the farmers' crop choices were recorded and associated costs paid to the banker, the wheel was spun to determine the actual weather and subsequent returns for the crops planted were paid to the farmers. The wheel was then reset for the next season. The farmers then planted crops given the new forecast and their current income. This process was repeated for a few rounds. The game was played with 49 farmers in System MH in January 2016, in 4 groups of 12–13 players per group. All of the crop selections made by the farmers were analyzed relative to the weather forecasts and other variables (e.g. education) to understand how farmers interpreted the probabilistic nature of the forecasts (additional details about the decision heuristics are provided in appendix A). A description of the game method (including instructions) is provided in appendix B.
- Surveys: The primary survey consulted (hereafter referred to as 'ADAPT-SL Survey') was conducted for over 800 randomly selected dry zone rice farmers as part of the larger project in which this study is embedded (https://my.vanderbilt.edu/srilankaproject/); the ADAPT-SL Survey captures various information including farmer demographics and attitudes towards adaptation practices. The second survey consulted was a household survey (hereafter referred to as 'System MH Survey') conducted during the 2015 dry season to characterize farming behaviors in the study area (Berundharshani and Munasinghe 2015).
- Interviews: Data from 200 farmer interviews (140 of which were all conducted in and near System MH in late 2015) as well as interviews with officials (representing both governmental and non-governmental agencies) working on areas of irrigation, agriculture, and climate provided information about the context in which farmers make decisions.
Given the presence of stochastic variables in the model, each climate condition was simulated 1 000 times and the results were aggregated to capture general trends. Model outputs from Powersim were written to Microsoft Excel and processed in R. Given the stylized nature of our modeling effort, we focus on pattern-oriented modeling for verification and validation (Grimm et al 2010). In addition to ensuring accurate formulation by reviewing output tables (Rykiel 1996), we evaluated our model to ensure that it reproduced predicted patterns (Ahmad and Simonovic 2000). Sensitivity analyses were conducted to understand the impacts of variable assumptions on model output. Each of the variable values explored in the sensitivity analysis (summarized in table S2) was simulated 1 000 times and aggregated prior to comparisons.
Table 1. Summary of the variables and related data sources for the various model components.
| Model component | Variable | Source | Notes |
|---|---|---|---|
| Hydrology | Climate scenarios | Gunda et al (2016) | Historical climate is defined as 40% dry −40% normal −20% wet (additional details in the 'Climate scenarios' subsection in appendix A) |
| Forecast skill | Warnasooriya (2016) | The actual weather observed accurately reflects the seasonal forecast 70% of the time (additional details in the 'Actual weather' subsection in appendix A) | |
| Economic | Crop costs and returns | Department of Agriculture (2010–2011) | Crop costs (including both labor and materials) and returns are derived from agricultural statistics of the region; onions are approximately 5 times the cost of rice and soybeans and also have a more variable return (additional details in the 'Market return' subsection in appendix A) |
| Behavioral | Interpretation of seasonal forecast | Game | Farmers generally preferred to plant soybean except when the probability of wet or dry weather is high, in which case farmers opted to plant rice or onions respectively (additional details in the 'Crop decisions' subsection in appendix A) |
| Perceived effectiveness (e.g. weather forecast) | ADAPT-SL survey | As farmer's predictability of rainfall decreased, they were less likely to plant non-rice food crops (additional details in the 'Trust heuristics' subsection in appendix A) | |
| Trust heuristics | Multiple sources | Farmer's trust, which is based on previous experiences, influences behavior in the future (additional details in the 'Trust heuristics' subsection in appendix A) | |
| Education | Game and ADAPT-SL survey | Survey data shows that farmers who are less educated were less likely to state that they could predict rainfall. Results from the game indicate that less educated farmers planted more rice even at low probabilities of wet season whereas more educated farmers moved more quickly towards planting rice as the probability of a wet season increased (additional details in the 'Education' subsection in appendix A) | |
| Other | Crop yields | Brouwer and Heibloem (1986) | Soybeans and rice have higher yields in wet climate while onions perform better in a dry climate (additional details in the 'Crop yield' subsection in appendix A) |
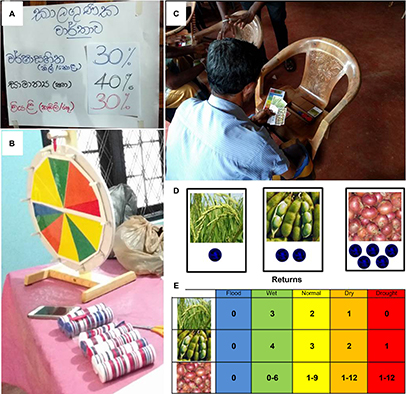
Figure 3 Playing games in the field: (a) written presentation of forecast information, (b) weather wheel with spinner and poker chips used as currency, (c) farmer placing crop cards on fields to convey planting decisions, (d) crop cards with associated planting costs, and (e) yield return sheet showing relationships between crops, weather, and market returns. Both planting costs and yield returns are based on data from Department of Agriculture (2010–2011) and are normalized by 30 000 Sri Lankan Rupees (LKR).
Download figure:
Standard image High-resolution image3. Results
Model simulations for the three climate conditions show that, generally, the adaptive farmer has a higher average net agricultural income than either of the baseline farmers, especially under the drier climate scenario (figure 4). However, the adaptive farmer's income has the largest coefficient of variation of the three farmers in each of the climate scenarios (table S3). The adaptive farmer has greater trust in the weather forecast over time especially in the drier climate scenario (figure S2) while the farmer using general climate information has marginally greater trust in the market over time (figure S3); the rice-alone farmer's trust in the market does not change over time since rice is not subject to market fluctuations (figure S3). The adaptive farmer chooses all four crop options over the course of the simulation while the farmer using general climate information chooses between rice and soybeans (figure 5).
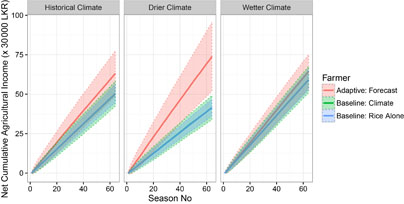
Figure 4 Net agricultural income of farmers across climate conditions. Solid lines represent average values while the shaded regions are +/− 1 standard deviation. The adaptive farmer generally has higher average net income, especially under the drier climate scenario, but also a greater standard deviation than the two baseline farmers.
Download figure:
Standard image High-resolution image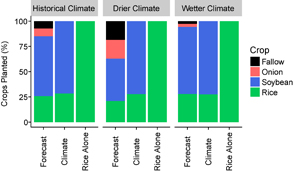
Figure 5 Crops planted by the adaptive ('Forecast') and baseline farmers ('Climate' and 'Rice Alone') across the three climate scenarios. The adaptive farmer is the only farmer who plants onions across the three climate scenarios.
Download figure:
Standard image High-resolution imageWhen education levels are varied, results show that the less educated, adaptive farmer has lower average net agricultural income than the more educated, adaptive farmer in the historical and drier climate scenarios (figure 6). In the wetter climate scenario, however, there is no difference in net agricultural income between the two farmers. Generally, the less educated, adaptive farmer has lower trust in the forecast and market than the more educated, adaptive farmer (figures S4 and S5). The more educated, adaptive farmer generally plants more soybeans across the climate scenarios as well as more onions in the drier climate scenario (figure 7).
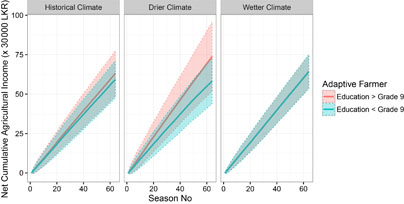
Figure 6 Net agricultural income as a function of the adaptive farmer's education. Solid lines represent average values while the shaded regions are +/− 1 standard deviation. The more educated farmer has higher average net income than the less educated farmer in the historical and drier climate scenario but the two farmers have comparable net income in the wetter climate scenario.
Download figure:
Standard image High-resolution image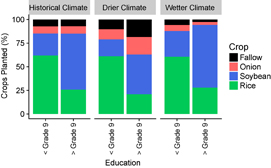
Figure 7 Crops planted across the three climate scenarios as a function of the adaptive farmer's education. The more educated farmer (> grade 9) generally plants more soybean across the climate scenarios and more onions during the drier climate scenario.
Download figure:
Standard image High-resolution imageAll of the results above were simulated with a forecast skill of 70%, the current accuracy of Meteorological Department of Sri Lanka's forecasts. A sensitivity analysis of forecast skill shows that as forecast skill increases, the adaptive farmer's net agricultural income and trust in the forecast both generally increase as well (figure 8). Changing the initial trust level of forecasts or threshold at which trust in the forecast is lost does not affect the adaptive farmer's net agricultural income (figures S6 and S7). Changing the initial trust level of market or the threshold at which farmer loses trust in the market, however, both have a significant impact on the farmer's net agricultural income (figures S8 and S9). As the adaptive farmer's expected return for the market approaches the maximum return values, the farmer's net agricultural income decreases (figure S10).

Figure 8 Sensitivity analysis of forecast skill.As forecast skill increases, the net agricultural income (a) and trust in forecast (b) both generally increase but there is no change in market trust (c).
Download figure:
Standard image High-resolution image
4. Discussion
Our empirically-grounded simulation reproduces multiple patterns that are expected in the real system, thereby increasing the confidence with which we can interpret the model results. Notably, we would expect a farmer's cumulative net agricultural income to increase over time; farmers would pursue another livelihood if they were chronically losing money on their farming operations. We would also expect the farmer who only plants rice to have a lower coefficient of variation in their net agricultural income than a farmer who depends on market-dependent crops. Both of these patterns are verified by our model outputs (figure 4). Our current field data lack the resolution necessary to capture differences in net agricultural income as a function of education, so additional data collection is needed to assess the model results presented in figure 6.
Consistent with empirical findings of Patt et al (2005) and Balaji and Craufurd (2014), our simulation indicates that the adaptation practice of using seasonal forecasts could improve economic outcomes. In other words, our model results show that by using forecast information, the adaptive farmer has higher average net agricultural income than a farmer who only plants rice or a farmer who selects crops based only on average climate information. The difference in income is primarily driven by the diverse portfolio (i.e. includes all four options) of crops planted by the adaptive farmer over the 64 seasons in the simulation, specifically the prevalence of onions under the drier climate scenario. The modeling does not take into account, however, how an influx of onions from neighboring farming areas into the market could systematically drive down the returns for the crop. Crop diversification has been recognized as a significant factor in increasing resilience of agricultural systems (Mijatović et al 2013). However, structural constraints (such as subsidy programs) are a contributing factor in farmers' lack of interest in this adaptation strategy (Lin 2011).
When water resources are plentiful, on the other hand, similar income profiles emerge from differing mixes of crop choices. In particular, the adaptive farmer with greater than grade 9 education plants more soybeans than onions or rice but has the same average income as the adaptive farmer with less than grade 9 education. These dynamics highlight that the impact of the current crop economics of the crops on farmer livelihoods varies depending on the climate scenario, with the drier climate scenario benefiting farmers who are willing to take more risks (i.e. planting onions, a crop dependent on market dynamics) while the wetter climate scenario reduces income disparity between the farmers. Our results indicate that when resources are scarce (i.e. drier climate scenario), varying decisions (i.e. use of forecast vs just planting rice) could increase income disparities between groups. This is consistent with Fum and Holder (2010)'s findings that disparities in natural resources can exacerbate income inequality. The accumulation of wealth by some farmers can have a compounding effect, making these farmers more able to invest in new technologies, which increase production and income, and could further buffer them from environmental changes (Reardon and Taylor 1996, Reardon et al 2000).
In addition to higher average incomes, the adaptive farmer (regardless of education levels) has higher income variability than the baseline farmers, a pattern generally observed across farmers using forecasts (Ash et al 2007). Farmers who lack the financial capital to buffer them from the income variability might be more reluctant to diversify away from rice, a crop with stable returns; a general reluctance to diversify has been noted by many field studies including Thiruchelvam (2005). An analysis of ADAPT-SL survey data shows that high economic status was positively associated with planting non-rice food crops during the dry season (Burchfield and Gilligan 2016), further indicating that crop diversification is not an equally accessible adaptation strategy. In our modeling effort, we assume that farmers have the necessary capacity to obtain loans as needed (i.e. their crop selections are not constrained by their actual bank accounts). This is in large part due to the presence of a debt economy in Sri Lanka. In future iterations, the model could be extended to explore the impact of economic as well as other constraints such as imperfect access to forecasts or markets and biophysical limitations on farmer livelihoods (Peng et al 2004, Hansen et al 2011, Dilling and Lemos 2011, Esham and Garforth 2013, Berundharshani and Munasinghe 2015, Jones et al 2015, Roncoli 2010).
Our games in the field show that, while farmers' understanding of the probabilistic forecasts has generally been mixed (with some arguing farmers are unable to understand them and some showing otherwise (Patt and Gwata 2002, Hansen et al 2004, Roncoli 2006, Lemos and Dilling 2007, Suarez and Tall 2010, Unganai et al 2013)), farmers in System MH are responsive to forecasts, particularly to the probabilities of wet and dry seasons. Changes in the probability of a normal season did not seem to greatly influence farmers' crop selection, a pattern observed in other countries (Grothmann and Patt 2005). Additionally, farmers' responses to forecasts were moderated by education, which was incorporated into our assessment, and coordination among farmers, which was outside the scope of this analysis. The impact of social interactions on attitudes towards use of climate observation is not insignificant (Thomas et al 2007, Acosta-Michlik and Espaldon 2008, Balbi and Giupponi 2009, Crane et al 2010, Marshall et al 2011, Berger and Troost 2014, Muita et al 2016), and could positively influence farmers' adaptation (Esham and Garforth 2013, Truelove et al 2015). Extending our single-agent model to incorporate multiple autonomous agents could enable us to actively explore the impacts of heterogeneity and coordination on farmer livelihoods, thereby improving our understanding of who might use forecast information (Jain et al 2015, Vogel et al 2015). Additional field work is needed to characterize the heterogeneity of farmers (e.g. differences in risk tolerances, prior experiences with extreme weather events such as floods, and perceptions of climate change) and determine the relative importance of social information vs a farmer's own experiences in influencing their adaptation behavior (Berger 2001, Hansen et al 2004, Sabater and Sierra 2005, Withange et al 2009, Karali et al 2014, Pérez et al 2016).
Consistent with findings from other studies (e.g. Ziervogel et al 2005), our sensitivity analysis confirms the importance of forecast skill on farmer outcomes; as the forecast skill increases, not only does the farmers' trust in the forecast increase but the increased accuracy results in higher agricultural income. For a fixed forecast skill, however, changing the farmer's initial trust levels or trust threshold for the forecast has minimal impact on the farmer's net income. Market-related variables such as the market trust threshold and the ratio of actual to maximum return, on the other hand, have large impacts on net income; as the farmer became more tolerant of risks with the market, the farmer was more likely to plant onions, the more profitable option. Therefore, providing farmers with more information about market conditions (currently lacking in Sri Lanka) could have a notable impact on farmers' financial outcomes. Acosta-Michlik and Espaldon (2008) recognize that both production and market support are needed adaptations in a changing climate.
Although increased rainfall variability is the dominant climate change impact expected in Sri Lanka, farmers in the dry zone have observed a shift in the local climate: droughts have been getting worse, an observation that is consistent with analysis of meteorological data (Seo et al 2005, Esham and Garforth 2013, Truelove et al 2015, Gunda et al 2016). Since accurate perception of weather patterns has been shown to be a significant predictor of adaptation, it is not surprising that Sri Lankans have begun adapting by managing their farming practices or diversifying their income, with changing crops being the most popular on-farm adaptation strategy (Esham and Garforth 2013, Piya et al 2013, Truelove et al 2015). Although farmers have reported that adaptation strategies have improved crop productivity, lack of information on climate change has been a notable obstacle to their adaptation (Esham and Garforth 2013). Therefore, information access issues need to be also considered in adaptation assessments.
Overall, our research adds to the growing literature that providing forecasts to farmers has considerable potential for helping farmers adapt to the changing climate. Our results highlight the importance of understanding and incorporating the impact of varying crop economics on farmer decisions in adaptation assessments. Additional data and research is needed to continue to characterize farmer behavior and to understand leverage points for enhancing adaptive capacity. This additional work is especially critical since our results indicate that when water resources are scarce (i.e. drier climate scenario), farmer incomes could become significantly stratified, potentially compounding existing disparities in farmer's financial and technical abilities to use forecasts to inform their crop selections. System MH is just one of many regions that promote the production of certain crops through subsidies. While such programs could ensure food security in the short-term, the long-term implications of these dynamics have received limited attention. Our modeling approach, which is publically available via openabm, could be easily modified to look at the specific dynamics of varying crop economics in other regions of the world (for e.g. in the Limpopo province of South Africa).
Acknowledgments
This work is supported by the National Science Foundation (NSF) Graduate Research Fellowship Program under Grant No. DGE-0909667; NSF Grant No. EAR-1204685; a Public Scholar grant from the Curb Center for Art, Enterprise, and Public Policy; and Vanderbilt University's Graduate School Dissertation Enhancement Grant. These funding sources had no impact on research design, data interpretation, or in the writing of the report. We thank the National Building Research Organization for facilitating the games in the field, and specifically, the Climate Research Unit for conducting and sharing the System MH Survey data. We thank Steinar Moen for modeling assistance and Practical Action of Sri Lanka for providing context for games conducted in Sri Lanka. Last but not least, we thank members of the Vanderbilt Institute of Energy and Environment and ADAPT-SL research group, including George Hornberger, Arielle Tozier de la Poterie, Heather Truelove, and Amanda Carrico for their feedback throughout this effort.