

Abstract
Understanding long-term trends in aerosol loading and properties is essential for evaluating the health and climatic effects of these airborne particulates as well as the effectiveness of pollution control policies. While many studies have used satellite data to examine the trends in aerosol optical depth (AOD), very few have investigated the trends in aerosol properties associated with particle size, morphology, and light absorption. In this study, we investigate decadal-scale (13–15 year) trends in aerosol loading and properties during 2001–2015 over three populous regions: the Eastern United States (EUS), Western Europe (WEU), and Eastern and Central China (ECC). We use observations from MISR (Multi-angle Imaging SpectroRadiometer) and MODIS (Moderate resolution Imaging Spectroradiometer). Relationships between aerosol property trends and air pollutant emission changes are examined. We find that annual mean AOD shows pronounced decreasing trends over EUS and WEU regions, as a result of considerable emission reductions in all major pollutants except for mineral dust and ammonia (NH3). Over the ECC region, AOD increases before 2006 due to emission increases induced by rapid economic development, fluctuates between 2006 and 2011, and subsequently decreases after 2011 in conjunction with effective emission reduction in anthropogenic primary aerosols, sulfur dioxide (SO2), and nitrogen oxides (NOx). The fraction of small-size AOD (<0.7 μm diameter), Ångstrom exponent and single-scattering albedo have generally decreased, while the fractions of large-size (>1.4 μm diameter), nonspherical and absorbing AOD have generally shown increasing trends over EUS and WEU regions, indicating that fine and light-scattering aerosol constituents have been more effectively reduced than coarse and light-absorbing constituents. These trends are consistent with the larger reduction ratios in SO2 and NOx emissions than in primary aerosols, including mineral dust and black carbon (BC). Over the ECC region, no significant trends are observed with respect to size distribution, morphology, or light absorption, which we attribute to a simultaneous increase in emissions of SO2, NOx, and primary aerosols including BC before 2006, and a simultaneous decrease after 2011. This study demonstrates the importance and usefulness of satellite-borne sensors, particularly MISR, in association with evaluating the effectiveness of air pollution control policies.
Export citation and abstract BibTeX RIS
1. Introduction
Widespread aerosol pollution leads to about three million premature deaths per year worldwide (Brauer et al 2016, Lelieveld et al 2015). Additionally, aerosols substantially affect global and regional climate by absorbing and scattering solar radiation (direct effect) and by altering cloud properties (indirect effect), which represent the largest uncertainty among anthropogenic influences on climate change (Stocker et al 2013, Wang et al 2015). The high degree of uncertainty with respect to the aerosol direct effect is attributed to uncertainties in the aerosol optical depth (AOD) and other aerosol optical and microphysical properties, which constitute the basic parameters in determining aerosol radiative forcing and the subsequent feedback to climate systems (Stocker et al 2013). While the impact of AOD is well-known, the particle size, morphology, and single-scattering albedo also strongly affect the magnitude and sign of aerosol radiative forcing (He et al 2015, Stocker et al 2013, Wu et al 2016). With the objective of mitigating adverse health and climatic effects, major countries/regions, including the United States, Europe, and China, have taken aggressive steps to reduce air pollutant emissions and hence aerosol concentrations in the past two decades, which would substantially result in aerosol property changes (He et al 2016, Mehta et al 2016). In order to quantify aerosol health and climatic effects, as well as to evaluate the effectiveness of emission control policies, it is imperative to understand the trends in both aerosol loading and particle properties over populous regions.
Aerosol loading and particle properties have been measured by both ground-based instruments and satellite-borne sensors. While the former are usually sparsely located and point based, the latter are capable of obtaining continuous long-term aerosol measurements with broad spatial coverage, thereby providing valuable inputs for trend analyses (Mehta et al 2016). Numerous studies have utilized satellite observations to investigate the global or regional trends in aerosol optical depth (AOD) in the past two decades (e.g. Boys et al 2014, de Meij et al 2012, Dey and Di Girolamo 2011, He et al 2016, Mao et al 2014, Mehta et al 2016, Yoon et al 2014, Zhang and Reid 2010). Most of them (e.g. Boys et al 2014, de Meij et al 2012, Mao et al 2014, Yoon et al 2014) reported decreasing trends in the United States and Europe, and increasing trends in China, while a few recent studies (He et al 2016, Mehta et al 2016) showed decreasing trends in China in the last few years. Additionally, a number of studies have evaluated the relationships between AOD trends and emission changes globally (Chin et al 2014, de Meij et al 2012, Pozzer et al 2015, Streets et al 2009) and in Asia (Itahashi et al 2012, Lalitaporn et al 2013).
However, very few studies have investigated the trends in aerosol optical and microphysical properties other than AOD, which are closely related to changes in certain aerosol constituents and therefore provide additional perspective and insight into the linkage between aerosol trends and emission changes. Specifically, only limited studies employing Moderate resolution Imaging Spectroradiometer (MODIS) data have examined the trends in Ångstrom exponent, fine mode fraction, and single-scattering albedo, over only a couple of regions including East Asia and South Africa (Kang et al 2016, Kim et al 2014, Kumar et al 2014, Lyapustin et al 2011, Panicker et al 2013, Tan et al 2015). Furthermore, there are concerns with reference to the quantitative accuracy of MODIS-derived aerosol particle properties over land (NASA 2015a, 2015b). Therefore, we are motivated to explore trends in aerosol properties reported by the Multi-angle Imaging SpectroRadiometer (MISR) instrument, whose observational strategy enables the retrievals of aerosol types associated with their size, shape, and light absorption in addition to total AOD (Kahn et al 2001, Kahn and Gaitley 2015).
In this study, we combine MISR and MODIS aerosol data during 2001–2015 to investigate trends in aerosol particle properties and how they are related to emission changes as well as pollution control policies. In accordance with the objectives, we have selected large populous regions that have experienced substantial pollution control policies as target regions. Three regions are selected in the present study: the Eastern United States (EUS; 29°−45° N, 70°−98° W), Western Europe (WEU; 37°−59° N, 10° W−17° E), and Eastern and Central China (ECC; 21°−41° N, 102°−122° E), as shown in figure 1. We select such large regions for analysis in order to minimize the impact of variations in meteorological conditions and long range transport of pollutants from outside of the target regions. The EUS and WEU regions have undertaken ambitious emission control policies for several decades, while the ECC region is characterized by extremely high aerosol loadings and significant control policies have only emerged in the last decade.
2. Methodology and data
2.1. Satellite data
MISR onboard the Terra satellite has been acquiring images of the Earth since February 2000. The moderately high spatial resolution (275 m−1.1 km) observations at 9 along-track viewing angles in each of 4 visible/near-infrared spectral bands provide near-global coverage every 9 d (Diner et al 1998) and sensitivity to particle type over both land and ocean, in addition to total AOD (Kahn et al 2001, Kahn and Gaitley 2015). In this study, we employ the Level 3 monthly component global aerosol product (MIL3MAE) version F15_0031 at a spatial resolution of 0.5° × 0.5°. The variables obtained are total AOD at 555 nm, Ångstrom exponent, single-scattering albedo at 555 nm, and AOD at 555 nm for 6 aerosol types, including small-size (< 0.7 μm diameter), medium-size (0.7−1.4 μm diameter), large-size (>1.4 μm diameter), spherical, nonspherical, and absorbing aerosols. The errors anticipated over land and ocean in MISR AOD data are on the order of ±0.05 or ± (0.20 × AOD), whichever is higher (Kahn et al 2005, Kahn et al 2010). MISR aerosol types from individual retrievals are considered to be generally reliable when AOD >0.15 or 0.2, while aerosol type sensitivity is diminished for smaller AOD (Kahn and Gaitley 2015, Kahn et al 2010). Note that we use only annual or seasonal mean in this study and the uncertainties are smaller than those for individual retrievals.
We also utilize AOD observations from the MODIS sensors onboard both Terra and Aqua satellites, which have been observing the Earth with near-daily global coverage since February 2000 and May 2002, respectively, with multiple wavelength bands over a 2330 km swath (King et al 2003). We obtain AOD retrievals at 550 nm from the Level 3 monthly atmosphere products for both Terra (MOD08, Collection 6) and Aqua (MYD08, Collection 6) at a resolution of 1° × 1°. The accuracy of AOD retrievals has been estimated to be about ± 0.05 ± 0.15 × AOD over land and ± 0.03 ± 0.05 × AOD over ocean (Levy et al 2010, Remer et al 2005). Besides the total AOD, the MODIS Collection 5 product also provides retrievals of other aerosol properties such as Ångstrom exponent and fine mode AOD. However, these parameters have not been used in our analysis because they are considered to be inaccurate over land and have been eliminated from Collection 6 (NASA 2015a, 2015b).
We obtain regional mean aerosol properties by calculating the arithmetic mean of valid monthly values within the target regions (figure 1), and subsequently derive annual and seasonal mean values for a 15 year (2001–2015, for MISR and MODIS/Terra) and 13 year (2003–2015, for MODIS/Aqua) period. The trends in annual/seasonal aerosol properties and their statistical significance at the 0.05 level are determined using two methods: the linear regression associated with Student's t-test, and the Mann–Kendall test associated with Sen's slope. The Mann–Kendall test (Gilbert 1987, Kendall 1975, Li et al 2014, Mann 1945) is a nonparametric (distribution-free) test to identify whether monotonic trends exist in a time series. While the regression analysis requires that the residuals from the fitted regression line be normally distributed, this assumption is not required by the Mann–Kendall test. Therefore, the Mann–Kendall test is more suitable for nonnormally distributed or missing data. Tables S1–S3 available at stacks.iop.org/ERL/12/054021/mmedia compare the trends determined using these two methods and indicate that both the magnitude and statistical significance of the trends are similar. The Mann–Kendall test appears to be a little more stringent since there are a few cases where the trends are significant based on Student's t-test but insignificant based on the Mann–Kendall test.

Figure 1 Target regions for this study: the Eastern United States (EUS), Western Europe (WEU), and Eastern and Central China (ECC).
Download figure:
Standard image High-resolution image2.2. Emission inventory
We have collected emission estimates for major air pollutants in the three target regions. For the United States, we obtain state-level emissions of all sectors considered in this study, including anthropogenic sources (e.g. power plants, industrial sector, residential and commercial sectors, transportation sector, solvent use, livestock farming and fertilizer application, and agricultural residue burning), wildfires, and dust from the National Emission Inventory (NEI) trend report (US Environmental Protection Agency 1998, 2016a). Note that emission estimates of the NEI trend report are different from those of the NEI (US Environmental Protection Agency 2016b). While the NEI provides detailed emission estimates for all major air pollutants, it is updated only for several discrete years and there are inconsistencies between different years due to intervening improvements of emission estimation methods. In contrast, the NEI trend report includes consistent and continuous emission estimates for key pollutants for all years during the study period. Black carbon (BC) emissions are absent from the NEI trend report. For this reason, they are derived by using the sector-specific ratio of BC to PM2.5 from the 2014 NEI.
For Europe, country-level emissions of anthropogenic sectors are obtained from the European Environment Agency air pollutant emission data viewer (www.eea.europa.eu/data-and-maps/data/data-viewers/air-emissions-viewer-lrtap), which provides access to the data contained in the European Union emission inventory report 1990–2014 under the Convention on Long-range Transboundary Air Pollution (CLRTAP; European Environment Agency 2016). Wildfire emissions are taken from the Global Fire Emissions Database (GFEDv4.1; www.globalfiredata.org/data.html). Dust emissions are not included.
For China, provincial emission inventories of anthropogenic sectors for 2005–2014 have been developed by Tsinghua University (Wang et al 2014 and updates, Zhao et al 2013), and those for the years before 2005 have been obtained from the Regional Emission inventory in ASia (REASv2.1; Kurokawa et al 2013). To ensure consistency between these two datasets, we scale the REAS inventory to match the Tsinghua inventory in 2005. Note that estimates of ammonia (NH3) emissions after 2012 are not available. Similar to Europe, wildfire emissions are taken from GFEDv4.1 and dust emissions are not included.
We calculate total emissions within the target regions (figure 1) by summing up the emissions in all administrative regions (states for the United States, countries for Europe, and provinces for China) covered by target regions. The target region sometimes covers a part of a certain administrative region for which emissions within the target region are calculated using the product of total emissions in the administrative region and the percentage of this administrative region covered by the target region.
3. Results and discussion
3.1. Trends in AOD
Figure 2 shows the annual mean AOD during 2001–2015 in three target regions. There are noticeable discrepancies in the magnitude of AOD observed by MISR, MODIS/Terra, and MODIS/Aqua, most likely due to differences in spatio-temporal sampling, observing strategy, and retrieval algorithms (Kahn et al 2009). For EUS and WEU regions, AOD measurements from MISR and MODIS/Aqua are quite close to each other, and are smaller than those of MODIS/Terra. For the ECC region, MODIS/Terra and MODIS/Aqua results are similar and significantly larger than the results derived from MISR. Despite the discrepancy in magnitude, inter-annual AOD trends, which are the focus of this study, show close similarity between the three sensors. The annual mean AOD values in EUS and WEU regions display pronounced decreasing trends according to all three sensors, and are statistically significant at the 0.05 level based on both Student's t-test and the Mann–Kendall test. The declining trends are consistent with previous studies (e.g. Boys et al 2014, de Meij et al 2012, Mao et al 2014, Yoon et al 2014). In the ECC region, AOD increases from 2001 to a peak value around 2006, and after fluctuations another peak occurs in 2011, whereas a decreasing trend is seen after 2011. We perform linear regression analysis seperately for the periods of 2001–2006 and 2006–2015, and find that both the increasing and decreasing trends for the first and second periods are statistically significant. The decreasing trends over EUS and WEU regions and over the ECC regions after 2006 are resulting from the effective enforcement of emission control policies, which will be elaborated in section 3.3.
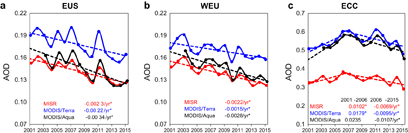
Figure 2 Annual mean AOD during 2001–2015 observed by MISR, MODIS/Terra, and MODIS/Aqua in three target regions. The dashed lines and the numbers in the legends represent trendlines and slopes (yr−1) determined by linear regression, respectively. The slopes are marked with a star (⁎) if they are statistically significant at the 0.05 level based on Student's t-test. The trends and their statistical significance determined by the Mann–Kendall test associated with Sen's slope are shown in table S1.
Download figure:
Standard image High-resolution imageWe also examine the trends in seasonal mean AOD, as summarized in figure 3. Although the magnitude of AOD trends observed by the three sensors differs to certain degree, the signs of trends are largely consistent. Specifically, decreasing trends are shown in all seasons over EUS and WEU regions, and in the ECC region after 2006, while increasing trends are noted in all seasons in the ECC region before 2006. The only disagreement in sign occurs in DJF (December-January-February) in the EUS region, where MISR and MODIS/Aqua report negative trends, but MODIS/Terra reports a slightly positive trend. Despite this difference, it is evident that AOD trends, regardless of sign, are much more pronounced in JJA (June-July-August) than in DJF. This pattern can be explained by several reasons. First, the AOD magnitude is larger in JJA than that in DJF (see figure S1). Second, the small-size AOD, which accounts for a larger fraction of the total AOD in JJA due to the active formation of secondary aerosols (see figure 5), has been more significantly reduced than the large-size AOD over EUS and WEU regions (see section 3.2). Third, the concentrations of sulfate and nitrate, which are major light extinction constituents, are more sensitive to emission changes in JJA than in DJF because of distinct chemical regimes (Wang et al 2011, Zhao et al 2015).
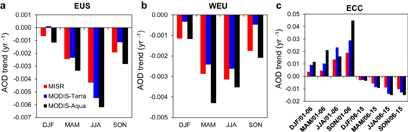
Figure 3 Seasonal AOD trends (yr−1) observed by MISR, MODIS/Terra, and MODIS/Aqua in three target regions. The trends are determined by linear regression based on seasonal AOD values. The four seasons are defined as DJF (December-January-February), MAM (March-April-May), JJA (June-July-August) and SON (September-October-November).
Download figure:
Standard image High-resolution image3.2. Trends in other aerosol particle properties
In addition to AOD, MISR measures a number of aerosol particle properties such as particle size, morphology, and light absorbing property, which are tied to changes in certain aerosol constituents and therefore provide more insight into the drivers of the aerosol trends. The inter-annual trends in these particle properties are shown in figure 4 and figure S2. In both EUS and WEU regions, the small-size (<0.7 μm diameter) AOD decreases substantially, while medium-size (0.7−1.4 μm diameter) and large-size (>1.4 μm diameter) AODs decrease slightly (figure S2). As a result, figures 4(a) and (b) illustrate pronounced decreasing and increasing trends in the fractions of small-size and large-size AOD, respectively. The Ångstrom exponent is also an indicator of particle size, with smaller values corresponding to larger particle size (Panicker et al 2013). Figure 4(c) shows significant decreasing trends in the Ångstrom exponent over EUS and WEU regions. Additionally, figure 4(d) illustrates that the fraction of nonspherical AOD, which is predominantly comprised of mineral dust and tends to have larger sizes than spherical particles, has been increasing over EUS and WEU regions. These results indicate that the decrease in AOD over these two regions is associated with a reduction in the fraction of fine particles and an increase in the fraction of coarse particles. As described in section 3.1, this is partly responsible for the large AOD reduction ratio in JJA than in DJF as fine particles are more abundant in JJA. Figures 4(e) and (f) also reveal significant increasing and decreasing trends in the fraction of absorbing AOD and single-scattering albedo, respectively, over the EUS region. In the WEU region, trends in these two parameters are of the same sign but less pronounced than those of the EUS region. Reasons for the observed trends will be discussed in section 3.3. In contrast, however, no significant trends in particle size distribution, morphology, and light absorption property are found over the ECC region (figures 4(a)−(f), figure S2). Since the trends in the abovementioned aerosol properties were not investigated previously using satellite data, we compare our results with the trends during 2001–2013 derived from the level 2 Aerosol Robotic Network (AERONET) data reported in Li et al (2014). Li et al (2014) showed decreasing trends in AOD over Europe and North America, and in Ångstrom exponent over Europe, which are in agreement with the present study. The Ångstrom exponent trends over North America differ according to sites, with over half sites showing increasing trends, while the present study indicates a significantly decreasing trend in the EUS region.
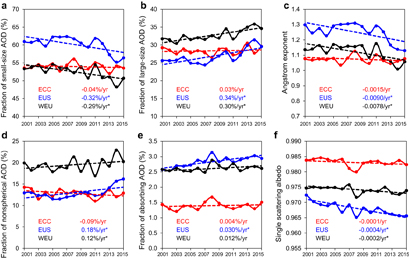
Figure 4 Annual mean aerosol particle properties during 2001–2015 observed by MISR in three target regions: (a) the fraction of small-size AOD; (b) the fraction of large-size AOD; (c) Ångstrom exponent; (d) the fraction of nonspherical AOD; (e) the fraction of absorbing AOD; (f) single-scattering albedo. The dashed lines and the numbers in the legends represent trendlines and slopes determined by linear regression, respectively. The slopes are marked with a star (⁎) if they are statistically significant at the 0.05 level based on Student's t-test. The trends and their statistical significance determined by the Mann–Kendall test associated with Sen's slope are shown in table S2.
Download figure:
Standard image High-resolution imageWe also investigate the long-term trends in seasonal aerosol particle properties and use the fraction of large-size AOD and single-scattering albedo as examples, as shown in figure 5. Over EUS and WEU regions (figures 5(a) and (b)), the fractions of large-size AOD depict similar increasing trends in all seasons, which are all statistically significant. The magnitude of seasonal trends ranges between 0.25%–0.38% yr−1 and 0.20%–0.34% yr−1 over EUS and WEU regions, respectively. In the ECC region, we do not find a significant trend for any of the four seasons (figure 5(c)) in association with the insignificant trend in annual mean values (figure 4(b)). Compared to the fraction of large-size AOD, the trend in seasonal single-scattering albedo is subject to a larger fluctuation (figures 5(d)−(f)). Over EUS and WEU regions, declining trends are noted in all seasons, though these trends are not always statistically significant due to the degree of interannual variability. In the ECC region, the trends are not significant for all seasons, except JJA, in line with the insignificant trend in annual mean values.
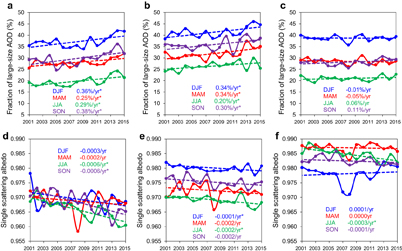
Figure 5 Seasonal mean fraction of the large-size AOD and single-scattering albedo during 2001–2015 observed by MISR in three target regions. The fraction of large-size AOD: (a) EUS, (b) WEU, and (c) ECC. Single-scattering albedo: (d) EUS, (e) WEU, and (f) ECC. The dashed lines and the numbers in the legends represent trendlines and slopes (yr−1) determined by linear regression, respectively. The slopes are marked with a star (⁎) if they are statistically significant at the 0.05 level based on Student's t-test. The trends and their statistical significance determined by the Mann–Kendall test associated with Sen's slope are shown in table S3.
Download figure:
Standard image High-resolution image3.3. Relationships between aerosol particle property trends and emission changes
Having analyzed the trends in aerosol loading and properties, we now investigate whether observed trends are consistent with changes in air pollutant emissions due to emission control policies. Figure 6 summarizes the emissions of sulfur dioxide (SO2), nitrogen oxides (NOx), non-methane volatile organic compounds (NMVOC), NH3, particulate matter with a diameter less than 10 μm (PM10), particulate matter with a diameter less than 2.5 μm (PM2.5), and BC in the three target regions. Ambient aerosols are comprised of primary aerosols from dust as well as other emission sources, and secondary aerosols produced by chemical reactions of gaseous precursors including SO2, NOx, NMVOC, and NH3. While dust aerosols are predominantly coarse particles and secondary aerosols are dominated by very fine particles, primary aerosols other than dust span a large size range, leading to a mean size intermediate between dust and secondary constituents (Seinfeld and Pandis 2006). Absorbing AOD is mainly contributed by BC and dust aerosols from primary emissions, while nonspherical AOD is predominantly comprised of dust aerosols.

Figure 6 Emissions of major air pollutants in three target regions: (a) EUS, (b) WEU, and (c) ECC. All emissions are normalized to 2001 in WEU and ECC regions, but to 2002 in the EUS region.
Download figure:
Standard image High-resolution image
For the EUS region, emissions of all pollutants except for NH3 and dust (PM10-dust in figure 6) decreased considerably during the study period, in association with the implementation of a series of control measures under the Clean Air Act (Xing et al 2013). NH3 emissions remained largely unchanged due to lack of control policies (Xing et al 2013). The decline in emissions of multiple pollutants together accounts for the decreasing AOD trend, as was revealed by several previous studies (Chin et al 2014, de Meij et al 2012, Pozzer et al 2015, Streets et al 2009). Figure 6 also shows that emissions of mineral dust changed insignificantly, and those of primary aerosols (PM10 and PM2.5) other than dust decreased slightly by 10%–15%. In contrast, the emissions of SO2, NOx, and NMVOC decreased substantially by 68%, 51%, and 26%, which we associate with a larger reduction in the proportion of small secondary aerosols. As a result, the fraction of large-size/small-size AOD has increased/decreased and the average particle size has shifted towards larger values. The increasing trend in the fraction of nonspherical AOD may be explained by the same reasons. Moreover, we attribute the increasing fraction of absorbing AOD to the following two factors. First, the emissions of mineral dust, a light absorbing aerosol type especially when particle size is sufficiently large, have changed insignificantly, resulting in an increasing contribution of dust aerosols to the total AOD. Second, the reduction ratios in SO2 and NOx emissions (68% and 51%) are much larger than that in BC (28%), likely leading to more pronounced decreasing trends in concentrations of sulfate and nitrate compared with BC, resulting in a larger contribution of BC to the total AOD.
For the WEU region, the aerosol property trends, the emission trends, and the relationships between the two are very similar to those of the EUS region. As described in section 2.2, dust emission estimates in the WEU region are not available. Xing et al (2015a, 2015b) and Chin et al (2014) simulated the concentrations of mineral constituents of aerosols during 2001–2010 and AOD attributed to dust during 2001–2009, respectively, using chemical transport models in which dust emissions were calculated online as a function of meteorological fields. The results (summarized in figure S3) showed that the concentrations of mineral constituents of aerosols or AOD attributed to dust, which represent overall effects of regional dust emissions and long-range transport of dust from outside of the region, did not change significantly during 2001–2010/2009 over the WEU or a larger European region. As noted above, this insignificant change in mineral dust is partly responsible for the increasing fractions of large-size, nonspherical and absorbing AOD.
In the ECC region, the emissions of different air pollutants show distinct trends. The emissions of SO2 and primary aerosols other than dust increase until 2005/2006 due to rapid economic and industrial development, and subsequently decrease due to the implementation of control policies established in China's 11th and 12th Five-Year Plans (for the periods of 2006–2010 and 2011–2015, respectively) and the Air Pollution Prevention and Control Action Plan (for the period of 2013–2017) (Wang et al 2014). NOx emissions increase to a peak in 2011/2012 and then decrease because of large-scale installation of NOx removal equipment imposed by the 12th Five-Year Plan and the Air Pollution Prevention and Control Action Plan (Xia et al 2016). The emissions of NMVOC and NH3 continuously increase owing to insufficient control measures (Wang et al 2014). Figure 6 shows that emissions of all pollutants increase before 2006, and decrease after 2011, except for NMVOC and NH3. Such emission changes are likely to be responsible for increasing and decreasing AOD trends during these two periods. More specifically, concentrations of both primary aerosols and secondary inorganic aerosols (sulfate and nitrate) are expected to increase before 2006 and decrease after 2011. Meanwhile, Xing et al (2015a, 2015b) and Chin et al (2014) showed insignificant trends in concentrations of mineral constituents of aerosols or dust-related AOD during 2001–2010/2009 (figure S3). Taken together, these factors may explain insignificant trends in the proportions of small-size, large-size, and nonspherical AOD over the duration of the record. Similarly, the nearly unchanged fraction of absorbing AOD may also be explained mainly by simultaneously increasing emissions of BC, SO2, and NOx (and hence simultaneously increasing concentrations of BC, sulfate, and nitrate) before 2006 and simultaneously decreasing emission of these pollutants after 2011.
To strengthen the linkage between aerosol property trends and emission changes proposed above, we have also investigated the impact of some other factors that may explain the observed aerosol trends, including the stability of the satellite retrievals, the trends in meteorological conditions, and the long-range transport of boreal fires. The results show that these factors are not likely to be major reasons for observed aerosol property trends (see section 1–3 in the supplementary material).
4. Conclusions
In this study, we have investigated aerosol particle property trends during 2001–2015 in three populous regions (EUS, WEU, and ECC) and demonstrated their consistency with emission changes. Over EUS and WEU regions, annual mean AOD values show pronounced decreasing trends as a result of considerable emission reductions in all major pollutants, except for mineral dust and NH3. In the ECC region, AOD increases before 2006 due to emission increases induced by rapid economic development, fluctuates between 2006 and 2011, and subsequently decreases after 2011 in association with the effective emission reduction in primary aerosols, SO2, and NOx. In all of these regions, the magnitude of AOD trends is much larger in JJA than that in DJF.
In EUS and WEU regions, the fraction of small-size AOD, Ångstrom exponent, and single-scattering albedo have displayed a generally decreasing trend, while the fractions of large-size, nonspherical and absorbing AOD have shown a generally increasing trend, indicating that fine and light scattering aerosol constituents have been more effectively reduced than coarse and light absorbing constituents. These trends are consistent with the larger reduction ratios in SO2 and NOx emissions than in primary aerosols, including mineral dust and BC. In the ECC region, no significant trends are noticed with respect to particle size distribution, morphology, or light absorption, which we attribute to a simultaneous increase/decrease in the emissions of SO2, NOx, and primary aerosols, including BC during most of the study period. For all three regions, the interannual trends in seasonal particle size and light absorption are largely similar in all seasons.
The particle size, morphology, and single-scattering albedo strongly affect the aerosol-induced scattering and absorption of radiation and the consequent impact on climate radiative forcing (He et al 2015, Stocker et al 2013, Wu et al 2016). In order to develop more realistic multidecadal aerosol property datesets/scenarios for climate studies, changes in both aerosol loading and other aerosol properties should be accounted for, and the results from the present study could provide important information.
The present study also demonstrates the importance and usefulness of satellite-borne sensors, particularly those employing multiple viewing angles such as MISR, in relation to evaluating the effectiveness of air pollution control policies. The satellite record shows that the Clean Air Act and the CLRTAP implemented in the United States and Europe have led to a substantial reduction in aerosol loading. In China, however, the stringent control policies established in the 11th and 12th Five-Year Plans and the Air Pollution Prevention and Control Action Plan have successfully reversed the previously increasing trend in aerosol loading. Our findings indicate that control policies in EUS and WEU regions have been less effective in reducing coarse and light absorbing aerosols than in the case of fine, nonabsorbing aerosols. Given that large and medium-size AODs account for about half of the total AOD in these two regions at the present time (figure 4) and that light absorbing aerosols contribute significantly to global warming (Stocker et al 2013), strengthening of control measures targeting the emissions of primary aerosols appears warranted.
Finally, a limitation of the present study is that the relationships between aerosol particle property trends and emission changes, while generally consistent, are qualitative. Future studies employing chemical transport models will enable quantitative assessments of the correspondence between satellite observations and emission changes as well as the contribution of individual emission sources to observed aerosol trends.
Acknowledgments
This study is supported by the Terra MISR project at the Jet Propulsion Laboratory, California Institute of Technology, under contract with NASA. We are grateful for helpful discussions with Ralph Kahn, Yuan Wang, and Longtao Wu. We also acknowledge funding support from the NASA ACMAP project. K N Liou, Y Gu, and B Zhao were supported in part by NSF Grant AGS-1523296.