

Abstract
The Southeast Asian region had been subjected to a drastic reduction in air quality from the biomass burnings that occurred in 2013 and 2015. The smoke from the biomass burnings covered the entire region including Brunei, Indonesia, Malaysia, Singapore and Thailand, with haze particulate matter (PM) reducing the air quality to hazardous levels. Here we report a comprehensive size–composition–morphology characterization of the PM collected from an urban site in Singapore during the two haze events. The two haze events were a result of biomass burning and occurred in two different geographical source regions. We show the similarities and variations of particle size distribution during hazy and clear days during the two haze events. Sub-micron particles (<1 μm) dominate (∼50%) the aerosols in the atmosphere during clear and hazy days. Using electron microscopy, we also categorize the PM, namely soot, organic–inorganic clusters and hybrid particles. The composition and morphology were similar in both the haze events. The majority of the PM is composed of carbon (∼51%) and other elements pertaining to the earth's crust. The complexity of the mixing state of the PM is highlighted and the role of the capture mode is addressed. We also present the morphological characterization of all the classified PM. The box counting method is used to determine the fractal dimensions of the PM, and the dimensionality varied for every classification from 1.79 to 1.88. We also report the complexities of particles and inconsistencies in the existing approaches to understand them.
Export citation and abstract BibTeX RIS

Original content from this work may be used under the terms of the Creative Commons Attribution 3.0 licence.
Any further distribution of this work must maintain attribution to the author(s) and the title of the work, journal citation and DOI.
Introduction
Over the last two years the Southeast Asian region has been a victim of one of the worst transboundary haze episodes resulting from the burning of biomass material (Ho et al 2014, Gaveau et al 2014, Koplitz et al 2016, Lee et al 2017). Many of the burning events are started by farmers who use slash-and-burn techniques in their agricultural practices to clear the land (Lee et al 2017). This increased the pollutant concentrations and resulted in a drastic reduction in air quality. This not only crippled human activity but also threatened the electrical power generating systems that required a continuous supply of clean air. It has also led to a decline in the productivity of the affected regions. The biomass burnings also produce soot with a radiative heating of +0.5 to +0.6 W m−2 (Jacobson 2001), making it the second biggest contributor to global warming after carbon dioxide (Jacobson 2001, Wentzel et al 2003).
The particulate matter (PM) or aerosols from these burnings encompass a variety of conditions unique to this particular region. Singapore is surrounded by the archipelago of Sumatra on the west and Kalimantan on the east, which are home to dense peat forests. The haze events of 2013 and 2015 were a result of peat forest burning in Sumatra and Kalimantan, respectively. In addition to the geographical location, the highly urbanized environment of Singapore also has an impact on air quality. Together, the set of conditions present a very unique and complex character to the aerosols. They have been assumed to involve a complex mixing state with characteristics that are strongly dependant on geography (China et al 2013). The smoke from biomass burning events travelled across land and water masses before it was captured in the urbanized environment of Singapore.
Recent studies on the physical and psychological effects of haze suggested acute physical symptoms and mild psychological distress (Ho et al 2014, Reid et al 2016), while the impact of exposure to smoke was studied using a novel transport model and global fire assimilation systems (GFAS) on Indonesia, Malaysia and Singapore (Koplitz et al 2016). Atmospheric emission studies performed using remote sensing suggested that the emissions of the 2013 haze event represented 5%–10% of Indonesia's annual mean greenhouse gas (GHG) emissions (Gaveau et al 2014). The problem of understanding aerosol transport in the regions of Indonesia, Malaysia, Thailand and Singapore was evaluated using weather research and forecasting (WRF) models which highlighted the spatiotemporal coverage and influence of aerosols from biomass burning in the region (Lee et al 2017). Throughout the literature the composition and morphology was assumed to be known, but actual data on chemistry and morphology was simply non-existent as the literature did not refer to any event pertaining to this region. In this spirit, a study to understand the chemical and morphological properties of the PM has been carried out. We hope that by determining the chemical nature, morphology and size distribution of the PM we may be able to design techniques for their mitigation from ambient air. In addition, the findings described in this work could be useful for elaborating the direct–indirect effects of the PM on climate models in this region.
The present manuscript deals with a study of the size–composition–morphology of the PM. We first present the particle size distribution of the PM from the haze events of 2013 and 2015, followed by a discussion on their compaction and mixing state. This is followed by electron microscopy analysis of the PM: a detailed classification is given of the various types of PM observed in this region. The observed links between the composition and morphology is also outlined. Then we detail the morphology of each form of PM. The notion of using fractals, and its drawbacks in elucidating the characteristics of the PM, is also discussed.
Results and discussion
Particle size distribution
The particle size distribution is derived while the air is sampled in an aerosol monitor (TSI 8533). The measuring system combines photometric measurement of the particle cluster and optical sizing of single particles. The monitors estimate size-segregated aerosol mass concentration over a wide concentration range (0.001–150 mg m−3) in real time. An analysis of the particle size distribution of the PM was performed on the data collected during the haze events of 2013 and 2015 and the clear days of 2015. The PM was then classified into four bin sizes: <1 μm, 1–2.5 μm, 2.5–4 μm and 4–10 μm. The trend for the particle size distribution for clear and hazy days is presented in figure 1. As can be seen, smaller particles (<1 μm) dominated during the clear days and hazy days. This has a large impact on general public health, as particles of size PM2.5 are the leading cause of pollution-related mortality (Koplitz et al 2016). The clear days of April–May were generally in the dry part of the year and surrounding urbanization is a probable reason for the sustained increase in sub-micron particles in the atmosphere. There were similarities in this trend for all bin sizes, with a few exceptions. The PM 2.5–4 μm bin increased almost four times in the 2013 haze event compared with the 2015 haze event and three times compared with the clear days in 2015. The PM 1–2.5 bin was found to be 16.1% in the 2013 haze, 31.5% in the 2015 haze and 18.1% in the 2015 clear period.
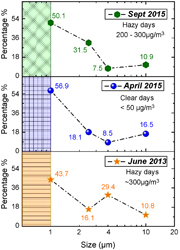
Figure 1. Size distribution of particulate matter collected during the haze events of June 2013 and September 2015 and clear days of April 2015. PM1 is inclusive of the shaded region.
Download figure:
Standard image High-resolution imageThe clear days of 2015 presented a similar particle size distribution to the hazy days of 2015, implying the existence of such a distribution even when there are low concentrations of PM (< 50 μg m−3) in the atmosphere from a variety of sources within Singapore. The concentration of PM was always < 50 μg m−3 during the clear days and ∼300 μg m−3 during both haze events. During the haze events, the differences in the particle size distribution among the three events could arise primarily due to the fact that the hazes that reached Singapore in 2013 and 2015 were from different sources (Ho et al 2014, Gaveau et al 2014, Koplitz et al 2016, Lee et al 2017). While the 2015 haze was due to burning in the Kalimantan region (about 800 km from Singapore), the 2013 haze occurred due to burning in Sumatra (about 200 km from Singapore). Our observations also support the concept that smaller particles tend to travel further in the wind from their source region (Wilson and Suh 1997) (see figure S1 in the online supplementary information available at stacks.iop.org/ERL/12/084018/mmedia) However, the occurrence of larger-sized particles was more related to the agglomeration of smaller particles around the sampling site rather than to the travel of primary particles alone.
The sampling of particles in commercial aerosol monitoring systems is performed under a set of valid assumptions: (1) they assume that the particle is spherical in nature and (2) they assume a value of standard density/packing to calculate the physical parameters such as concentration. This makes the instruments prone to over/underestimation of aerosol in the air sample. However, actual aerosol densities are not uniform, the shape of aerosol particles is far from spherical and their formation is a heterogeneous process, with the surrounding environment being one of the major influencing factors. This implies that the true density of an aerosol would be very different from the assumed value. For observations of soot particles, reports indicate that the effective density of soot particles varied from ∼1.2 g cm−3 for 30 nm soot particles to <0.3 g cm−3 for 300 nm particles (Maricq and Xu 2004), values which are much lower than the density of carbon (∼2 g cm−3) that the existing aerosol measuring instruments have used to estimate aerosol quantities in air. Manufacturers of aerosol measuring instruments should reconsider the currently used calibration standards because accurate information on density and agglomeration factors would help detect and understand aerosols more precisely.
Compaction of PM
For statistical analysis of high-yield sampling, filters were used to capture the PM. The PM for the 2013 haze samples was collected from the air filters positioned in front of gas turbines of power-generating system in Singapore. The air filtration units in front of the gas turbines comprise a two-stage process, with coarse filters (G4 filter class, >10 μm) as the first stage and fine filters (F9 filter class, >1 μm) as the second. One such filter set was used for the analysis of PM. The PM collected from the filters was subjected to compaction, which occurred mostly in the filter. Due to particle compaction in the filter, information regarding the history of formation, transport and evolution of the PM was lost, hence it became difficult to segregate the PM in pristine form and extract its characteristics. Scanning electron microscope (SEM) images of the state of compaction of the PM are presented in figure 2. The samples were found to be heavily coagulated and clumped together. The sample sizes found in the coarse filter (figure 2(a)) were greater than 1 μm. Irregular morphology of the PM was observed in all the samples. Distinct 'bead-shaped' structures (1–5 μm in size) were also identified in samples from the coarse filter (inset to figure 2(a)). Figure 2(b) presents the PM from the fine filters. Under a SEM, the PM from the fine filters did not show any regular morphology. The coagulation of PM in the fine filter was higher and more irregular than that in the coarse filter. The inset of figure 2(b) shows the PM on the fibers of the fine filter. Very high charging was observed for all the PM samples under the SEM, which required a coat of Pt as a conducting layer on the PM samples. (China et al 2013) While the coagulation features of PM from coarse and fine filters differed significantly, the energy dispersive x-ray spectra (EDS) presented a range of elemental compositions which was similar in each case. The EDS resulted in a majority of carbon (∼51%) and other elements (O, Si, Na, Al, Cl, Ca) in both cases.
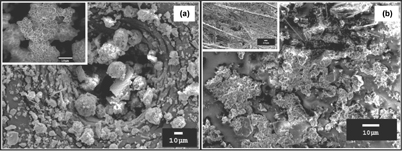
Figure 2. Scanning electron microscope images of (a) particulate matter (PM) collected from the coarse filters (inset: coagulated lump of a sample) and (b) PM collected from the fine filters (inset: PM coagulated on the fibers of the fine filter).
Download figure:
Standard image High-resolution imageClassification and mixing state of PM
The mixing state of PM is known to be a subset of its size–composition–morphology. However, due to extreme sample compaction SEM could not provide information on details of the aerosol state and morphology. Hence, a more detailed analysis was performed using a transmission electron microscope (TEM). The characteristics of PM found in Singapore were similar to those of PM found in other parts of the world. Our samples bear a good correlation with aerosol particles from biomass burning in South Africa (Li 2003, Pósfai 2003), soot aggregates from biomass burning and wildfires in California, India and Mexico (Chakrabarty et al 2014) and tarballs from biomass burning in Mexico (Adachi and Buseck 2011). Various forms of PM, such as soot, tar balls and clusters, were observed in this region as well. Despite the similarities, exceptions were also found to suggest a complex growth model of PM in the region. Based on morphology and elemental composition, the PM was classified into three sets: soot particles (primary particles), organic–inorganic clusters (tar balls and other particles) and hybrid particles. While the organic–inorganic clusters were found in the coarse and fine filters, the soot and hybrid particles were only found in the fine filters. One reason for this might be due to the fact that the size of soot and hybrid particles was much smaller than the pore size of the coarse filters. Figure 3 presents the TEM images of the classified PM from the biomass burnings in 2013. An EDS on the PM samples showed a very diverse elemental composition. The TEM-EDS also reported an elemental composition similar to that from the SEM-EDS. Figure 4 presents an example of the TEM-EDS performed on the collected PM. Almost every particle analysed was found to be carbonaceous. This is evidence that haze events contributed to the addition of carbon to the atmosphere, and over clear days affected the climate in the region (Gaveau et al 2014, Lee et al 2017).
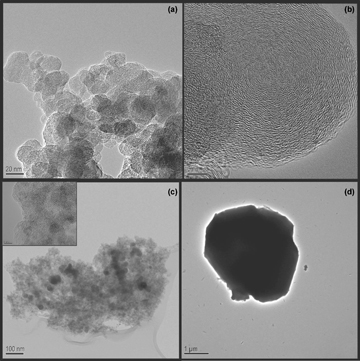
Figure 3. Transmission electron microscope images of the three different categories of the particulate matter found in the Southeast Asian region: (a) soot cluster, (b) individual soot particle with ring-shaped graphitic layers, (c) organic–inorganic cluster with an inset (scale bar 5 nm) of the inorganic islands in an organic matrix, (d) a hybrid particle.
Download figure:
Standard image High-resolution imageThe structure of the soot particles has a typical onion-shell type graphitic layer (figures 3(a) and (b)). These particles were found in disordered clusters and assumed to have been produced during biomass burnings as primary particles with a near spherical geometry (Maricq and Xu 2004). The soot was found to be purely organic in nature as carbon showed up as the only element in the TEM-EDS analysis (figure 4(a)). The compact nature of the soot particles indicated the formation of PM due to aging smoke. Chain-like soot aggregates were presumed to be formed in young smoke. They agglomerated further due to aging and collapsed to form compact particles (Li 2003). The observed soot was a loosely packed conglomerate of many individual soot monomers. The monomers were about 30–40 nm in diameter while the aggregates had a maximum projected length of about 300–500 nm. The aggregates' maximum projected length depended on the 3D packing of the individual monomers.
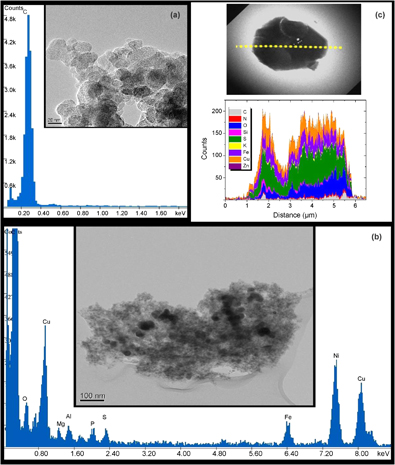
Figure 4. The energy dispersive x-ray spectra (EDS) of the different categories of particulate matter found in the Southeast Asian region: (a) soot, (b) an organic–inorganic cluster and (c) a line scan showing the distribution of elements along the hybrid particle.
Download figure:
Standard image High-resolution imageThe organic–inorganic cluster (figure 3(c)) consisted of islands of inorganic material on a matrix of carbon. This form was closer to the 'organic with inorganic inclusions' as observed in the South African haze PM (Pósfai 2003). In most of our cases the inorganic inclusions were not distinct and separate. The inorganic islands were linked with carbon in a complex manner. Carbon was found as a majority component while traces of a variety of elements such as O, Cu, Mg, Al, P, S, Fe, Na and Cl were also found. With carbon as a majority component, the percentage composition of the other elements varied from sample to sample. A sample from this cluster is depicted in figure 4(b). None of the samples found in these clusters had a distinct geometry. Their shape, size and elemental composition (organic–inorganic inclusion ratio) varied from sample to sample. The average maximum projected length of the organic–inorganic clusters was about 200–600 nm. Found in large numbers, they are understood to be formed due to the condensation of inorganic vapors on the organic phases. (China et al 2013, Pósfai 2003)
Hybrid particles presented in figure 3(d) are solid particles with varying organic and inorganic content in a complex ratio (figure 4(c)). These particles are presumed to be a super-cooled form of giant organic–inorganic clusters, making them larger than other categories. These particles were opaque to the electron beam and could sustain longer exposure times than the soot particles. As they would have been subjected to multiple nucleation–condensation growth–cooling cycles they could be considered more aged than the other particle types. These particles also showed a similar elemental composition to the organic–inorganic cluster. Their elemental composition varied on moving from one end of the particle to the other (figure 4(c)). These particles were found with diameters greater than 1 μm with near-geometrical characteristics.
The coarse filter also contained particles similar to the organic–inorganic cluster. The particles were larger and had a similar elemental composition to the organic–inorganic cluster. Their maximum projected length was about 800–900 nm. Carbon was still a majority element. Tar balls were also found attached (figure 5) to these particles, showing that the PM belonged to an intermediate stage of aging (Li 2003). Tar balls varied significantly from the soot particles as they did not possess any morphology.
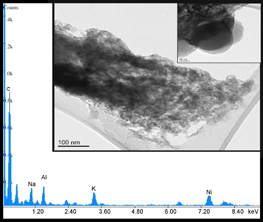
Figure 5. Transmission electron microscope images of particulate matter from the coarse filter and the tar ball sample (inset) with the energy dispersive x-ray spectrum of the sample.
Download figure:
Standard image High-resolution imageWhile it was possible to predict the source of an elemental constituent from the EDS results, understanding the nature of the mixing state is more complex. Unlike PM found in other parts of the world, much of this PM did not arrive in pristine form. This implied that the mixing state of PM is disorderly and dependent on the environmental factors surrounding the source–transport until the point of capture. In most of cases, the point of capture itself acts as an obstacle and becomes the source of a unique mixing state for the PM. In this case the air filtration units ingested copious amounts of air, which would have provided a more complex mixing state for the PM. Hence, the mode of capture also plays a very influential role in determining the nature of PM formed.
Morphology of PM
The aerosols were usually found in irregular agglomerated forms. Their complex geometry enabled us to understand their morphology using fractal-like analogies (Wentzel et al 2003, China et al 2013, Chakrabarty et al 2014). Fractal analysis of the PM brings addresses the morphology in terms of geometric shape and volume. Mathematically, aerosols are not classified as fractals; however, fractal analysis techniques can still be used to understand their morphologically based properties (Wentzel et al 2003, China et al 2013, Wilson and Suh 1997, Chakrabarty et al 2014, Schmidt-Ott 1988). The fractal dimension (Df) is given by the statistical scaling law
where N is the number of monomers per aggregate, Rg is the radius of gyration of the aggregate, dp is the monomer diameter and kg is the fractal prefactor (Wentzel et al 2003, Brasil et al 1999, Adachi et al 2007). For a given Df, kg represents the level of compactness of the aerosol cluster (Wentzel et al 2003, China et al 2013, Brasil et al 1999, Adachi et al 2007). Df and kg together provide a more complete view of aerosol morphology (Wentzel et al 2003). Other properties of aerosols include the total surface area of the aggregate, which is a relevant property in materials with an open structure, and the overlap coefficient (Cov) of the monomers in the aggregate. The overlap coefficient is defined as
where dp is the diameter of the monomer and dij is the distance between the two touching particles. Most of the PM measurements today approximate the PM to a solid sphere with a default Df = 3. Such an approximation is far from reality in most cases. The mixing state of PM has with complicated features, as observed in the organic–inorganic clusters. Such clusters do not possess a near perfect geometry and have variable packing factors (Df and kg). The reduction in Df will imply a reduction in the density of the material. Hence, with a default Df the overall amount of aerosol in the atmosphere is prone to overestimation. Hence fractal analysis helps to address such issues.
In our case, the dp for the soot monomers was found to be 30–40 nm. It should be noted that equations (1) and (2) were derived for soot-like particles only (Wentzel et al 2003, China et al 2013, Brasil et al 1999, Adachi et al 2007). In this scenario, the aerosols are not only different from soot in geometry but also in morphology and composition. Equations (1) and (2) do not hold for cases that include organic–inorganic clusters where monomers are indistinguishable. Rather, the process in which the clusters are formed would determine the method used to analyse them. Hence, a more detailed treatment is necessary in such cases where the distinction between particle monomers and aggregates becomes indistinguishable. This also induces more complexity in equation (1), where a more definitive approach is needed to describe the relationship between N and Rg. All these properties require a statistical approach with many more data sets for any individual variety of aerosol. Such case-specific treatments are beyond the scope of this paper and it would not be possible to explain all the aerosol varieties observed in figure 3. Hence, there is a breakdown of the fractal analysis techniques for cases beyond soot-like agglomerates.
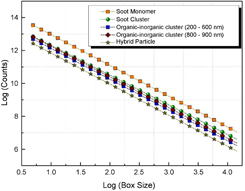
To obtain the fractal dimensions from the TEM images, a box counting method was used. The method uses a binary system of foreground versus background. The method determines the change of the foreground in a fixed pixel frame. Principally, a TEM image is a projection of the 3D sample on a 2D plane. The image is divided into a number of square boxes of know size (scaling factor). The variation of the desired detail of the PM with its box size is noted and a logarithmic regression plot of the box count against the box size is plotted. The slope of the line gives the dimensionality Df of the particle in the image
The variation of slope for the classified PM is given in figure 6. A certain degree of distortion in precision accompanies this method as it does not account for particle overlap, screening effects or cluster anisotropy (Wentzel et al 2003). A summary of the fractal properties is presented in table 1. The Df of all the PM varied from 1.79 to 1.88, suggesting a pseudo-fractal behavior. The fractal analysis resulted with a little understanding of the PM. The analysis pointed out drawbacks in the prevailing techniques for characterizing all the categories of aerosols captured. An understanding of their fractal-like behavior would improve estimation of their physical properties, which have a direct impact on their optical and thermodynamic characteristics.
Table 1. Morphological properties of the various types of particulate matter found in the Southeast Asian haze of 2013.
| Maximum projected length | Composition/type | Morphology | Df | Comments |
|---|---|---|---|---|
| 30–40 nm | Individual soot particles | Spherical shaped structures with ring-like layering of carbon | 1.8 | Monomer |
| 300–500 nm | A cluster of soot particles | A cluster of individual soot particles | 1.79 | Aggregate of monomers |
| 200–600 nm | An cluster of organic (tar balls)–inorganic particles | Tar balls in a matrix of amorphous carbon and inorganic elements. No specific geometry | 1.87 | No monomers; compacted cluster |
| 800–900 nm | A cluster of organic–inorganic particles | A complex matrix of organic (amorphous carbon) and inorganic elements | 1.86 | No monomers; compacted cluster |
| 3–5 μm | A hybrid particle | A solid particle with near-polygonal geometry | 1.88 | Individual compacted particle |
Figure 6. The variation of box size with the box counts for each of the particulate matter classifications found in the Southeast Asian haze of 2013.
Download figure:
Standard image High-resolution image
Conclusion
In summary, the particle size distribution of the Southeast Asian haze was studied for hazy and clear days of 2013 and 2015. Sub-micron PM (PM1 and below) dominated both hazy and clear days during 2013 and 2015. The trend of the bin-wise distribution observed for both clear and hazy days was similar in 2015. The observed domination of PM4 and below compared with PM10 and above is known to have a serious impact on public health, especially on respiratory conditions. The uncertainties of the measurement and analysis techniques were also highlighted. Commercial sampling instruments come with calibration standards that did not take the mixing states into account. Fractal analysis was also performed, emphasizing the drawbacks of such analysis techniques for further understanding the Southeast Asian region haze of 2013.
We analysed the composition and morphology of the PM captured in industrial filters from the Southeast Asian haze of 2013. Carbon was found to be a majority component in all the particles. A correlation between particle morphology, composition and size was observed. Three categories of PM were identified, namely soot, organic–inorganic clusters and hybrid particles. Each of the categories varied in nucleation–growth transport–capture mechanisms, resulting in complex mixing states. The mixing states in these categories were similar to those observed from other geographical regions but also contained unique aspects pertaining to this region. During haze events these parameters deviate from the norm and bring about uncertainties in the climate models. The three mixing states identified help to estimate their radiative forcing parameters for the region with higher degrees of certainty. Hence the composition–morphology–size information provided in this study would be useful for climate modelling of the Southeast Asian region.
Methods
PM sampling
Sampling for haze was performed at Tuas Power generation Pte Ltd. This plant located amidst an industrial hub in the west of Singapore and contributes about 20% of Singapore's total electrical power supply. The particle size distribution was collected by placing the aerosol monitor (TSI 8533) in an environmental enclosure (figure S2 in the online supplementary information). This enclosure was placed in front of the air filtration units for the gas turbines. The aerosol monitor enabled real-time sampling of the air quality every second for a period of one week for each event. For the 2013 haze event data were recorded from 18 to 24 June; for the clear days of 2015 data were recorded from 15 to 22 April; and for the 2015 haze event data were recorded from 14 to 21 September. The tropical climate of Singapore presented with the typical temperature and humidity conditions during the clear days. The hazy days also presented with typical temperatures for the time of year together with low visibility.
Microscopy
The air filters in front of the gas turbines were used to collect the samples of PM. The functioning of the filters coincided with the haze event of June 2013. One filter set consisting of a coarse (G4 class, > 10 μm) and fine (F9 class, > 1 μm) filter was used for the analysis of PM. A JEOL JSM 7600 F instrument was used to perform electron microscopy in scanning mode. The PM from the coarse filters was collected by gently tapping a small portion of the coarse filter on the copper tape of the SEM holder. A thin film of PM was deposited on the copper tape, which was used for subsequent analysis. For the TEM analysis, a JEOL 2100 F microscope was used in a high-resolution mode. A small piece of the fine filter was sonicated in ethyl alcohol.
Fractal analysis
The fractal analysis was performed using the box counting method in ImageJ Software. This software uses a box counting method to estimate Df. The tool systematically lays a series of grids of decreasing size (the boxes) over an image and records the data (count) for each successive box size. More information on the software can be found at https://imagej.nih.gov/ij/docs/guide/146-3.html.
Acknowledgments
This research work was financially supported by Energy Market Authority EIRP project no. NRF2013EWT-EIRP001-034. The authors gratefully acknowledge the help of Tuas Power Generation Pte Ltd and Professor Victor Wei-Chung Chang for support and cooperation.