

Abstract
Climate mitigation requires emissions to peak then decline within two decades, but many mitigation models include 100 EJ or more of bioenergy, ignoring emissions from biomass oxidation. Treatment of bioenergy as 'low carbon' or carbon neutral often assumes fuels are agricultural or forestry residues that will decompose and emit CO2 if not burned for energy. However, for 'low carbon' assumptions about residues to be reasonable, two conditions must be met: biomass must genuinely be material left over from some other process; and cumulative net emissions, the additional CO2 emitted by burning biomass compared to its alternative fate, must be low or negligible in a timeframe meaningful for climate mitigation. This study assesses biomass use and net emissions from the US bioenergy and wood pellet manufacturing sectors. It defines the ratio of cumulative net emissions to combustion, manufacturing and transport emissions as the net emissions impact (NEI), and evaluates the NEI at year 10 and beyond for a variety of scenarios. The analysis indicates the US industrial bioenergy sector mostly burns black liquor and has an NEI of 20% at year 10, while the NEI for plants burning forest residues ranges from 41%–95%. Wood pellets have a NEI of 55%–79% at year 10, with net CO2 emissions of 14–20 tonnes for every tonne of pellets; by year 40, the NEI is 26%–54%. Net emissions may be ten times higher at year 40 if whole trees are harvested for feedstock. Projected global pellet use would generate around 1% of world bioenergy with cumulative net emissions of 2 Gt of CO2 by 2050. Using the NEI to weight biogenic CO2 for inclusion in carbon trading programs and to qualify bioenergy for renewable energy subsidies would reduce emissions more effectively than the current assumption of carbon neutrality.

Original content from this work may be used under the terms of the Creative Commons Attribution 3.0 licence.
Any further distribution of this work must maintain attribution to the author(s) and the title of the work, journal citation and DOI.
Introduction
Meeting the Paris Agreement goal of limiting global temperature increase will require fast deployment of zero-emissions energy and greatly increased carbon sequestration. In developing pathways to limit atmospheric CO2, many climate mitigation models include a doubling or more of bioenergy to at least 100 EJ in the coming decades [1–3], with much of the fuel assumed to come from forestry and agricultural residues [3]. Though oxidizing 100 EJ of biomass would emit about 9 Gt of CO2 each year, most mitigation models assign bioenergy zero net emissions.
The assumption of bioenergy carbon neutrality underpins many renewable energy investments, including in the EU, UK and Asia where dried wood pellets are imported as a replacement for coal. Such policies, and the lucrative subsidies they provide, have driven rapid growth in the wood pellet sector in North America, with US exports growing from less than 0.1 Mt in 2008 [4] to 4.9 Mt in 2016 [5]. Canadian pellet exports increased 46% from 2015–2016 [6], and US pellet exports are projected to double or triple from 2016 levels by 2025 [5, 7].
Biomass power plants tend to emit more CO2 than fossil fueled plants per MWh, and as shown by a number of studies, net emissions from bioenergy can exceed emissions from fossil fuels for decades [8–12]. Nevertheless, some studies conclude rapid carbon benefits from burning wood pellets by employing various assumptions: that forest planting will increase in response to demand for wood [13]; that replanting occurs immediately after harvest [14]; or that forest growth elsewhere compensates for emissions from harvesting and combusting trees [15, 16] (for a review, see Ter-Mikaelian et al 2015 [17]). Some discussions of bioenergy in mitigation modeling include similar assumptions that burning 'sustainable,' 'optimal' [1, 3] or 'surplus' [18] forest wood can reduce net CO2 emissions as long as forest carbon stocks are increasing. Such assumptions often disregard the role of the forest carbon sink, thus the controversy around bioenergy carbon accounting continues.
However, on one aspect of bioenergy carbon accounting there is wide agreement: that when biomass is sourced from residues from forestry, wood products manufacturing, or agriculture, net carbon emissions are properly assessed as the difference between emissions from their use as fuel (which can include emissions from fuel manufacturing and transport), and emissions from an alternative fate, such as leaving material on-site to decompose or burning it without energy recovery [8–10, 12 19–23].
Studies using this approach generally conclude net bioenergy emissions are not zero over varying periods of time. Nonetheless, many policies still treat bioenergy as having zero or negligible emissions. European Commission guidance for the EU carbon trading program explains bioenergy emissions should be 'taken to be zero,' and that wood pellets consist of 'processing residues from forest based industries' [24]. The IPCC acknowledges harvesting trees for fuel can increase cumulative emissions for years to centuries, but concludes that 'agricultural and forestry residues can provide low-carbon and low-cost feedstock for bioenergy' [3]. The IPCC renewable energy report identifies potential for 100 EJ of bioenergy specifically from residues [18] and does not discuss potential emissions.
For the assumption that residues have negligible net emissions to be reasonable, at least two conditions must be met. First, biomass classified as residues must actually be residues—that is, materials generated by some other process, where the alternative fate is decomposition or burning without energy recovery. Second, net emissions from bioenergy, that is, the cumulative additional CO2 emitted from processing and burning biomass versus from an alternative fate, must be low, if not negligible, within a timeframe meaningful for climate mitigation.
What should 'low net emissions in a meaningful timeframe' mean? Most scenarios for climate change mitigation that constrain temperature rise consistent with Paris Agreement goals require emissions to peak between 2020 and 2030 and decline to less than half 2010 levels by 2050 [25], with negative emissions shortly thereafter. Actions that reduce or end emissions in the next ten years are thus essential, given that elevated CO2 is already driving essentially irreversible polar ice loss, permafrost melting, and ocean acidification, along with thermal sea-level rise, which has been shown to respond to temperature changes from short-lived climate pollutants in a ten-year timeframe [26].
Here, 'low net emissions' from bioenergy implies a comparison to gross or 'direct' emissions from manufacturing and burning biomass. This study uses a simple model to calculate a new metric, the 'net emissions impact' (NEI), which is the ratio of cumulative net emissions to direct emissions from burning residues for energy. The NEI expresses the proportion of direct CO2 emissions that contributes an additional warming effect over a fifty-year period. Fuel and feedstock use, net emissions and the NEI are calculated for three main case studies: the existing US bioenergy sector, new wood-burning plants using chipped wood, and wood pellets that are exported to the EU to be burned as a replacement for coal.
Approach
Built in Excel, the model calculates cumulative net emissions as cumulative direct emissions (CO2 from combustion for energy plus CO2 from harvesting, producing, and transporting biomass, or 'HPT emissions'), minus cumulative counterfactual emissions (what emissions would be if the biomass were left in the field to decompose or were burned without energy recovery). The net emissions impact (NEI) is the ratio of cumulative net emissions to cumulative direct emissions.
HPT emissions are calculated as explained below. Direct combustion emissions are calculated as joules of heat input for each fuel multiplied by fuel-specific CO2 emission factors [27] (non-CO2 greenhouse gas emissions are not included in this version of the model). The spreadsheet sums cumulative counterfactual emissions from biomass collected in each year in columns, then sums across columns to calculate cumulative emissions by each year from all biomass collections up to and including that year.
Table 1. Model inputs for biomass burned for energy in the US. Heat input is average summed value per year for the industrial and non-industrial sectors, 2001–2016. See text for details.
| Fuel | GJ yr−1 | CO2 EF | HPT factor | Alternative fate | k |
|---|---|---|---|---|---|
| Agricultural biomass | 31.7 | 0.101 | 7.5% | Decomposition | 0.65 |
| This constitutes a small percentage of biomass burned in the US, but can represent a large variety of materials, including crop stover, nut hulls, and sugarcane bagasse. The k-constant produces a half-life for residues of one year. | |||||
| Black liquor | 800.5 | 0.087 | — | Burn w/o ER | — |
| This is a high moisture content material left residue of pulp- and paper-making. The model assumes no net emissions from burning it for energy. | |||||
| Other biomass solids | 18.3 | 0.101 | 4% | Burn w/o ER | — |
| EIA does not specify what these materials are. While there are likely processing costs, the model assumes a minimal 4% HPT emissions to be conservative. | |||||
| Sludge waste | 6.3 | 0.072 | — | Burn w/o ER | — |
| Sludge waste is another residue of pulp- and paper-making. | |||||
| Wood liquor | 11.3 | 0.072 | — | Burn w/o ER | — |
| This material is related to black liquor. | |||||
| Wood solids | 548.8 | 0.081 | 4% | Decomposition | 0.083 |
| This includes forestry wood, mill residues, urban tree trimmings, and construction and demolition wood. For consistency with wood pellet scenarios below, the k-constant is 0.083. | |||||
Counterfactual carbon emissions (with conversion to CO2 at the last step) are calculated as:

where
PE'(t) = proportion of carbon from biomass collected in a given year that has been emitted by year t
k' = rate-constant for decomposition of biomass collected in a given year
cE'(t) = carbon from biomass collected in a given year that has been emitted by year t
BC' = carbon content of biomass collected in a given year
CE(t) = carbon emitted by year t from biomass collected in all years
To evaluate emissions from the US bioenergy industry, the model uses bioenergy data from the Energy Information Administration (EIA) for 2001–2016 [28] and CO2 combustion emission factors used by the US Environmental Protection Agency (EPA) for power sector modeling (original units short tons mmbtu−1; converted here to metric tonnes GJ−1) [27]. Alternative fate emissions are calculated using k-constants particular to each fuel (table 1).
The model includes HPT emissions for forestry residues and other wood as equivalent to 4% of the carbon content of green chips, based on Domke et al (2012) and reviews of other studies [9, 29]. The model assumes the alternative fate for agricultural residues is decomposition, as crop burning occurs on less than 1% of agricultural acres in the US [30]. Selecting an HPT factor for agricultural residues is not straightforward, as emissions from harvest, transport, shredding, baling, and sometimes pelletizing can be significant. Depending on how system boundaries are drawn, emissions from crop cultivation, including N2O from fertilizers, can be ascribed to residues [31]. Storage also imposes lifecycle emissions because agricultural materials can only be collected at fixed intervals. Most importantly, removing agricultural residues can deplete soil carbon [32]; some estimates of total HPT emissions including soil C loss sum to more than 100% of fuel carbon content [31]. This model used an HPT factor of 7.5% for agricultural residues based solely on harvest and transport estimates for corn stover in Whitman et al (2011) and did not include soil carbon impacts because this factor was not included for forestry residues. As agricultural residues provided a small percentage of total fuels, the choice of HPT factor had only a trace effect, but any study of large-scale use of agricultural residues should include soil carbon effects.
Data on wood use by the US pellet manufacturing sector was obtained from the forest-industry tracking company Forisk [33]. Five pellet scenarios were modeled to examine how the k-constant and changing use through time affect net emissions (details in table 2). Scenarios 1–4 estimated HPT emissions (which include harvesting, transport to plant, debarking, chipping, pulverization, pellet extrusion, drying, and oversea transport) as 322 kg CO2 per tonne of pellets, following Jonker et al [15], similar to an estimate by Dwivedi et al [14]. Also following Jonker et al the model assumed that pellet drying consumes 0.51 green tonnes of residues per tonne of pellets, an estimate confirmed by checking the dryer fuel to pellet production ratio in permits for two industrial-scale plants in the US [34, 35]. The model assumed residues burned to dry pellets would decompose with a k-constant of 0.15 if not burned for energy. Facilities that use fossil fuels to dry pellets have much higher HPT emissions [36], but this effect was not included.
Table 2. Five scenarios for wood pellet manufacturing and use.
| 10 years (2020) | 25 years (2035) | 40 years (2050) | |||||||
|---|---|---|---|---|---|---|---|---|---|
| Scenario | Direct CO2 (t) | Net CO2 (t) | NEI | Direct CO2 (t) | Net CO2 (t) | NEI | Direct CO2 (t) | Net CO2 (t) | NEI |
| 1: 1 tonne pellets yr−1, k = 0.15 | 25 | 14 | 55% | 62 | 21 | 34% | 99 | 26 | 26% |
| 2: 1 tonne pellets yr−1, k = 0.03 | 25 | 20 | 79% | 62 | 40 | 64% | 99 | 54 | 54% |
| Direct CO2 (Gt) | Net CO2 (Gt) | NEI | Direct CO2 (Gt) | Net CO2 (Gt) | NEI | Direct CO2 (Gt) | Net CO2 (Gt) | NEI | |
| 3: Actual US exports to year 7 (2017); modeled 15% yr−1 increase to 12.8 Mt yr−1 at year 15 (2025); continue at that level; k = 0.083 | 0.09 | 0.07 | 73% | 0.53 | 0.28 | 53% | 1.01 | 0.40 | 39% |
| 4: Like Scenario 4, but cease use at year 20 (2030); k = 0.083 | 0.09 | 0.07 | 73% | 0.37 | 0.16 | 43% | 0.37 | 0.08 | 21% |
| 5: Actual global demand of 13 Mt tonne pellets yr−1, increasing to 28.2 Mt at yr 6 (2016); modeled increase to 66.4 Mt yr−1 at year 15 (2025); continue at that level; k = 0.083 | 0.63 | 0.44 | 71% | 2.92 | 1.48 | 51% | 5.35 | 1.99 | 32% |
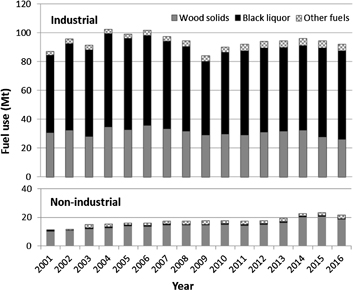
Figure 1. Fuels burned by the US industrial and non-industrial bioenergy sectors, 2001–2016 [28]. Wood burning for electricity generation in the non-industrial sector increased by about 60% from the beginning of the period.
Download figure:
Standard image High-resolution image
Figure 2. Trucks lined up waiting to deliver pellet feedstock to North Carolina plant owned by Enviva, the largest US pellet manufacturer. Much of the wood is tree trunks, not tops and limbs (Photo: Dogwood Alliance).
Download figure:
Standard image High-resolution imageResults and discussion
Sources of biomass burned for heat and power in the US
The US bioenergy sector can be divided into industrial plants, which mostly burn black liquor and wood to generate onsite heat and power for paper and wood products manufacturing, and non-industrial plants, which mostly burn wood to generate power for the electrical grid (figure 1). The industrial sector mostly utilizes biomass for heat; on average, just 21% of fuel energy was used for electricity generation from 2001–2016, while the smaller non-industrial sector allocated 87% of fuel energy to electricity generation [28].
Combined, industrial and non-industrial facilities burning biomass generated less than 1% of total electricity in the US in 2016 [37]. However, average annual generation over a three-year period in the non-industrial sector increased 62% from 2001–2003 to 2014–2016, while electricity generation stayed relatively constant in the industrial sector.
The dominance of black liquor as fuel for industrial bioenergy means that many facilities at least partially meet the first of the low carbon conditions—that fuels genuinely be residues of some other process. However, the provenance is less clear for wood burned by the industrial and non-industrial sectors, which totaled 45 Mt (green) in 2016 [28]. Forisk estimates wood use by US biomass facilities at 35 Mt (green), a figure that omits certain large industrial users reported by the EIA, and reported as of late 2016 that operating and under-construction plants were burning pulpwood (7.4%); 'dirty chips/forest residues' (49.6%); urban wood (19.4%); and mill residues (23%) [33].
Residues appear to provide the most fuel for US bioenergy sector, but since there is no set definition for 'residues,' it is not possible to know if this wood is truly the product of some other process. Conservative definitions for forest residues are found in Domke et al: the 'tip, portion of the stem above the merchantable bole, and all branches, and excluding foliage' [20], and Laganière et al: 'all woody debris generated in harvest operations for traditional wood products (e.g. branches, tree tops, bark), excluding stumps and downed nonmerchantable trees' [12]. However, practices on the ground vary. For example, Dominion Energy Resources in Virginia, which re-fired three coal plants with wood and has a total bioenergy capacity of over 250 MW, wrote to the EPA that waste wood 'to us' means 'forest materials including residues (tree tops, non-merchantable sections of stem, branches, and bark), small trees and other low value materials' [38]. Some facilities clearly burn whole trees for fuel, like a new 70 MW plant in Berlin, New Hampshire that burns 113 tonnes of 'clean wood chips' per hour, including 'whole tree chips' [39] (Forisk lists this plant as burning 408 000 green tonnes of hardwood pulpwood and 408 000 green tonnes of residues per year [33]). The evidence for use of whole trees as fuel suggests that many facilities do not burn materials that meet conservative definitions of residues (i.e. branches, tree-tops, and bark left over from other harvesting).
Sources of wood utilized by the US pellet manufacturing industry
As of late 2016, annual production capacity at operating and under-construction wood pellet manufacturing facilities in the US was 13.2 Mt, requiring about 28.6 Mt of green wood as feedstock [33], though not all plants produced at capacity. Pellet companies emphasize use of residues, downplaying the use of roundwood as feedstock [40]. However, exported wood pellets must meet specifications including restrictions on bark content [41], thus there is a limit on the amount of low-diameter branches and tops that can be used. Accordingly, industry data indicate about 56% of pellet feedstock is supplied from pulpwood (41% from softwood, 14% from hardwood); 42% from mill residues, 1% from urban wood; and just 1% from logging residues [33]. Investigations of pellet feedstock at some large US mills have confirmed that a significant portion of feedstock is bolewood (figure 2). The feedstock supply from small pellet producers in the Northeastern US also appears to avoid residues; a study of nine pellet mills in Maine found only 2% came from tops and limbs, with the remainder classified as pulpwood or small diameter trees [42].
Similarly, company-supplied data on sources of wood pellets burned in the UK indicate that the majority of US pellets burned by the coal- and wood-fired Drax power station in 2015 was sourced from logs that 'formed part of the trunk of a tree which grew for at least ten years' from harvesting that was a 'mix of clearfell and thinning' [43]. While mill residues currently constitute a proportion of pellet feedstock in the US, they will not supply a meaningful amount for future capacity, because supplies are limited [44]. The dominance of pulpwood and the documented use of bolewood thus indicate that pellets often fail to meet the first condition for low carbon residues, that feedstocks genuinely be residues that if not collected would otherwise decompose or be burned without energy recovery.

Figure 3. Cumulative net emissions and the NEI for the industrial (a) and non-industrial (b) bioenergy sectors over a 50 year timeframe, estimated using the average fuel mix for 2001–2016. High use of black liquor as fuel reduces the NEI for the industrial sector, while greater reliance on wood increases it for the non-industrial sector.
Download figure:
Standard image High-resolution imageEmissions from the US biomass industry
Emissions modeling examined the industrial and non-industrial bioenergy sectors separately. The model estimated cumulative direct CO2 emissions from industrial facilities at 1135 Mt at year 10. However, because black liquor and other wastes provide a large proportion of industrial sector biomass, and the assumed alternate fate for these materials is combustion without energy recovery, cumulative net emissions are 224 Mt, for an NEI of 20% (figure 3(a)). Cumulative direct emissions for the smaller non-industrial sector are 208 Mt at year 10, but because the majority of fuel for this sector is wood and the weighted k-constant is lower, cumulative net emissions are 120 Mt and the NEI is 58% at year 10 (figure 3(b)). Both sectors show cumulative net emissions still increasing in the 40–50 year period, though less steeply than in the initial decades.
This analysis calculates emissions at the sector level as if all units initiated operation at the same time, while ideally, sector-level accounting would consider how long each facility has been operating. While inadequate data render this impractical, in general, the industrial sector has shrunk since the 1980s [45] and the present day NEI should be shifted toward the right (lower), as facilities are on average older. In contrast, new construction of wood burning power plants and coal-to-wood conversions in the non-industrial sector since the early 2000s (figure 1) [28] means the average age of the sector is younger, shifting the NEI to the left (higher).

Figure 4. The NEI as a function of the k-constant at different points in time, assuming a 4% HPT adjustment. The NEI at year 10 is always greater than 40%, even when decomposition is assumed to be rapid.
Download figure:
Standard image High-resolution image
Figure 5. Cumulative net emissions for wood pellet scenarios 1–4 (details provided in table 2).
Download figure:
Standard image High-resolution image
Refined emissions estimates for new wood-burning power plants
The industry-level analysis assumed an average k-constant for wood of 0.083, but plotting the NEI against the full range of k-constants (figure 4) demonstrates that the NEI for facilities burning forest residues exceeds 70% at year 10 for all decomposition constants lower than 0.07, and exceeds 40% at year 10 for the full range of decomposition constants for North American forests [46]. This conclusion is likely valid even if the alternative fate for wood is not being left in the forest to decompose, but disposal in a landfill. Conversion of carbon in landfilled wood to landfill gas (carbon dioxide and methane) is generally less than 3% after landfilling [47], thus even taking methane's global warming potential into account, the NEI from burning wood that would otherwise be landfilled is greater than 40% at year 10.
On a practical level, estimating stack emissions from a biomass power plant is easy, but estimating net emissions can be difficult, because the k-constant for wood can vary [48, 49]. One solution is to 'bracket' likely net emissions using a range of decomposition constants to estimate the NEI. Since burning a tonne of green wood emits about one tonne of CO2, yearly direct emissions assuming a 4% HPT adjustment are about 1.04 tonnes per tonne of fuel, and cumulative direct emissions at year 10 are 10.4 tonnes. Taking a biomass facility located in the US southeast as an example, average decomposition constants for southeastern hardwoods (0.082) and softwoods (0.057) [46] translate to values of 67% and 75% on the ten year NEI curve; multiplying these NEI values by direct emissions gives cumulative net emissions of 6.97–7.80 tonnes of CO2 at year 10 for each tonne of wood burned at such a facility. This approach to bracketing emissions could have policy applications. For instance, using the NEI to estimate net biogenic emissions could help integrate biomass power plants into carbon trading and carbon tax programs, as well as qualify bioenergy for renewable energy subsidies.
Emissions from wood pellets manufactured from residues
Emissions estimates for pellets calculated by the model certainly underestimate actual CO2 impacts because tree boles constitute a large proportion of pellet feedstock, and it is unlikely that the true alternative fate for these materials is to be left onsite to decompose. However, calculating emissions as if claims about use of residues [40] were fully accurate can establish one type of 'best case' scenario for pellet emissions. Modeled scenarios 1 and 2 estimate emissions from producing and burning one tonne of pellets per year from roundwood that is assumed to otherwise decompose onsite (figure 5 and table 2), illustrating the importance of the k-constant for net emissions. Even assuming very rapid decomposition (k = 0.15) as the counterfactual, the NEI for Scenario 1 is 55% at year 10. Scenario 2 employs a low k-constant (0.03) representing slower decomposition in a cool climate [11] such as Canada, and has an NEI of 79% at year 10; by year 25, cumulative net emissions are 40 tonnes CO2 per tonne of pellet capacity, nearly double those of Scenario 1. Thus for both scenarios, simply counting cumulative direct emissions at year 10 would provide a closer representation of the emissions impact than characterizing pellets as 'carbon neutral,' as is current practice.
Scenarios 3 and 4 estimate net emissions from actual US pellet exports 2010–2016 [4, 5, 50, 51] followed by an increase to 12.8 Mt in 2024, commensurate with US exports meeting half of predicted short-term global demand for utility and industrial-use wood pellets by 2025 [5, 7]. These scenarios use a k-constant of 0.083, following a UK government-commissioned study on lifecycle impacts of wood pellets [11] that used values from a study of forest wood decay in North Carolina [52]. Accelerating use in the first part of scenario 3 elevates the NEI because decomposition emissions do not come into equilibrium with combustion emissions while pellet use keeps increasing. The NEI is 73% at year 10, 39% at year 40 and 34% at year 50. Scenario 4, where pellet use is terminated at year 20 (2030), has an NEI of 43% at year 25, because cumulative decomposition emissions of the counterfactual still have not caught up to combustion emissions from the early years of the scenario. This scenario shows a carbon benefit in terms of reduced emissions over time, but it requires actually stopping use of the fuel for this to occur.
Scenario 5 (shown in table 2 but not figure 5) uses actual data on global pellet use for 2010–2016, then projects growth to 66.4 Mt in 2025 [53], after which the model assumes demand is flat. It assumes not all pellets are manufactured in North America, thus HPT emissions are reduced by 15% to reflect shorter transport distances. With a pellet energy content of 17.5 MJ kg−1 [54], peak use of 66.4 Mt yr−1 represents 1.16 EJ annually, or just over 1% of the 100 EJ of new bioenergy projected to play a role in some mitigation models [1–3]. By year 40 (2050), cumulative net emissions are 1.99 Gt and are growing at 30 Mt per year.
The pellet scenarios demonstrate that fossil HPT emissions increase continuously with pellet use and represent a substantial 'non-vanishing' [25] fraction of net emissions. In reality, the model probably undercounts HPT emissions because it does not include releases of nitrous oxide emissions from fertilizer used on tree plantations [55] or methane emissions from wood chip piles [56] and finished pellets [36, 57]. Buildup of methane and other hazardous gases during transport and storage [58] is of concern to the wood pellet industry [59], and has the potential to add significantly to lifecycle greenhouse gas emissions [36]. The model also omits combustion emissions of black carbon, a significant climate forcer [60].
Most importantly, calculating net emissions from wood pellets as if feedstocks are derived from forest residues underestimates emissions because a large proportion of pellets are made from trees, not residues [41 61]. For instance, Stephenson and McCay (2014) [11] found net emissions were 10–12 times higher at year 40 when native hardwood trees are harvested for fuel, a practice that has been well documented in the US south [33, 41, 62, 63].
Conclusions
For bioenergy to offer genuine climate mitigation, it is essential to move beyond the assumption of instantaneous carbon neutrality. The NEI approach provides a simple means to estimate net bioenergy emissions over time, albeit one that tends to underestimate actual impacts. The model finds that for plants burning locally sourced wood residues, from 41% (extremely rapid decomposition) to 95% (very slow decomposition) of cumulative direct emissions should be counted as contributing to atmospheric carbon loading by year 10. Even by year 50 and beyond, the model shows that net emissions are a significant proportion of direct emissions for many fuels. Similarly, the model concludes that for wood pellets manufactured from residues in in the US and shipped overseas, even a rapid decomposition counterfactual produces an NEI of 55% at year 10, while a slow decomposition counterfactual produces an NEI of 79%. By year 40, net emissions still represent 25% to more than 50% of direct emissions. Scenarios that increase the amount of biomass burned each year, as is currently occurring in the EU, have even larger net emissions impacts.
Models like this have their critics. The IPCC warns that using a 'simple sum of the net CO2 fluxes over time' to highlight the 'skewed time distribution between sources and sinks,' is probably insufficient to understand the climate implications of bioenergy, which instead requires models that include temperature effects and climate consequences [3]. Bioenergy advocates have seized on models that emphasize the importance of cumulative emissions for warming, pointing out that bioenergy can reduce carbon impacts over time compared to fossil fuels [23], though they say little about carbon impacts when bioenergy displaces zero-emissions technologies.
However, since the IPCC's call for more complex bioenergy modeling was published in 2014, the intensity of the climate crisis has deepened; in the US, legislation has been enacted that compels the EPA to treat bioenergy as carbon neutral [64]; and combustion of forest wood by the EU, UK and Asia is increasing each year, unmitigated by the carbon capture and storage that some climate models say is required [65]. Also while the climate modeling community ponders, governments are making practical decisions about renewable energy funding, as in the UK, where the government provided £809 m (about $1.2 b) [66 67] in subsidies to biomass electricity in 2015, the same year it announced it was terminating subsidies for offshore wind earlier than planned [68]. Since residues would eventually release carbon to the atmosphere whether through burning or decomposition, any putative reduction in CO2 emissions actually depends on residues-fueled bioenergy displacing fossil fuels, but in the UK, it appears bioenergy may instead be displacing zero emissions technologies, while prolonging the life of coal plants that partially switch to subsidized wood burning.
There is no time like the present to reduce emissions. Given the anticipated role for bioenergy in climate mitigation, climate-related policies should be reformed immediately to account for bioenergy impacts. Using the NEI to weight biogenic CO2 for inclusion in US and EU carbon trading programs and to qualify bioenergy for renewable energy subsidies would reduce emissions more effectively than continuing with the current assumption of zero emissions, though for wood pellets sourced from bolewood, counting direct emissions is a more protective and accurate approach.
Acknowledgments
This work was supported by funding from the Packard Foundation and the Tortuga Foundation.