


Abstract
Large-scale changes in Arctic sea ice thickness, volume and multiyear sea ice (MYI) coverage with available measurements from submarine sonars, satellite altimeters (ICESat and CryoSat-2), and satellite scatterometers are summarized. The submarine record spans the period between 1958 and 2000, the satellite altimeter records between 2003 and 2018, and the scatterometer records between 1999 and 2017. Regional changes in ice thickness (since 1958) and within the data release area of the Arctic Ocean, previously reported by Kwok and Rothrock (2009 Geophys. Res. Lett. 36 L15501), have been updated to include the 8 years of CryoSat-2 (CS-2) retrievals. Between the pre-1990 submarine period (1958–1976) and the CS-2 period (2011–2018) the average thickness near the end of the melt season, in six regions, decreased by 2.0 m or some 66% over six decades. Within the data release area (∼38% of the Arctic Ocean) of submarine ice draft, the thinning of ∼1.75 m in winter since 1980 (maximum thickness of 3.64 m in the regression analysis) has not changed significantly; the mean thickness over the CS-2 period is ∼2 m. The 15 year satellite record depicts losses in sea ice volume at 2870 km3/decade and 5130 km3/decade in winter (February–March) and fall (October–November), respectively: more moderate trends compared to the sharp decreases over the ICESat period, where the losses were weighted by record-setting melt in 2007. Over the scatterometer record (1999–2017), the Arctic has lost more than 2 × 10⁶ km2 of MYI—a decrease of more than 50%; MYI now covers less than one-third of the Arctic Ocean. Independent MYI coverage and volume records co-vary in time, the MYI area anomalies explain ∼85% of the variance in the anomalies in Arctic sea ice volume. If losses of MYI continue, Arctic thickness/volume will be controlled by seasonal ice, suggesting that the thickness/volume trends will be more moderate (as seen here) but more sensitive to climate forcing.
Export citation and abstract BibTeX RIS

Original content from this work may be used under the terms of the Creative Commons Attribution 3.0 licence. Any further distribution of this work must maintain attribution to the author(s) and the title of the work, journal citation and DOI.
1. Introduction
On long time scales, the thickness distribution is an expression of the time-integral of interactions between the thermodynamic and dynamic responses of the ice cover to atmospheric and oceanic forcings (Thorndike et al 1975). Thermodynamic processes are responsible for mass changes at the upper and lower surfaces of the ice, and mechanical processes resulting from the non-uniform motion of the ice, cause the formation of the leads and pressure ridges. Thus, there is significant geophysical interest in the thickness distribution of sea ice for documenting changes/trends, understanding processes, and for use in predictions and projections of the behavior of the ice cover at various time scales. Submarine cruises since 1958 have provided sea ice drafts for assessment of ice thickness changes in various regions of the Arctic Ocean. Two such studies (Rothrock et al 1999), using data that span a 42 year period (1958–1997) have provided evidence of significant thinning over large portions of the Arctic Ocean. In contrast to the concerted SCICEX efforts of prior to 2000, however, fewer submarine cruises have provided ice draft data suitable for monitoring changes since the turn of the century.
The availability of basin-scale satellite thickness retrievals from ICESat and CryoSat-2 (CS-2), since 2003, provided another source of thickness estimates for assessment of change. These data sets, even though more spatially extensive, by themselves represent rather short records for examination of decadal changes. For a longer term assessment, Kwok and Rothrock (2009) examined the five years of ICESat thickness estimates (2003–2008) within the context of thickness estimates from 42 years of submarine records (1958–2000) described in Rothrock et al (1999) and Rothrock et al (2008). More recently, Lindsay and Schweiger (2015) combined upward-looking sonars mounted on submarines or moorings, electromagnetic sensors on helicopters and aircraft, and lidar data from ICESat and Operation IceBridge (an airborne campaign) in a regression model of decadal thickness changes; they assume a single invariant bias between individual data sets to explain their relative differences. However, the difficulty in combining these data sets, in a regression analysis, where relative differences (errors) tend to vary in time and space in inhomogeneous data set remains (Kwok and Cunningham 2015).
To date, retrievals from CS-2 have provided another 8 year record (2011–2018) of ice thickness estimates. Here, we follow the methodology in Kwok and Rothrock (2009) in updating the results from their study, which covered the period from 1958 to 2007, to include the 8 years (2011–2018) of CS-2 thickness estimates. We add to these submarine and satellite analyses of thickness and assessments of trends in ice volume in the ICESat and CryoSat-2 (CS-2) records, and trends of multiyear ice (MYI) coverage from scatterometers data. The coverage of MYI has seen significant decreases especially during the ICESat period, where Kwok et al (2009) reported a 42% decrease in MYI coverage between 2005 and 2007, and that the overall decline in volume and thickness in the ICESat record are explained almost entirely by changes in the MYI coverage.
In this paper, the last 60 years (1958–2018) of large-scale changes in Arctic sea ice thickness, volume, and MYI coverage are assessed with submarine sonars, satellite retrievals of thickness and MYI coverage. Section 2 describes the data sets used. Section 3 discusses changes in thickness regionally and in the data release area of the Arctic basin, and the changes in Arctic sea ice volume and multiyear sea ice coverage during the satellite period. Section 4 summarizes this paper.
2. Data description
2.1. Ice thickness from US Navy submarines
The length of the ice draft record (Rothrock et al 1999, Rothrock et al 2008), including gaps in coverage, spans ∼42 years from 1958 to 2000. Few ice draft data are available from submarine cruises after 2000. Declassified ice draft data are from within a data release area (DRA), an irregular polygon enclosing an area of 2.7 × 10⁶ km2 or about 38% of the Arctic Ocean, that lies outside the 'exclusive economic zones' of foreign countries (figure 1(a)). Submarine ice draft estimates used here are converted to thicknesses by first subtracting a bias (0.29 m), and then multiplying by the average thickness to draft ratio of 1.075 (Rothrock et al 2008). The draft estimates are biased with respect to actual draft, due to the first return nature of sonar measurements; the expected observational error in the submarine draft data is ∼0.25 m (Wensnahan and Rothrock 2005).

Figure 1. Regional sea ice thickness estimates from submarine (1958–1976 and 1993–1997), ICESat (2003–2007), and CryoSat-2 (2011–2017) records. (a) Submarine cruise tracks and the six regions. Early submarine cruise tracks (1958–1976) are shown as dotted red lines, and those in the 1990s as solid blue lines. SCICEX submarine data are from the data release area defined by the polygon (solid black lines). (b) Bar chart shows the changes in mean thicknesses of the six regions over the four periods. Thicknesses have been seasonally adjusted to September 15. Uncertainty in individual submarine ice drafts is ∼0.25 m, and uncertainties in ICESat-2 and CryoSat-2 estimates are discussed in the text.
Download figure:
Standard image High-resolution image2.2. Satellite ice thickness (ICESat and CryoSat-2)
Gridded ICESat thickness estimates are from ten data collection campaigns that spanned a period of five years (2003–2008) (Kwok et al 2009). Each campaign acquired data over a ∼33 days period: between mid-October and mid-November (2003–2007) in the fall, and between late February to late March (2004–2008) during the winter. The assessed differences in thickness between ICESat and various measurements are: 0.14 ± 0.51 m (ice draft from moorings), and 0.01 ± 0.42 m (submarine ice draft). These comparisons provide some measure of data quality.
Monthly fields of gridded CryoSat-2 (CS-2) ice thickness are those described in Kwok and Cunningham (2015). Each field represents binned (on a 25 km grid) composites of thickness estimates from all orbits (∼420 orbits) for that month. The assessed differences in thickness between CS-2 and various measurements are: 0.06 ± 0.29 m (ice draft from moorings), 0.07 ± 0.44 m (submarine ice draft), 0.12 ± 0.82 m (airborne electromagnetic sounding), and −0.16 ± 0.87 m (Operation IceBridge—airborne measurements).
Inter-satellite biases between the two satellite-derived thickness records are assessed using consistent in situ measurements that span both records. The best available in situ measurements, common to both satellite records, are those from the upward looking sonar (ULS) ice draft data set (2003—present) from moorings deployed by the Beaufort Gyre Exploration Project (Krishfield et al 2014). Assessment of ICESat and CS-2 estimates of ice draft from these moorings yield mean differences of 0.14 m and 0.06 m (as listed above), respectively; a quantity that includes errors due to the ULS. If differences of ∼0.1 m were representative and statistically homogeneous over the basin, then a volume bias of approximately 700 km3 can be expected between the two records. It should be noted, however, that our present understanding of both the satellite and in situ data is insufficient to resolve any inter-satellite bias to a higher degree of certainty (Laxon et al 2013, Kwok and Cunningham 2015). The analysis of the co-variability of ice volume and MYI coverage (in section 3.5) also lends credence to the consistency of the two independent satellite time series.
2.3. Multiyear sea ice coverage
Gridded fields of MYI coverage are from QuikSCAT and ASCAT acquisitions processed using the approach in (Kwok 2004). Both instruments are moderate resolution wide-swath scatterometers that provide daily coverage of the Arctic Ocean. Uncertainty in ice type classification is ±10% in area coverage with near even mixtures of MYI and seasonal ice, and better quality in areas with nearly pure ice types (i.e., first-year or multiyear ice).
3. Data analysis
In this section, the regional changes in sea ice thickness (since 1958) and the changes within the DRA (1975–2018) first reported in Rothrock et al (1999) and Kwok and Rothrock (2009), are updated with the current CS-2 record. Second, the changes in Arctic sea ice volume during the satellite period are examined. Third, the decline in MYI since 1999 is assessed. Last, the coupled variability in ice volume and multiyear sea ice coverage is explored. In the following, we refer to the Arctic Ocean as that area bounded by the gateways into the Pacific (Bering Strait), the Canadian Arctic Archipelago (CAA), and the Greenland (Fram Strait) and Barents Seas. Within these boundaries, the Arctic Ocean covers an area of ∼7.23 × 10⁶ km2.
3.1. Regional thickness changes (1958–2018)
Briefly, the early submarine data (1958–1976) (figure 1(a)) were manually digitized from paper charts and likely of lower quality than the digitally processed post-1990 data; also, they are available only as mean ice drafts averaged over distances of roughly between 50 and 500 km. To accommodate this early submarine record (1958–1976) in the assessments, we follow the procedures described in Rothrock et al (1999) and Kwok and Rothrock (2009) in examining the regional thickness changes over four periods: pre-1990 submarine (1958–1976), post-1990 submarine (1993–1997), ICESat (2003–2007), and CryoSat-2 (2011–2018).
Regionally, Rothrock et al (1999) identified 29 locations (numbered in figure 1(a)) at which the earlier submarine tracks either cross, or are closely parallel to, the 1990s cruise tracks. At these crossings, they estimated an expected error of 0.13 m due to spatial variability, and a total error (including measurement errors) of 0.3 m. The 29 locations are then assigned to one of six regions: Chukchi Cap, Beaufort Sea, Canada Basin, North Pole, Nansen Basin, and Eastern Arctic. Ice drafts are then seasonally adjusted to September 15 using the modeled annual cycle from an ice-ocean model.
To compare the satellite ice thickness retrievals (ICESat and CS-2) with these submarine data, we replicate the sampling procedure. At the 29 locations, average thicknesses are extracted from the monthly satellite fields and seasonally adjusted to 15 September using the modeled annual cycle as above. The adjustment reduces all satellite thicknesses by less than 0.3 m. So 'fall' is near the end-of-melt minimum.
The changes in ice thickness are shown in a bar chart (in figure 1(b)) that depicts the regional averages over the four periods. In the submarine records (first two periods), separated by about 28 years, the mean ice thickness decreased by 1.4 m (or 46%), from 3.0 to 1.6 m, in most of the deepwater portion of the Arctic Ocean: the decreases are greater in the central Arctic (Canada Basin, North Pole and Nansen Basin) and eastern Arctic than in the Beaufort and Chukchi seas. The ICESat and CS-2 data show further decreases in the thickness, albeit rather smaller. In the roughly 10 years between the post-1990 submarine and ICESat periods: the mean thickness decreased by another 0.2 m or 12% of the thickness. Between the ICESat and CS-2 periods of approximately 8 years, the mean thickness thinned by another 0.4 m (to 1.0 m). Relative to pre-1990 submarine period, near the end of the melt season, the average thickness over these regions decreased by 2.0 m or some 66% over six decades.
The Chukchi Cap is actually ice-free at the end of the melt season in 2007 and since then a large portion of this region has remained ice-free near the end of the melt season. The most dramatic decreases are at the North Pole, where the large retreat of the multiyear ice cover (see discussion in section 3.3) during the ICESat period has continued into the CS-2 period; the retreat of the ice edge toward the pole is now the norm. As well, by the CS-2 period, large portions of the Canada Basin and Nansen Basin are covered by thinner seasonal ice.
3.2. Thickness changes in the DRA
While the analysis in the previous section extends back to the late 1950s, its assessment of thinning is restricted to select regions and sparsely sampled data. Here, the ICESat and CS-2 thickness retrievals are combined with a multi-regression model of the submarine ice drafts released in the DRA (following Kwok and Rothrock 2009). The data in the DRA (which covers ∼38% of the Arctic Ocean) include 2203 samples of 50 km mean ice draft from 34 submarine cruises equally distributed in spring and fall between 1975 and 2000. The regression model, which separates the interannual change, the annual cycle, and the spatial field, can be found in Rothrock et al (2008). The residuals of the regression have a standard deviation of 0.46 m. The regression analysis gives an annual mean ice draft declined from a peak of 3.13 m in 1980 to a minimum of 2.0 m in 2000, a decrease of 1.13 m (1.21 m in thickness). The steepest rate of decrease is –0.08 m yr−1 in 1990 and the rate slows to –0.007 m yr−1 at the end of the record.
Figure 2 shows the combined time series from the regression analysis (RA), and the ICESat and CS-2 thickness retrievals from 1975 to 2018 for a record length of 42 years. The data sets are compared at the center of the fall and winter ICESat campaigns (1 November and 1 March). The values of the winter/summer ICESat and CS-2 data points (in blue/red) represent the mean thickness within the DRA. When Kwok and Rothrock (2009) concatenated the ICESat record to the multi-regression model in the DRA, they found a decline in winter thickness of 1.75 m from 3.64 m in 1980 to 1.89 m in the last winter of the ICESat record. In that record, the steepest thinning rate is –0.08 m yr−1 in 1990 compared to a slightly higher winter/summer rate of –0.10/–0.20 m yr−1 in the 5 year ICESat record (2003–2008). The two records show a long-term trend of sea ice thinning. The thickness trends in the 8 year (2011–2018) CS-2 record are negligible: 0.02 m yr−1 and 0.04 m yr−1 in the winter and fall, respectively. The mean winter CS-2 thickness in the DRA was 2.22 m at the end of the 8 year record—mean over the record is ∼2 m. In the satellite record, the five ICESat years seem to have captured the steep declines in thickness (especially the sharp decrease in thickness after the record setting years of 2005 and 2007); the thinning seems to have slowed in the CS-2 years.

Figure 2. Interannual changes in mean winter and fall ice thickness, within the data release area, from regression analysis of the submarine record (Rothrock et al 2008), and ICESat (Kwok et al 2009) and CryoSat-2 (Kwok and Cunningham 2015) retrievals. Sampling of winter and summer are centered on the dates of the ICESat campaigns. Shadings (blue and red) show expected residuals in the regression analysis. Inset shows the data release area (irregular polygon) of submarine data from US Navy cruises, which covers ∼38% of the Arctic Ocean.
Download figure:
Standard image High-resolution imageThe overall thinning since the maximum thickness of 3.64 m (1980) in the results of the submarine regression model has not changed significantly during the winter (February–March); the mean ice thickness is now close to 2 m. In fall (October–November), the mean thickness seems to have increased from less than 1 m after the end of the summer of 2007. Still, the largest contrast in the record is between the thickness in the 1980s and that observed during the latter half of the last decade. In the earlier years, the thinning is remarkable in that it has occurred when a larger fraction of the Arctic Ocean is covered by MYI. Over the ICESat and CS-2 records, the changes are expected to be smaller with increased coverage of thinner seasonal ice in the DRA.
3.3. Volume during the satellite period (ICESat and CryoSat-2)
Ice volume within a grid cell is the product of the mean cell thickness and cell area, and the total volume is the sum of the volume of all grid cells within the Arctic Ocean. Except for the notable increase in total volume in 2013, the trend in the six years of CS-2 data are insignificant. Taken together, this 15 year satellite record (from ICESat-2 and CS-2) depicts losses in Arctic Ocean ice volume at 2870 km3/decade and 5130 km3/decade in winter (February–March) and fall (October–November); these are more moderate trends compared to the steeper losses of 8620 km3/decade (February–March) and 12 370 km3/decade (October–November) in the ICESat record. The decline in ice volume between the two satellite periods is higher during the fall (October–November). As mentioned earlier, the larger trend in the short ICESat volume record is heavily weighted by the record setting sea ice minimum in 2007 that saw a large loss of ice area (and MYI area) at the end of the melt season.
The increase in sea ice thickness and ice volume (higher by ∼2500 km3) in 2013/2014 (see thickness fields in figure 3 and also evident in the DRA thickness record in figure 2) is attributable to a record extreme in ice convergence event north of the CAA and Greenland coasts during the summer of 2013. In addition to the cooler summer air temperatures in 2013 (compared to 2011–2014 averages) reported (Kwok 2015, Kwok and Cunningham 2015, Tilling et al 2015), Kwok (2015) also noted anomalously strong mechanical convergence (near record extreme over 17 years) of sea ice against the CAA and north coast of Greenland due to persistent on-shore winds that resulted in a net area decrease of ∼23% (of a Lagrangian region) between June and August. Cooler air temperatures and closing of the ice cover reduced ice melt and the impact of openings on air temperatures (i.e., lower albedo and reduced ice-albedo feedback) in the ice cover and allowed more of the first-year ice (FYI) and MYI to survive the summer. Thus, this anomalous increase is due primarily to ice dynamics; the ice volumes in the years that follow seem to suggest a return to the slow decline after this extreme convergence event: this thicker ice does not melt in the region where it is formed but it has to be advected to a region (e.g., southern Beaufort) where it the warmer temperature are conducive to melt. Typically, it takes a year or two for this ice to be transported to the southern Beaufort.
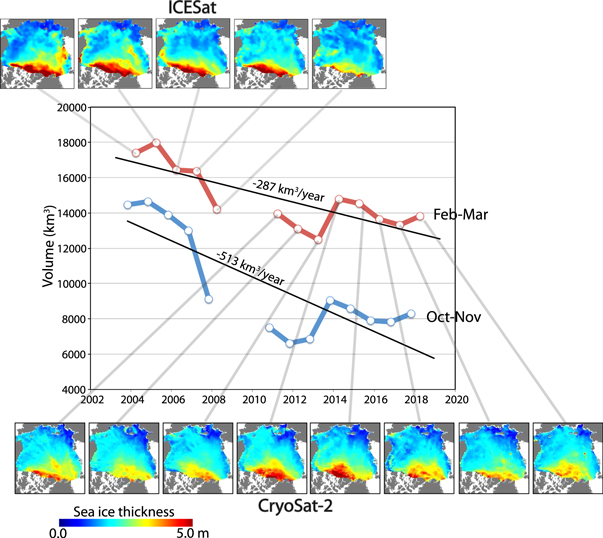
Figure 3. Arctic sea ice volume calculated from ICESat (2003–2008) and CS-2 (2011–2018) thickness fields. Volume is computed within the Arctic basin bounded by the gateways into the Pacific (Bering Strait), the CAA, and the Greenland (Fram Strait) and Barents Seas. This encompasses the entire Arctic Basin compared to the smaller area in figure 2.
Download figure:
Standard image High-resolution image3.4. Multiyear sea ice coverage
The changes and variability in a decadal scatterometer record Arctic MYI coverage (1999–2010) were first examined by Kwok et al (2009) and Polyakov et al (2012). Adding to that MYI record, the spatial coverage through 2017 (figure 4(a)) shows significant declines over large portions of the Arctic Ocean. Overall, from the peak coverage in 2002 to the end of our record in 2017 (figure 4(b)), the Arctic has lost more than 2 × 10⁶ km2 of MYI—a decrease of >50%; MYI now covers less than one-third of the Arctic Ocean. The remaining MYI resides to the north of the coast of Greenland and the CAA. With the large decline in MYI coverage over this record, there is a reversal in the relative contributions of the two ice types to the total area of the Arctic Ocean ice cover. Seasonal ice, having surpassed that of MYI in winter area coverage is now the dominant ice type, shifting the Arctic ice cover into a new normal where the focus on understanding processes over first-year sea are as important as those over MYI ice (Jeffries et al 2013).

Figure 4. Decline in multiyear sea ice coverage from the QuikSCAT (1999–2009) and ASCAT (2009–2018) scatterometers. (a) Spatial trends. (b) Trends in basin-scale coverage and fields of multiyear sea ice fraction at the beginning of the year (1 January).
Download figure:
Standard image High-resolution imageIn recent years, the southern Beaufort Sea has become a sink of MYI during the summer. Prior to the 1990s, the MYI coverage decreases monotonically from the beginning of the growth season (late September) through the end of winter due to ice export primarily through the Fram Strait and to ice convergence (no MYI is created during the winter). On average ∼10% of the area of the Arctic Ocean ice cover is lost to export every year (Kwok 2009). The FYI area that survived the summer then contributes the step increase in MYI area at the end of each summer and replenishes the MYI reservoir after each winter's depletion through export, deformation, and melt. Balance between mainly export and replenishment, and to a smaller extent melt within the Arctic Basin is necessary to maintain a stable MYI area. Kwok and Cunningham (2010) have shown, in recent years, that MYI melt in the Beaufort Sea could be comparable to Fram Strait outflow; MYI advected into the southern Beaufort Sea is no longer survives summer melt, and this region has become a significant sink of MYI ice volume. Also, melt of MYI in the Beaufort Sea cuts off the clockwise recirculation path for thicker MYI ice advected in from north coast of Greenland and the CAA, the source region of the thickest ice in the Arctic. The consequence of this a reduction in the residence time and thus age and thickness of sea ice that can be found in the Arctic Ocean (Maslanik et al 2011). After the significant retreat in summer ice extent 2007, there was a record decrease in Arctic MYI coverage (figure 4) due to melt within the Arctic (in the southern Beaufort) in addition to export through the Fram Strait.
3.5. Coupled variability of volume and MYI coverage
Here, we examine the co-variability of the two independent MYI coverage and volume records. The simultaneous increases and decreases of the two sea ice parameters are clearly seen in figure 5(a). The results are quite remarkable—we find that MYI anomalies (i.e., detrended values in figure 5(b)) explain ∼85% of the variance in the anomalies in Arctic sea ice volume. The regression coefficient of 2.25 km3 km−2 gives the expected change in volume (km3) per unit change in MYI area (km2). Over the record, the variability in MYI area accounts for ∼3000 km3 in peak-to-peak variability of the ice volume (figure 5(b)), or 20% of the average winter ice volume of 14 771 km3 (in figure 5).

Figure 5. Coupled variability of Arctic Ocean sea ice volume and multiyear sea ice (MYI) coverage. (a) Time-varying sea ice volume (from figure 3) and MYI coverage (from figure 4) in winter (2003–2018). (b) Detrended time series of (a). (c) Scatterplot of detrended ice volume and MYI coverage.
Download figure:
Standard image High-resolution image
There are two extreme changes of note in the time series of MYI area and volume: (1) the large decrease in volume/MYI-coverage after the record setting low sea ice coverage at the end of the summer of 2007, and, (2) the large increase in volume/MYI-coverage in 2013/2014 associated with the extreme in ice convergence (discussed above). These are superimposed on overall decreasing trends in MYI coverage and volume. Although 2012 was another record-setting year in end-of-summer ice coverage, it did not have the same impact on ice volume or MYI coverage as the record set in 2007. In terms of sea ice processes, this highlights the importance of ice deformation (dynamics) in maintaining the thick ice cover in the Arctic Ocean. However, the impact of MYI coverage on total thickness and volume is expected to diminish as the MYI contribution to the total volume declines.
Also of note is that, given the correlation between volume and MY coverage, the MYI area time series provides a reasonable depiction of the variability of ice volume during the two-year gap in ice volume (i.e., 2009 and 2010). Since the extensive validation of large-scale satellite estimates of sea ice variables remains a challenge, the consistency between the two independent time series lends credence to quality of the satellite volume and MYI retrievals.
4. Conclusions
The large-scale changes in Arctic sea ice thickness, volume and multiyear sea ice (MYI) coverage with available thickness estimates from submarine sonars and satellite altimeters (ICESat and CryoSat-2), and MYI coverage from satellite scatterometers, as well as their potential uncertainties are summarized. The submarine ice draft record spans the period from 1958 to 2000, and the satellite altimeter records from 2003 to 2018 (almost a 15 year record). In particular, the satellite record spans three record-setting extremes in end-of-summer ice coverage: 2005, 2007 and 2012. The regional changes in sea ice thickness (since 1958) and the thickness changes within the data release area of the Arctic Ocean, previously reported in Kwok and Rothrock (2009), have been updated to include the 8 years of CS-2 thickness retrievals. The trends in Arctic Ocean sea ice volume and multiyear sea ice coverage are examined and the coupled variability between these two variables are quantified. The results can be summarized as follows:
- Trends in Arctic sea ice thickness, volume, and multiyear ice coverage are important and useful indicators of changes in polar and global climate.
- Between the pre-1990 submarine period (1958–1976) and the CS-2 period (2011–2018) the average thickness near the end of the melt season, over six regions, decreased by 2.0 m or some 66% over six decades.
- Within the data release area (which covers ∼38% of the Arctic Ocean), the overall thinning of 1.75 m in ice thickness since 1980, from a maximum thickness of 3.64 m in the results of the submarine regression analysis, has not changed significantly during the winter (February–March); the mean ice thickness is at ∼2 m. The 5 year ICESat trend (2003–2008) captured the large thinning associated the record-setting sea ice minima of 2005 and 2007, while the 8 year trend in the CS-2 record (2011–2018) seems insignificant. Still, the largest contrast is between the thickness in the 1980s and that observed during the latter half of the last decade. In the earlier years, the thinning is remarkable in that it has occurred when a major portion of the Arctic Ocean is covered by thick MYI. Over the ICESat and CS-2 records, the changes are expected to be smaller with increased coverage of thinner seasonal ice in the DRA.
- The 15 year satellite record (from ICESat-2 and CS-2) of Arctic Ocean ice volume depicts losses of 2870 km3/decade and 5130 km3/decade in winter (February–March) and fall (October–November); these are more moderate trends compared to the steeper losses of 8620 km3/decade (February–March) and 12 370 km3/decade (October–November) in the ICESat record, where the trend was heavily weighted by the record-setting ice retreat during the summer of 2007.
- From the peak MYI coverage in 2002 to the end of our record in 2017, the Arctic has lost more than 2 × 10⁶ km2, a decrease of 50%; MYI now covers less than one-third of the Arctic Ocean. As with ice volume, the largest decline in MYI coverage followed the record-setting end-of-summer ice extent in 2007. In addition to annual ice export, recent losses of MYI are due to melt of MYI advected into the southern Beaufort Sea from the north coast of Greenland and the CAA, the source region of the thickest and most deformed ice in the Arctic Ocean.
- The two independent MYI coverage and volume records co-vary in time. Superimposed on overall decreasing trends in MYI coverage and volume, the MYI area anomalies explain ∼85% of the variance in the anomalies in Arctic sea ice volume.
The large losses of thick MYI during the last two decades dominated the thickness and volume signals in the satellite records (since 1999). Within the context of thickness and volume, this shift of the Arctic ice cover towards a largely seasonal ice cover (of >70% in January) is significant since it changes the expected seasonal cycle of mass balance: seasonal ice has a thinner snow cover and grows fast thus increasing ice volume production, even though this seasonal ice does not get thick enough to survive the summer. The thickness and volume of the Arctic ice cover, if losses of MYI continue, will be controlled by seasonal ice, suggesting that the volume and thickness trends will be more moderate (due to reduced thickness and volume) but more sensitive to climate forcing.
Acknowledgments
The CryoSat-2 altimetry data are from ESA's data portal (URL: https://earth.esa.int). The ICESat and CryoSat-2 ice thickness fields are available at http://rkwok.jpl.nasa.gov/projects/index.html. This work was performed at the Jet Propulsion Laboratory, California Institute of Technology, under contract with the National Aeronautics and Space Administration.
©2018 California Institute of Technology. Government sponsorship acknowledged.