

Abstract
Large-scale 2nd generation bioenergy deployment is a key element of 1.5 °C and 2 °C transformation pathways. However, large-scale bioenergy production might have negative sustainability implications and thus may conflict with the Sustainable Development Goal (SDG) agenda. Here, we carry out a multi-criteria sustainability assessment of large-scale bioenergy crop production throughout the 21st century (300 EJ in 2100) using a global land-use model. Our analysis indicates that large-scale bioenergy production without complementary measures results in negative effects on the following sustainability indicators: deforestation, CO2 emissions from land-use change, nitrogen losses, unsustainable water withdrawals and food prices. One of our main findings is that single-sector environmental protection measures next to large-scale bioenergy production are prone to involve trade-offs among these sustainability indicators—at least in the absence of more efficient land or water resource use. For instance, if bioenergy production is accompanied by forest protection, deforestation and associated emissions (SDGs 13 and 15) decline substantially whereas food prices (SDG 2) increase. However, our study also shows that this trade-off strongly depends on the development of future food demand. In contrast to environmental protection measures, we find that agricultural intensification lowers some side-effects of bioenergy production substantially (SDGs 13 and 15) without generating new trade-offs—at least among the sustainability indicators considered here. Moreover, our results indicate that a combination of forest and water protection schemes, improved fertilization efficiency, and agricultural intensification would reduce the side-effects of bioenergy production most comprehensively. However, although our study includes more sustainability indicators than previous studies on bioenergy side-effects, our study represents only a small subset of all indicators relevant for the SDG agenda. Based on this, we argue that the development of policies for regulating externalities of large-scale bioenergy production should rely on broad sustainability assessments to discover potential trade-offs with the SDG agenda before implementation.
Export citation and abstract BibTeX RIS

Original content from this work may be used under the terms of the Creative Commons Attribution 3.0 licence.
Any further distribution of this work must maintain attribution to the author(s) and the title of the work, journal citation and DOI.
Introduction
Large-scale bioenergy deployment of up to 300 EJ per year by 2100 is a key element of 1.5 °C and 2 °C transformation pathways [1, 2]. In such ambitious mitigation scenarios, bioenergy is primarily used in combination with carbon capture and storage (CCS), so that energy production simultaneously leads to a removal of carbon dioxide (CO2) from the atmosphere [3]. When CCS is assumed to be unavailable in low climate stabilization scenarios (reflecting technology failure or missing social acceptance), bioenergy deployment still contributes significantly to climate change mitigation by the substitution of fossil fuels [4].
Like the production of food, the production of bioenergy requires land, water and nutrients. Today's agricultural systems occupy ~38% of the Earth's ice-free land surface (cropland and pasture), account for ~70% of global freshwater withdrawals and rely on substantial amounts of reactive nitrogen fixation (about three times the pre-industrial level) [5, 6]. Currently, prevailing practices to increase agricultural production impair the environment [5, 7]. The expansion of agricultural land is a major driver of deforestation [8], which causes CO2 emissions [9] and threatens biodiversity, especially in the tropics [10]. On the other hand, land-use intensification causes nutrient pollution by increased use of fertilizer, which can harm aquatic and marine ecosystems and contributes to air pollution [5, 7, 11]. Hence, there are currently trade-offs between the provision of food and the maintenance of biodiversity and regulating ecosystem services such as carbon sequestration or water purification [12–14]. Thus, large-scale bioenergy production for climate change mitigation in addition to the provision of food for a growing world population might exacerbate adverse side-effects of agricultural production in the coming decades, which would conflict with the global Sustainable Development Goal (SDG) agenda [15].
One approach to reconcile large-scale bioenergy production with the global SDG agenda are environmental protection measures such as forest or water conservation schemes [16–19]. However, regulating one environmental externality of bioenergy production may interfere with other SDGs [20, 21]. For instance, forest protection may increase competition for land, potentially leading to a rise in food prices.
Another strategy to align large-scale bioenergy production with the SDG agenda could be the implementation of measures reducing the pressure on land in general (land-sparing measures) such as improved agricultural productivity [22] or reduced consumption of resource intensive livestock products combined with less household waste [20].
The existing literature on sustainability trade-offs in the context of global large-scale bioenergy production is mostly limited to land and water conservation schemes [16–19, 23]. Moreover, land and water conservation schemes as well as other measures that could alleviate unwanted side-effects of bioenergy production have not been studied within a consistent analytical framework so far. Our study extends the existing literature in three dimensions. First, we cover more sustainability indicators than previous studies on side-effects of bioenergy production. Second, we investigate more complementary measures (standalone and in combinations) next to large-scale bioenergy production within a consistent analytical framework than previous studies. Third, we analyze the importance of future food demand developments for the effectiveness of such complementary measures.
In this study, we carry out a multi-criteria sustainability analysis to assess how global large-scale bioenergy production may conflict with other sustainability objectives throughout the 21st century and to what extent complementary measures could help to resolve such sustainability trade-offs. Besides forest and water protection schemes, we also investigate to what extend improved fertilization efficiency and agricultural intensification could reduce side-effects of large-scale bioenergy production. We assume identical 2nd generation bioenergy demand across all scenarios (except a baseline scenario without bioenergy demand) to identify the effects of a single measure or a combination of measures on the following sustainability indicators (mapping to SDGs in brackets): deforestation [SDG 15], CO2 emissions from land-use change (LUC) [SDG 13], nitrogen losses to the environment [SDGs 13, 14, 15], unsustainable water withdrawals [SDG 14], food price index [SDG 2] and bioenergy prices [SDG 7].
The global 2nd generation bioenergy demand trajectory used here increases linearly from 0 EJ in 2010 to 300 EJ in 2100, which reflects the upper end of projections from Integrated Assessment Models (IAMs) for bioenergy deployment in 1.5 °C and 2 °C transformation pathways [1]. With this in mind, our study setup allows to analyze the upper end of environmental and social implications bioenergy crop production may entail under ambitious climate protection. In the IAM projections, high-yielding dedicated 2nd generation bioenergy crops such as grasses (miscanthus) and fast-growing trees (eucalyptus, poplar) play a central role and are also heavily discussed on their potential as well as side-effects [24, 25]. Therefore, we focus on dedicated grassy and woody biomass in this study.
Methods
For our multi-criteria sustainability analysis, we use the global multi-regional land-use optimization model MAgPIE (Model of Agricultural Production and its Impacts on the Environment) [26]. MAgPIE integrates various spatially explicit biophysical factors such as land, yields and available water into an economic decision-making mechanism. In the following, we summarize the key features of MAgPIE, describe the sustainability indicators derived from MAgPIE and introduce our scenario setup. In the supplementary information (SI) available at stacks.iop.org/ERL/13/024011/mmedia, we expand our methods by a detailed general model description, additional details on modelling of bioenergy in MAgPIE, key scenario inputs and more detailed descriptions of the scenario implementations.
Land-use optimization model MAgPIE
MAgPIE is a global multi-regional partial equilibrium model of the land-use sector [27, 28]. The objective function of the model is the minimization of global costs for agricultural production (food and bioenergy) throughout the 21st century (5 year time steps) in recursive dynamic mode (see supplementary figure S1 for an overview). The model is driven by demand for agricultural commodities (supplementary figure S12), which is calculated based on population and income projections for the 21st century from the Shared Socio-economic Pathways (SSPs) [29]. The production of agricultural commodities is associated with costs for labor, capital, fertilizer, technological change, transport, and land conversion. Demand and costs enter the model at the level of ten world regions (supplementary figure S7, supplementary table S2). To account for trade barriers, the regions have to produce a certain share of their demand domestically [30]. For meeting the demand, the model endogenously decides, based on cost-effectiveness, about the level of intensification (yield-increasing technological change), extensification (LUC), and production relocation (intra-regionally and inter-regionally through international trade) [30, 31]. The model can also be run with exogenous assumptions for crop productivity. In these cases, crop productivity is taken from a model run that was performed with endogenous intensification (see SI section 3.4 for details). The optimization process is subject to various spatially explicit biophysical conditions, which are derived by the global crop growth, vegetation, and hydrology model LPJmL [32, 33]. Due to computational constraints, spatially explicit input (0.5 degree resolution) is aggregated to 700 simulation units for the optimization process based on a k-means clustering algorithm (supplementary figure S2) [34]. Technically, MAgPIE is a non-linear mathematical programming model that is written in GAMS and solved by CONOPT.
Bioenergy in MAgPIE
MAgPIE simulates two types of bioenergy production: 1st and 2nd generation bioenergy. 1st generation bioenergy relies on conventional food crops such as maize and sugarcane. In contrast, 2nd generation bioenergy is provided by dedicated herbaceous and woody lignocellulosic bioenergy crops (such as Miscanthus, Poplar and Eucalyptus), which feature significantly higher yields [35].
Whereas demand for 1st generation bioenergy (and all other agricultural commodities) in MAgPIE is defined for ten economic world regions based on existing policies, 2nd generation bioenergy demand enters the model at the global scale. Spatial allocation of 2nd generation bioenergy production is an endogenous model decision resulting from the cost minimizing objective function, which takes into account land and water availability as well as bioenergy yields and production costs [16, 19, 36]. The SI provides additional details on modelling of bioenergy in MAgPIE (SI sections 1.2 and 2.2)
Indicators derived from MAgPIE
To identify sustainability trade-offs related to large-scale bioenergy production, we carry out a multi-criteria analysis covering the following six indicators (see table 1). We derive these indicators from MAgPIE for all scenarios listed in table 2 (see next paragraph). To put our analysis in the context of the SDGs, we additionally map each indicator to one or more SDG(s).
Table 1. Sustainability indicators derived from MAgPIE for each scenario and mapping of these indicators to SDGs.
| Name | Unit | Mapping to SDGs |
|---|---|---|
| Deforestation | Mha since 2010 | SDG 15 (life on land) |
| LUC emissions | GtCO2 since 2010 | SDG 13 (climate action) |
| Nitrogen losses | Tg Nr yr−1 | SDGs 13, 14 (life below water) and 15 |
| Water use above EF | km yr−3 | SDG 14 (life below water) |
| Food price index | Index (2010 = 1) | SDG 2 (zero hunger) |
| Bioenergy price | US$2005/GJ | SDG 7 (affordable and clean energy) |
Table 2. Summary of study design. (a) Scenario definitions, (b) bioenergy demand and (c) parameter settings entering the MAgPIE model. Parameter settings are shown in aggregated form at the global scale (see SI section 3 for details).
| a) | |||
|---|---|---|---|
| Scenario | Bioenergy | Environmental protection and land-sparing measures (P1 to P5 indicate the corresponding parameters; see c) | Expected positive effect on indicator(s) |
| NoBio | off | − | |
| Bio | on | − | |
| Bio-REDD | on | Forest protection by putting a price on CO2 emissions from the conversion of forests and other carbon-rich ecosystems (P1) | deforestation, LUC emissions |
| Bio-EffNfert | on | Improved soil nitrogen uptake efficiency (P2) | nitrogen losses |
| Bio-WaterProt | on | Protection of water resources based on environmental flow requirements (P3) | water use above EF |
| Bio-IntensAg | on | Higher food and bioenergy crops yields (P4) and higher livestock productivity (P5) | deforestation, LUC emissions food price index, bioenergy price |
| Bio-All | on | Combination of REDD, EffNfert, Water-Prot and IntensAg (P1-P5) | all |
| b) | |||||||
|---|---|---|---|---|---|---|---|
| 2010 | 2015 | 2030 | 2040 | 2050 | 2075 | 2100 | |
| Bioenergy demand (EJ yr−1) | 0 | 17 | 67 | 100 | 133 | 217 | 300 |
| c) | ||||||||
|---|---|---|---|---|---|---|---|---|
| No measure (default) | Measure | |||||||
| Parameter ID and name | 2010 | 2030 | 2050 | 2100 | 2030 | 2050 | 2100 | |
| P1 | CO2 price in US$/tCO2 | 0 | 0 | 0 | 0 | 24 | 65 | 743 |
| P2 | Soil nitrogen uptake efficiency [37] | 53% | 57% | 60% | 60% | 65% | 75% | 85% |
| P3 | Environmental flow protection [38] | off | on | |||||
| P4 | Yield-increasing technological change (food and bioenergy crops) [31] | exogenous (based on NoBio) | endogenous; resulting in higher crop yields | |||||
| P5 | Livestock productivity | medium | high | |||||
Deforestation is calculated as the difference between forest area in each simulation time step and forest area in the reference year 2010 [26].
LUC CO2 emissions (cumulative) are calculated as the difference between terrestrial carbon stocks in each simulation time step and terrestrial carbon stocks in the reference year 2010 [26]. For instance, if forest is converted to cropland, carbon stocks decline, resulting in CO2 emissions from LUC.
Nitrogen losses to the environment from cropland soils and animal waste management are calculated based on a nitrogen budget approach [37]. Nitrogen removal in plant biomass depends on crop type and yield-dependent residue production. Soil uptake is estimated as nitrogen removal minus biological fixation by N-fixing plants. Dependent on the soil nitrogen uptake efficiency, which is an exogenous scenario parameter in the model (see SI section 3.2), total nitrogen fertilization requirements are estimated. All available organic nitrogen fertilizers (e.g. manure, crop residues) are used to fulfill the fertilization requirements. Subsequently, the remainder needs to be balanced out by the application of inorganic nitrogen fertilizer. Nitrogen losses are estimated as the difference between crop uptake and organic as well as inorganic fertilizers.
Water use above environmental flow (EF) requirements, i.e. unsustainable water withdrawals, are derived by comparing the sum of human and environmental water demand to available water [38]. In MAgPIE, human water demand consists of domestic, industrial and agricultural water demand. While domestic and industrial water demand are exogenous based on WaterGAP simulations [39, 40], agricultural water demand depends on irrigated crop production, which is dynamic in MAgPIE [30]. In addition, irrigation infrastructure can be extended endogenously based on cost-effectiveness [30]. The required water for irrigation is proportional to the production volume. Environmental water demand is based on spatially explicit environmental flow requirements (Smakhtin algorithm) [38]. Available water, also spatially explicit, is derived from LPJmL [32, 33].
The food price index weights current prices based on current food baskets (Paasche price index) [41]. The food prices used for calculating the food price index are shadow prices, taken from the regional food demand constraint in the model (see SI section 1.1 for details on shadow prices).
Bioenergy prices are also shadow prices, taken from the global bioenergy demand constraint in the model, and thus reflect the changes in the aggregate world market price for 2nd generation bioenergy feedstocks [19].
In the supplementary information, we compare the absolute level and trend of these indicators or appropriate proxies with observed data (supplementary figures S20−S27).
Scenarios run with MAgPIE
To investigate environmental and socio-economic effects of large-scale bioenergy production with and without accompanying measures, we run the following scenarios with MAgPIE (table 2).
The general setup of our scenarios including food demand is based on the SSP2 'middle-of-the-road' storyline for the land use sector, which represents a continuation of current social, economic, and technological trends into the future [42]. All scenarios include the same 1st generation bioenergy demand trajectory. The SI provides more details on key scenario inputs (e.g. food and bioenergy demand).
We start by comparing a scenario with 2nd generation bioenergy demand (Bio) to a scenario without 2nd generation bioenergy demand (NoBio).
Subsequently, we analyze scenarios combining 2nd generation bioenergy demand and single measures aimed at alleviating particular negative side-effects of bioenergy production. The guiding principle behind our scenario design is to have one measure with expected positive effects for each sustainability indicator. These scenarios include: a forest protection scenario (Bio-REDD) to lower deforestation and associated LUC emissions, a scenario with improved fertilization techniques (Bio-EffNfert) to lower nitrogen losses, a water protection scenario (Bio-WaterProt) to lower water use above EF. In addition to these protection scenarios, we assess a scenario with higher crop yields and livestock productivity (Bio-IntensAg), which reduces the overall pressure in the land-use system. We expand on the motivation of these scenarios in the results section. The SI provides details for each scenario implementation (i.e. for REDD, EffNfert, WaterProt and IntensAg).
Finally, we estimate the effects of combining 2nd generation bioenergy production with all the above measures (Bio-All).
The measures we analyze in combination with 2nd generation bioenergy production could also help to lower side-effects of agricultural production in general. To investigate these effects, we run all scenarios listed in table 2 additionally without 2nd generation bioenergy (see SI section 6).
Our scenario setup (table 2) includes bioenergy scenarios with single measures (e.g. Bio-REDD) and all four measures together (Bio-All). To decompose the interactions of measures on indicator outcomes, we additionally test all combinations of measures possible (e.g. Bio-REDD-WaterProt or Bio-REDD-WaterProt-IntensAg).
To facilitate straightforward comparison of these scenario results we calculate a normalized score (based on [23]) for each sustainability indicator at the global scale. The score ranges between 0 and 1, in which 0 is the worst outcome across all scenarios in year 2100 for a particular indicator and 1 is the best outcome. In addition, we sort the scenarios according to the sum of indicator scores. For the six indicators we consider here (see table 1), the best possible scenario has a score sum of 6 (all six indicators have a score of 1), whereas the worst scenario has a score sum of 0.
Importance of food demand
Future food demand is seen as a key driver for the development of the agricultural sector [42]. To evaluate the stability of our results we run all scenarios listed in table 2 with SSP1 (sustainable development) and SSP5 (fossil-fueled development) food demand in addition to our default SSP2 (middle-of-the-road) setting. Total food demand, and hence overall pressure in the land-use sector, is increasing from SSP1 to SSP2 to SSP5 (see SI). For analyzing the results of these scenarios, we apply the normalized score approach described above, with the difference that the score for each indicator is calculated across scenarios, time steps and food demand scenarios.
Results
Adverse side-effects of large-scale bioenergy crop cultivation
Our modelling results indicate that rising production of bioenergy crops for climate change mitigation throughout the 21st century gradually increases the number and magnitude of negative global environmental externalities (Bio scenario). Global 2nd generation bioenergy crop area amounts to 180 Mha in 2030 (67 EJ), 312 Mha in 2050 (133 EJ) and 636 Mha in 2100 (300 EJ). The absolute increase of global cropland needed to accommodate additional food, feed and bioenergy crop production between 2010 and 2030 amounts to 441 Mha, which is a relative increase of cropland by 27% (global cropland in 2010 is 1617 Mha) (figure 1). In the absence of bioenergy deployment (NoBio scenario), cropland increases only by 231 Mha (14%). Cropland mainly expands into pasture and forest areas. Global pasture/forest area (2968/4152 Mha in 2010) declines between 2010 and 2030 by 234/147 Mha under bioenergy deployment (Bio scenario) compared to 133/60 Mha without (NoBio scenario). Cropland expansion into pasture, forest and other natural vegetation for food and bioenergy production results in global cumulative emissions of 146 Gt CO2 between 2010 and 2030 (Bio scenario), compared to 57 Gt CO2 without bioenergy (NoBio scenario) (figure 2(a)). Thus, the impact of providing 67 EJ bioenergy in 2030 is more than a doubling of global LUC CO2 emissions. By 2050, global annual bioenergy demand increases to 133 EJ in our scenarios, which causes a rise in nitrogen losses due to increased fertilizer use (+16%) and water use above EF (+49%) besides higher LUC emissions (+180%); numbers are relative to the NoBio baseline scenario in 2050 (figure 2). By 2100, when global bioenergy demand reaches 300 EJ yr−1, adverse side-effects of bioenergy crop production further increase. Not only the global environmental indicators, such as LUC emissions (+437%), nitrogen losses (+34%) and water use above EF (+142%) rise, but also food prices are 28% higher (figure 3(a)). Thus, our results indicate that large-scale bioenergy production conflicts partly with SDGs 2, 13, 14 and 15 in the absence of complementary measures. The supplementary data provides for each scenario listed in table 2 detailed numerical results.
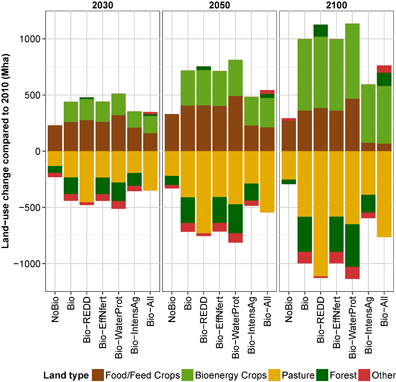
Figure 1. Scenario results for global land-use change in 2030, 2050 and 2100 compared to 2010. Colors depict different land types. Global land cover in 2010 amounts to 1581 Mha for cropland (food/feed crops), 2994 Mha for pasture, 4157 Mha for forest and 4175 Mha for other land (12907 Mha in total).
Download figure:
Standard image High-resolution image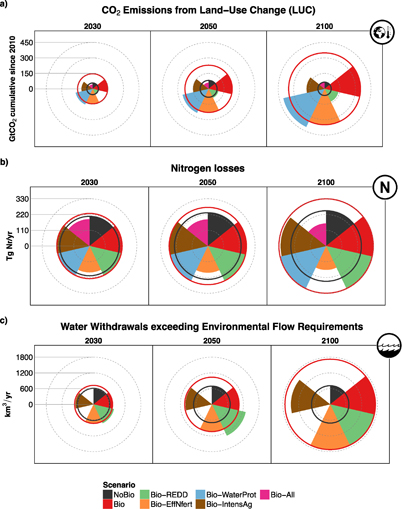
Figure 2. Environmental indicators for 2030, 2050 and 2100 at the global scale. (a) CO2 emissions from LUC, (b) nitrogen losses and (c) water withdrawals exceeding environmental flow requirements. Solid black circles mark indicator levels without bioenergy production (NoBio scenario). For scenarios with bioenergy production, values outside black circles indicate adverse side-effects of bioenergy production (e.g. LUC CO2 emissions in Bio). The environmental protection and land-sparing measures included our scenarios apply not only on bioenergy production but on agricultural production in general. Hence, co-benefits can occur, which are indicated by scenario results located inside black circles (e.g. nitrogen losses in Bio-EffNfert). Solid red circles mark indicator levels of bioenergy production without complementary measures (Bio scenario). If scenario results are located outside solid red circles for a particular indicator, the underlying measure increases adverse-side effects of agricultural production in this dimension, i.e. the measure, which may successfully lower other impacts, involves a new sustainability trade-off (e.g. LUC CO2 emissions in Bio-WaterProt). The supplementary data provides detailed numerical results.
Download figure:
Standard image High-resolution image
Figure 3. Socio-economic indicators for 2030, 2050 and 2100 at the global scale. (a) food price index and (b) bioenergy prices. See caption of figure 2 for the interpretation of circles.
Download figure:
Standard image High-resolution imageAccording to our modelling results, the most important regions for bioenergy production are Sub-Saharan Africa (AFR) and Latin America (LAM), which together account for more than 50% of global bioenergy production (supplementary figure S28). As a consequence, AFR and LAM are those regions that face the strongest environmental impacts of bioenergy crop production throughout the 21st century in terms forest loss, CO2 emissions from LUC, nitrogen losses and unsustainable water withdrawals (supplementary figures S29−S32). Moreover, LAM shows the strongest increase in food prices among all regions (supplementary figure S33).
The positive LUC emissions due to biomass production have to be seen in comparison with CO2 emission reductions and offsets resulting from the use of biomass in the transport and energy sector [4, 43]. As the combustion of biomass releases only carbon back to the atmosphere that was sequestered before through the growth of biomass on the field, the substitution of fossil fuels by biofuels can reduce CO2 emissions in the transport sector. Moreover, the combination of biomass-based energy generation with CCS technology can provide energy and remove carbon dioxide from the atmosphere at the same time. According to our scenario results, global cumulative LUC emissions attributable to biomass production (300 EJ in 2100) amount to 293 GtCO2 by 2100. Klein et al project that large-scale deployment of bioenergy with CCS (300 EJ in 2100) could remove 830 GtCO2 from the atmosphere by 2100 globally [4]. Hence, the carbon debt of biomass production can be expected to be offset over time by bioenergy use with CCS.
Single measures
Reduced Emissions from Deforestation (REDD+) To avoid losses of biodiversity and carbon-rich forest ecosystems mainly due to agricultural expansion, the REDD+ scheme has been adopted under the UNFCCC (United Nations Framework Convention on Climate Change) [44]. Here, we combine a REDD+ scheme with large-scale bioenergy crop production to analyze the repercussions in the agricultural system. In the corresponding Bio-REDD scenario, expansion of agriculture into forests and other carbon-rich ecosystems is restrained by putting a price on CO2 emissions from LUC (figure 1). As a consequence, global cumulative CO2 emissions from LUC are substantially lower compared to the case without forest protection (Bio scenario) (figure 2(a)). However, the global food price index rises stronger if bioenergy production is accompanied by a forest protection scheme, which limits the land that is available for agricultural expansion (figure 3(a)). Hence, a REDD+ scheme increases the competition for land between food and bioenergy production, which results in higher food prices. Besides food prices, also bioenergy prices rise (figure 3(b)). The food price index under a REDD+ scheme particularly increases in developing and emerging economies such as Southern Asia (SAS), Latin America (LAM) and Sub-Saharan Africa (AFR), while price increases in industrialized economies are more modest (supplementary figure S33). Hence, large-scale bioenergy production complemented by a global forest protection scheme (SDGs 13 and 15) might exacerbate conflicts with food security (SDG 2), in particular in developing economies.
Improved fertilization techniques At the global scale, only about half of the inorganic nitrogen fertilizer applied to soils is taken up by crops, while the remainder is lost to the environment causing a cascade of environmental problems [37, 45]. An improvement of the nitrogen use efficiency (NUE) [46] has been proposed to alleviate the negative consequences of nitrogen pollution by 'fertilizing the right amount of the right fertilizer at the right time and right place (4R)' [37]. In our Bio-EffNfert scenario, which combines such improved fertilization techniques with bioenergy cultivation, global nitrogen losses amount to 165 Tg Nr yr−1 by 2100 (figure 2(b)), which is substantially lower compared to the Bio (324 Tg Nr yr−1) and even to the NoBio scenario (242 Tg Nr yr−1). Nitrogen losses in the Bio-EffNfert scenario are lower than in the absence of bioenergy because improved fertilization techniques benefit not only bioenergy but also food crop cultivation. Our results suggest that improved fertilization efficiency has no implications for other indicators except nitrogen losses (SDGs 13, 14 and 15). Land and water use remain unchanged because the same production just requires less nitrogen fertilizer (figure 2). Prices are not affected because we assume that production costs remain constant under more efficient fertilization (figure 3).
Protection of freshwater ecosystems To prevent further degradation of freshwater ecosystems it has been proposed to limit human water withdrawals to a level compatible with local environmental flow requirements (water required to maintain the ecosystem functions of rivers and lakes) [38, 47]. Our Bio-WaterProt scenario combines such a water protection scheme with bioenergy cultivation. However, the sustainable use of water in this scenario (figure 2(c)) comes at the cost of increased cropland expansion into pasture and forest areas (figure 1) because less water is available for irrigation of food and bioenergy crops. Global bioenergy crop area increases to 667 Mha by 2100, compared to 636 Mha in the Bio scenario without environmental flow protection. Deforestation increases in particular in Sub-Saharan Africa (AFR) (supplementary figure S29). By 2100, increased cropland expansion in the Bio-WaterProt scenario results in higher global cumulative LUC emissions (425 Gt CO2) than in the Bio scenario (349 Gt CO2) (figure 2(a)). Therefore, our results indicate that accompanying large-scale bioenergy crop production with a water protection scheme (SDG 14) involves a trade-off with the protection of terrestrial ecosystems and its carbon stocks (SDGs 13 and 15).
Increases in agricultural productivity More efficient crop and livestock production systems can effectively lower the need for further expansion of agricultural land into natural ecosystems [20, 22]. Here, we explore to what extent such land-sparing measures could reduce unwanted side-effects of large-scale bioenergy crop production (Bio-IntensAg scenario). If higher investments in agricultural research and development (R&D) lead to higher crop yields along with increased livestock productivity (supplementary figures S18 and S19), total cropland expansion for food and bioenergy production into forests and other natural ecosystems is about halved (figure 1). Global bioenergy crop area declines to 520 Mha in 2100 compared to 636 Mha in the Bio scenario. Reduced land expansion results in a reduction of global LUC emissions comparable to the Bio-REDD scenario with explicit forest protection (figure 2(a)). At the same time, the global food price index is similarly low as under no bioenergy production because of higher flexibility in how rising food demand is met (figure 3(a)). Thus, if large-scale bioenergy production is complemented by R&D-driven increases in agricultural productivity, deforestation and LUC emissions decrease (SDGs 13 and 15) without negative effects on food prices (SDG 2). However, nitrogen losses and unsustainable water withdrawals remain at relatively high levels under increased agricultural productivity (figure 2(c)).
Combination of measures
Our analysis indicates that no single measure can alleviate the various adverse side-effects of large-scale bioenergy production simultaneously (figures 2 and 3). Moreover, in some cases the reduction of one externality involves trade-offs with other sustainability objectives (e.g. higher food prices under a forest protection scheme or higher LUC CO2 emissions under a water protection scheme). Combining all environmental protection (REDD, EffNfert, WaterProt) and land-sparing measures (IntensAg) considered in our study reduces environmental and social externalities of large-scale bioenergy production most comprehensively (Bio-All scenario). Global bioenergy crop area (513 Mha in 2100) as well as food crop area are comparable to results of the Bio-IntensAg scenario (figure 1). In addition, the REDD scheme prevents land expansion into forests and other natural lands. As a consequence, global LUC CO2 emissions are comparable to the NoBio scenario without 2nd generation bioenergy (figure 2(a)). Moreover, nitrogen losses are halved compared to the NoBio scenario (figure 2(b)), and water withdrawals do not exceed environmental flow requirements (figure 2(c)). At the same time food prices are not affected (same level as in NoBio) and bioenergy prices are similar to a scenario without complementary measures (Bio scenario) (figure 3). Hence, the combination of environmental protection and land-sparing measures investigated here avoids additional sustainability trade-offs (i.e. no additional conflict with SDGs 2, 7, 13, 14 and 15) under large-scale bioenergy production.
Our scenario analysis shows that a combination of several measures aimed at alleviating side-effect of large-scale bioenergy production(Bio-All) results in better overall indicator outcomes than single measures (e.g. Bio-REDD). Based on this result, one could draw the conclusion that more measures always result in better indicator outcomes. To test this hypothesis, we additionally run scenarios with all possible combinations of measures considered in our study, calculate normalized scores for each indicator across all scenarios and finally sort the scenarios based on the sum of indicator scores (see methods for details). It turns out that indeed a scenario with four measures (Bio-All) achieves the best overall indicator outcome (figure 4). But of the three scenarios with three measures only those two which include intensive agriculture (IntensAg) are the next best. The three measure scenario including only environmental protection measures (Bio-REDD-EffNfert-WaterProt) performs worse than two-measure scenarios combining environmental protection and intensive agriculture (e.g. Bio-REDD-IntensAg). Moreover, Bio-IntensAg is the best single measure scenario and performs better than any scenario with two environmental protection measures.

Figure 4. Additional scenarios with all possible combinations of measures considered in our study (see table 2). Results are shown for year 2100 at the global scale. To facilitate straightforward comparison of scenario outcomes across all indicators, we calculate for each indicator normalized scores ranging between 0 and 1. First we determine the worst (0) and the best outcome (1) for each indicator across all scenarios and then align all outcomes in-between accordingly. Finally, we sort the scenarios according to the sum of the six indicator scores (best scenario is on the right-hand side).
Download figure:
Standard image High-resolution imageTherefore, more measures do not in all cases increase overall sustainability indicator scores. Instead, the type and mixture of measures matters. Our results indicate that in particular agricultural intensification, which reduces the overall pressure in the agricultural system, is a robust strategy (standalone and in combination with other measures) to alleviate unwanted side-effects of large-scale bioenergy cultivation.
Importance of food demand
The indicator scores shown in figure 5 (see methods for calculation) for SSP2 food demand reflect the numerical results presented before. For instance, between Bio and Bio-REDD the scores for deforestation and LUC emissions increase (positive effect), while the score for the food price index decreases (negative effect).

Figure 5. Scenario results for SSP1, SSP2 and SSP5 food demand. To facilitate straightforward comparison of scenario outcomes across all indicators, we calculate for each indicator normalized scores ranging between 0 and 1. First we determine the worst (0) and the best outcome (1) for each indicator across time, scenarios and SSPs and then align all outcomes in-between accordingly.
Download figure:
Standard image High-resolution image
Under SSP2 food demand there is a general trend of decreasing indicator scores over time, i.e. side-effects increase with increasing bioenergy demand over time. Under SSP5 food demand we observe the same trend but with a stronger signal. In contrast, under SSP1 food demand there is a trend of increasing indicator scores between 2050 and 2100, i.e. side-effects decrease with increasing bioenergy demand over time. In particular, there are no trade-offs under SSP1 food demand between the six sustainability indicators for all measures (except for Bio-WaterProt). For instance, a forest protection scheme next to large-scale bioenergy production (Bio-REDD) under SSP1 food demand results in reduced deforestation and emissions from land-use change without negative effects on food prices.
These results can be explained by the difference in food demand trajectories between SSP1, SSP2 and SSP5. Our food demand trajectories are based on SSP population and income projections for the 21st century and additionally account for behavioral changes (e.g. reduced per-capita demand for livestock products in SSP1) (see SI for details). Total food demand increases in SSP2 and SSP5 throughout the 21st century, which increases the challenge within the agricultural system to accommodate large amounts of bioenergy production next to food production. In contrast, food demand decreases in SSP1 after 2050, which frees up resources for bioenergy crop cultivation.
Discussion
In this study, we carry out a multi-criteria sustainability assessment of large-scale bioenergy crop production (300 EJ in 2100) throughout the 21st century with and without accompanying measures using the global land-use optimization model MAgPIE.
Our analysis indicates that large-scale bioenergy production without complementary measures under SSP2 food demand results in negative effects on the following sustainability indicators: deforestation, LUC CO2 emissions, nitrogen losses, unsustainable water withdrawals and food prices. Moreover, our results for SSP2 food demand suggest that single-sector environmental protection measures, if implemented successfully at the global scale, can reduce specific unwanted side-effect of bioenergy production but might exacerbate other environmental or social externalities in some cases. For instance, if large-scale bioenergy production is accompanied by a global forest protection scheme (Bio-REDD), deforestation and LUC CO2 emissions (SDGs 13 and 15) decline substantially whereas food prices (SDG 2) increase. Another trade-off emerges if large-scale bioenergy production is accompanied by a global water protection scheme (Bio-WaterProt). In this case, reduced water use in agriculture (SDG 14) comes at the cost of increased deforestation and LUC CO2 emissions (SDGs 13 and 15). These findings are qualitatively in line with previous studies, which analyze side-effects of large-scale bioenergy production or the implications of environment protection measures next to large-scale bioenergy production [16, 18, 23, 24, 48].
In line with existing literature, our study shows that the trade-off between bioenergy crop area expansion and food prices depends on the underlying socio-economic development [49]. If food demand is decreasing after 2050, as is the case under SSP1 (sustainable development), the trade-off is rather small because bioenergy crops can be grown on cropland previously used for food crop production. In contrast, under SSP5 (fossil-fueled development), which entails higher demand for resource intensive livestock products, the trade-off between agricultural land expansion and associated LUC CO2 emissions, and food prices is even stronger compared to SSP2 (middle-of-the-road).
In addition to environmental protection measures, we also investigate the sustainability effects of agricultural intensification under large-scale bioenergy production. Our results indicate that agricultural intensification, which lowers the overall pressure in the agricultural system, reduces deforestation and LUC CO2 emissions (SDGs 13 and 15) substantially without food price (SDG 2) increases, hence avoiding additional trade-offs. This finding partly agrees with the current literature. A recently published study on sustainable development finds that yield increases are a robust strategy to keep food prices in check [23].
Finally, a combined setting of forest and water protection schemes, improved fertilization efficiency, and agricultural intensification next to large-scale bioenergy production performs best across all sustainability indicators. But our analysis also shows that more measures are not always better. In particular a combination of environmental protection measures is prone to have negative effects on food prices. In contrast, agricultural intensification emerges as robust strategy (standalone and in combination with other measures) to lower side-effects of large-scale bioenergy production without additional sustainability trade-offs—at least among those sustainability indicators we consider here.
The environmental and social benefits of the measures investigated here are much stronger in the absence of large-scale 2nd generation bioenergy production (supplementary figure S35). But the importance of these measures increases with demand for land, water and nutrients from land-based mitigation, such as large-scale bioenergy production, in addition to food demand.
Modelling large-scale bioenergy production
Bioenergy can be produced in many different ways, all of which are associated with different potentials and side-effects [24]. In this study, we focus on dedicated grassy and woody biomass as feedstock because of their high productivity and their importance in ambitious mitigation scenarios [24, 50].
We assume that bioenergy crop production competes with food/feed crop production for fertile land. If bioenergy crop production would be limited to degraded land, competition for land and associated side-effects would be lower [51]. However, the global potential of dedicated bioenergy crops grown on degraded land is far below the amount of bioenergy required in ambitious mitigation scenarios [51]. The same holds true for the bioenergy potential of crop residues, forestry residues and waste [52].
Moreover, we assume exogenous global 2nd generation bioenergy crop demand of 133 EJ yr−1 in 2050 and 300 EJ yr−1 in 2100, which is in line with the upper end of projections from IAMs for bioenergy deployment in 1.5 °C and 2 °C transformation pathways [1]. A bottom-up study based on net primary productivity (NPP) suggests an upper biophysical limit for primary bioenergy of about 190 EJ yr−1 in 2050 globally (assuming that bioenergy crops are grown outside existing croplands, infrastructure, wilderness and denser forests) [53]. If sustainability criteria are considered, the maximum global potential to grow dedicated bioenergy crops is estimated 133 EJ yr−1 in 2050 on average, based on three studies with completely different methods (intensification of grazing areas, constraints on land and water resources in a dynamic global vegetation model, study with an IAM considering constraints such as soil degradation and water scarcity) [52]. Thus, our assumptions on 2nd generation bioenergy crop production in 2050 do not conflict with biophysical limits from the literature but are at the upper end of bioenergy potential estimates considering sustainability criteria.
Our SSP2-based projections for global 2nd generation bioenergy crop area of 513–667 Mha in 2100 are well within the range of 195−1085 Mha (marker model estimate: 687 Mha) reported by an IAM intercomparison project for an SSP2 RCP 2.6 scenario (RCP 2.6 is consistent with a 2 °C transformation pathway) [42].
Scenario assumptions
In this study, we investigate four different measures in combination with large-scale bioenergy production, each focusing on different sustainability aspects (see table 2). The choice of these measures is based on the current literature discussing side-effects of large-scale bioenergy cultivation [16–19, 23]. All measures we analyze here build on previously published work with the MAgPIE model (see SI for details). Our scenarios with environmental protection measures can be considered as very optimistic worlds (REDD, EffNfert, WaterProt). These 'policy' scenarios are complemented by a scenario with business-as-usual assumptions for the respective domains (Bio scenario). Therefore, our scenario results reflect the range between business-as-usual and very optimistic development at the global scale. For instance, we assume either no protection of environmental flows (Bio scenario) or immediate global protection of environmental flows (Bio-WaterProt scenario). Similarly, we assume either no CO2 price (Bio scenario) or an immediate globally uniform CO2 price on emissions from deforestation (Bio-REDD scenario).
The real-world implementation of such ambitious environmental protection measures would require well-working governmental institutions at global scale. Therefore, more realistic scenarios would account for regional and temporal delay of implementation (e.g. no CO2 price in developing countries until 2030). However, our scenario design allows to estimate the order of magnitude of potential positive and negative effects associated with a particular measure.
Besides environmental protection measures, we also analyze a scenario with agricultural intensification (IntensAg). Our results indicate that agricultural intensification is a robust strategy (standalone and in combination with other measures) to lower side-effects of large-scale bioenergy production without additional sustainability trade-offs. But to achieve the productivity improvements assumed in our scenario, long-term investments in agricultural R&D would be needed. It is estimate that the average lag of positive effects owing to public investments in agricultural R&D is 15−25 years [54]. Therefore, to buffer potential negative consequences of future bioenergy production governments would need to invest in agricultural R&D already today.
Limitations of sustainability indicators
Our study illustrates the potential consequences of large-scale bioenergy production for a limited set of indicators. But large-scale bioenergy crop production may have other side-effects that are not considered in our study [55]. For instance, bioenergy production, especially if highly-intensified, may further increase phosphorus fertilizer use, thereby threatening rivers, lakes, and coastal oceans with eutrophication [56]. Further examples are impacts on biodiversity from LUC, increased energy requirements for the production of synthetic fertilizer and distributional issues arising from the concentration of profits from bioenergy production [24]. Accounting for such additional dimensions likely increases the number of sustainability trade-offs. Besides negative side effects, bioenergy production may also have some co-benefits not covered in this study. For instance, higher agricultural prices due to land competition may increase farm income [57]. Hence, bioenergy production may also create new income sources in rural areas.
In the following we discuss limitations of the sustainability indicators used in our study.
Deforestation and LUC CO2 emissions Our study does not include impacts of climate change on crop yields. If crop yields are affected by climate change, this may have repercussion on cropland expansion, and in consequence on deforestation and LUC CO2 emissions. The results of a multi-model climate change assessment for major crops indicate strong negative effects of climate change, especially at higher levels of warming and at low latitudes [58]. In our scenarios, we assume large-scale bioenergy deployment consistent with ambitious climate targets (i.e. consistent with low levels of global warming). Therefore, such impacts of climate change on crop yields likely play a minor role for our scenario results. Only for the reference scenario without bioenergy (NoBio) climate change impacts could be of higher importance. However, even in this case climate impacts are not necessarily higher if mitigation action in other sectors (e.g. energy system) is increased to compensate for missing bioenergy deployment.
Nitrogen losses In MAgPIE, nitrogen losses largely depend on organic and inorganic fertilizers as well as the soil nitrogen uptake efficiency, which is a scenario parameter (see methods and SI section 3.2). The endogenous calculation of nitrogen fertilization in MAgPIE partly accounts for interactions with crop irrigation, which reflects the result of field studies showing that successful yield improvements require the right mix of additional nitrogen fertilizer and additional water [59, 60]. If crops get irrigated in MAgPIE, their yields increase. In our approach, this also implies that farmers adapt their fertilization to this higher yield and increase the nitrogen inputs, resulting in higher nitrogen losses. However, higher nitrogen leaching losses in irrigated systems are not accounted for. Moreover, we assume that intensification of crop production is reached through improved nutrient management, i.e. crop yields increase without a negative impact on nitrogen uptake efficiency. Beyond, intensification can also be reached through applying more nutrients without improving the general management; this will lead to declining marginal returns to fertilization and a falling nitrogen uptake efficiency [61].
Water use above EF The indicator water use above EF depends on human and environmental water demand as well as available water (see methods). Agriculture accounts for about 70% of current human water withdrawals [62] and a considerable share of the water intended for irrigation is lost due to bad management, losses in the conveyance system, and inefficient application to the plant [63]. Therefore, improving irrigation efficiency is one of the main options to reduce human water consumption [64]. In our scenarios, we assume a global static value for irrigation efficiency of 66%. This value is the global weighted average of water losses from source to field (conveyance efficiency times management factor) from [65]. Irrigated area from [66] has been used as aggregation weight. We acknowledge that the assumption of static irrigation efficiency throughout the 21st century is rather on the pessimistic side. Sensitivity analysis in the SI (section 7, figure S36) shows how improvements of irrigation efficiency in the course of the 21st century affect our modelling results. If environmental flow protection is combined with increasing irrigation efficiency, the trade-off between land and water resource protection (Bio-WaterProt scenario) is strongly reduced because higher deforestation and CO2 emissions caused by environmental flow protection are partly buffered by improvements in irrigation efficiency.
Food price index and bioenergy prices The food price index as well as bioenergy prices are based on shadow prices derived from MAgPIE (see methods). Shadow prices are directly linked to the objective function of the model, which is minimization of total global production costs (see SI section 1.1). The model currently includes costs for labor, capital, fertilizer, technological change, intraregional transport, land conversion and CO2 emissions, which implies that only these costs are reflected in shadow prices. Important cost types not included in the model are for instance transaction costs associated with the implementation of environmental protection measures such as forest or water protection schemes. In the case of improved fertilization techniques, however, one could argue that the costs for adopting improved fertilization techniques are offset by the cost savings due to reduced fertilizer requirements.
Conclusion
Our study highlights the challenging task of aligning large-scale bioenergy crop production with the global SDG agenda. In line with previous studies, our analysis indicates that large-scale bioenergy production without complementary measures results in negative effects on the following sustainability indicators: deforestation, LUC CO2 emissions, nitrogen losses, unsustainable water withdrawals and food prices. One of our main findings is that single-sector environmental protection measures next to large-scale bioenergy production are prone to involve trade-offs with other sustainability objectives—at least in the absence of more efficient land or water resource use. For instance, our results indicate that a global forest protection scheme next to large-scale bioenergy production would substantially lower deforestation and LUC emissions (SDGs 13 and 15) at the cost of higher food prices (SDG 2). However, our study also shows that the existence and magnitude of this trade-off strongly depends on the development of future food demand, which is subject to population and income dynamics as well as dietary changes. In contrast to environmental protection measures, agricultural intensification emerges as a robust strategy (standalone and in combination with other measures) to lower side effects of large-scale bioenergy production without new trade-offs between the 6 sustainability indicators considered in our study. Finally, our results indicate that a combination of forest and water protection schemes, improved fertilization efficiency, and agricultural intensification would reduce side-effects of large-scale bioenergy production most comprehensively. However, our analysis also shows that more measures next to large-scale bioenergy production do not in all cases improve overall sustainability.
Our multi-criteria assessment includes a broader set of sustainability indicators than previous studies on bioenergy side-effects and their regulation. But still our study covers only a small subset of all indicators relevant for the SDG agenda. Thus, beyond the trade-offs discussed here, there are potential trade-offs with other sustainability dimensions not accounted for in our study. For instance, large-scale bioenergy crop production may have negative impacts on biodiversity as a consequence of cropland expansion or may threaten water bodies with eutrophication due to increased phosphorus fertilizer use [24, 56]. Based on that we argue that the development of policies for regulating externalities of large-scale bioenergy production should be more comprehensive. For instance, policy proposals for reducing a particular externality of large-scale bioenergy production should be subject to broad sustainability assessments to first of all discover potential trade-offs with other sustainability objectives and secondly revise policy proposals (if needed) for consistency with the SDG agenda.
Acknowledgments
The research for this article has been supported by German federal funds from the Umweltforschungsplan by Umweltbundesamt (FKZ UBA-3714 41 1670), the European Union's Horizon 2020 research and innovation programme under grant agreement No 689150 (SIM4NEXUS) and the European Union's Seventh Framework Programme under grant agreement No 603542 (LUC4C). The publication of this article was partially funded by the Open Access Fund of the Leibniz Association.