

Abstract
Over the past three decades, farmers in China have increasingly used fertilizers to increase paddy rice production. While this approach has eased the rising demand for food, it is unclear whether it pays off in the long-run when costs associated with environmental consequences are considered. Using two case studies in Zhejiang Province, China, this paper analyzed field-based rice yields, fertilizer inputs, nitrogen leaching and greenhouse emissions and their socioeconomic values of different farm practices. The objective was to assess the trade-offs among economic gains from increased yield and environmental consequences of different paddy rice management practices. The results indicated short-term economic gains to farmers outweigh the environmental cost concerns. However, considering the lasting environmental effects, there is a significant imbalance toward a conservative farming practice. The results further indicated that synergies can be achieved if precision management practices are adopted. It was also indicated that a large spatial variation exists in yields and environmental impacts, suggesting 'one-size fits all' policies will likely be ineffective in reducing environmental impacts. Although only two case studies were demonstrated in this study, the approach may be generalized to other geographic regions to help guide paddy farmers in similar climatic and land use environments such as those in the subtropical regions of Southeast Asia, to achieve synergic environment practices.
Export citation and abstract BibTeX RIS

Original content from this work may be used under the terms of the Creative Commons Attribution 3.0 licence.
Any further distribution of this work must maintain attribution to the author(s) and the title of the work, journal citation and DOI.
1. Introduction
Rice, Oryza sativa, which was first grown in Yangtze River valley of China (Vaughan et al 2008), has been the staple food in many East and Southeast Asian countries for centuries. In Asia, rice consumption exceeds 100 kg cap−1 yr−1 (Zeigler and Barclay 2008). Major types of rice grown in the region include paddy rice, lowland, and upland rice, among which paddy rice is the dominant one, occupying approximately 93%. Of these paddy farms, 40% of them are irrigated or flooded (Defeng 2000, Yunus et al 2013).
Increasing paddy rice production has been the main strategy to ensure food security in China over the past few decades, in the face of reduced arable land resulting from urban development. The readily available chemical fertilizer and the incentives to increase paddy rice yields led to excessive fertilizer application in many paddy fields. This may cause an increase in greenhouse gas (GHG) emissions, particularly CH4 (methane) and N2O (nitrous oxide) from paddy rice fields, which further escalates climate change. In addition to GHG emissions, paddy rice farming can also result in nitrogen (N) leaching (Yang et al 2013, Tian et al 2007) to rivers and streams, lakes and oceans that can cause eutrophication and algal blooms or red tides in the coastal waters (Smith et al 2006, Howarth et al 2011, Mclellan et al 2015).
Policies on nitrogen leaching and greenhouse gas emissions from paddy farms have been reported in the past (e.g. Ju et al 2004, 2009). However, these policies should not jeopardize food security, because rice is stable food and tightly associated with socioeconomic stability in many communities in the region (Zeigler and Barclay 2008). Take Zhejiang Province as an example: rice farming contributes around 80% of grain production in this province (Zhu et al 2007). Therefore, maintaining and increasing rice yield is an important food security strategy to support the increasing population in developing countries like China and India (Cheng et al 2007).
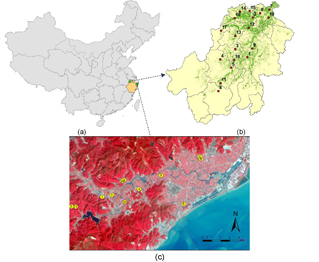
Figure 1. Location of (a) Zhejiang Province, (b) surveyed villages in Anji County overlaid with paddy rice fields derived from Landsat 5 images, and (c) field sites in Dasong River watershed.
Download figure:
Standard image High-resolution image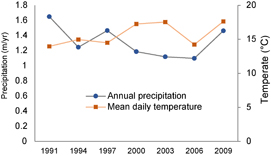
Figure 2. Mean daily temperature (°C) and mean annual precipitation (m yr−1) for Anji County from 1991 to 2009.
Download figure:
Standard image High-resolution imageFurther, previous researchers have proposed various knowledge-based 'optimal N fertilization' applications (Ju et al 2009, Deng et al 2012, Qiao et al 2012, Zhang et al 2014, Zhong et al 2016). However, policies to promote 'optimal N rate' or set 'N input' limit may lead to an oversimplification of the challenges in reducing environmental consequences from paddy rice fields. Studies generally agree that current nitrogen (N) fertilization is far more than what is needed, but 'optimal' N application rates vary considerably from field to field, from year to year, even within a small geographic region.
Many studies on 'optimal' paddy rice management relied on in-situ observations from limited study sites. Scaling up site-specific findings to regional or even national level is likely problematic because spatial variations in soil and management practices will result in significant variations in rice yields, N leaching and GHG emissions (Zhao et al 2015, Liu et al 2014, Ye et al 2007, Inamura et al 2004), thus requiring spatially different 'optimal N' recommendations. Thus, one-size-fits-all policies may lead to over or under fertilizer applications.
Previous studies mostly focused on the impacts of either varying soil properties or farm management on rice production, but few considered both of them. A better understanding of the trade-offs between paddy rice production and environmental consequences under varying soil, management and climate conditions is needed to guide future environmental policies on fertilizer regulations.
Specifically considering spatial variability in soil, climate and farming practices, this study presented a fine-scale analysis of the trade-offs between paddy rice production, GHG emissions and N leaching using two case studies in Zhejiang Province, China. The first case study demonstrated how changes in farm practice and climate between 1991 and 2009 affected rice production and nutrient loss at the village level. The second case study explored responses of rice yield and GHG emission to alternative management scenarios under varying soil conditions. In both cases, a biogeochemical model—the DeNitrification-DeComposition (DNDC) (Li et al 1992, 1994) was used to simulate paddy rice production and environmental consequences, specifically considering farm management practices, soil and climate heterogeneity. The overall objective is to assess tradeoffs among environmental impacts and yield potentials of different management scenarios, with an emphasis on spatial heterogeneity dependency and one-size-fits-all policy implications.
2. Data and methods
2.1. Study area
Zhejiang Province in the Yangtze River Delta is one of the most densely populated and rice-dominant agricultural regions in China (figure 1(a)). With limited arable land and increased competition for land from urban development, maintaining agricultural food production and ensuring environmental quality is an increasing challenge. Nonpoint source pollution from agricultural fields is blamed for frequent algal bloom and water pollutions in the region but solutions are lacking and policies are ineffective.
Table 1. Farmland statistics in Anji County.
| Year | Farmland | Paddy field (based on images) | Percentage (paddy field/farmland) |
|---|---|---|---|
| 1991 | 220 km2 | 199 km2 | 90.4 |
| 1994 | 208 km2 | 194 km2 | 91.3 |
| 2001 | 210 km2 | 193 km2 | 91.9 |
Two case study areas—Anji County (30.6391°N, 119.4842°E) and Dasong River watershed (30.6391°N, 119.4842°E) in the province (figures 1(b) and (c)) were selected, based on two previous studies (Xu 2011, Wang et al 2017). Anji and Dasong cover 1886 km2 and 108.76 km2, respectively. Anji County is within the Tiaoxi River watershed that drains into Taihu Lake, one of the most algal bloom prone inland lakes in China. It was estimated that about 30%–40% of riverine N sources were discharged from paddy fields (Tian et al 2012, Ye et al 2017), Similarly, the Dasong River watershed (108.76 km2) was blamed for frequent eutrophication of the Xiangshan Bay of China's east coast. Land use in this region is diverse, but rice farming may have contributed more than 25% of N discharged to rivers in the area (Nobre et al 2010).
2.2. Data collection
2.2.1. Anji county data
Climate data were downloaded from the China Climate Data Portal (http://data.cma.cn) and soil data were provided by Zhejiang University at 1: 2 500 000 scale. Between 1991 and 2009, mean daily temperature ranged from 14 °C to 18 °C and mean annual precipitation ranged from 1027 mm yr−1 to 1650 mm yr−1 (figure 2). Locations and area of paddy rice fields were derived from three Landsat 5 TM images covering this county, acquired in 1991, 1994 and 2001 respectively. Reported total area of farmland in Anji County (Li and Yang 2007) was used for validation purpose (table 1). The 2001 Landsat 5 image was selected to determine the location of paddy rice fields in this county because there was little change in cropland area between 1991 and 2001. The land use at the village level was intersected with the soil map to obtain areal-weighted soil properties for each village.
Farm management information was collected through surveys and interviews with local farmers. For each village, a group discussion was held that involved 1–2 local government officials, 1–2 fertilizer retailers and 4–6 farmer representatives. Fertilizer use information was collected for 1991, 1995, 2000, 2005 and 2009 (table 2), including manure and N input, historical rice yields, planting and harvest dates, inundation dates (start and end dates), weeding and residue management. The fraction of crop residues returned to field increased from 10%–100% around 2005 for nearly all villages but three (70% for Chengbei 1 and 2, and 10% for Laoshikan village). The soil was loam with moderate acidity (table 2). Flooding depth is about 8–10 cm in all villages.
Typical crop rotation in Anji County is single rice followed by wheat or rapeseed. Rice fields were flooded continuously with one or multiple midseason drainage (table 2). Among the 18 villages surveyed, about half of them use direct-seeded and the rest used transplant rice seedlings.
Table 2. Soil and farm management information of the surveyed villages in Anji County.
| No | Village | Plant–harvest (M/D) | Flooding (M/D) | SOC | pH | Bulk density (g cm−3) | Clay fraction (%) | Soil texture |
|---|---|---|---|---|---|---|---|---|
| #1 | Shuanghe | 5/10–10/20 | 6/1–8/7 | 13.31 | 6 | 1.46 | 17.46 | loam |
| 8/23–9/15 | ||||||||
| #2 | Guwan | 6/15–9/20 | 6/25–7/28 | 18.14 | 6 | 1.36 | 19.94 | loam |
| 8/14–9/10 | ||||||||
| #3 | Wunikeng | 5/20–10/7 | 5/31–6/20 | 12.21 | 5.2 | 1.42 | 31.94 | clay loam |
| 7/5–8/15 | ||||||||
| #4 | Chengbei 1 | 6/20–10/10 | 5/20–8/10 | 17.85 | 5.8 | 1.37 | 26.12 | loam |
| 8/17–8/30 | ||||||||
| #5 | Chengbei 2 | 6/5–10/20 | 6/23–8/9 | 17.1 | 6 | 1.37 | 20.3 | silt loam |
| 8/18–9/5 | ||||||||
| #6 | Sunjia | 6/1–10/10 | 5/20–7/24 | 13.49 | 5.5 | 1.44 | 19 | loam |
| 8/6–9/20 | ||||||||
| #7 | Zhangzhi | 5/15–10/7 | 5/5–9/20 | 13.31 | 6 | 1.46 | 17.46 | loam |
| with three drainsb | ||||||||
| #8 | Baofu | 5/20–10/10 | 5/5–9/5 | 15.21 | 5.2 | 1.42 | 31.94 | clay loam |
| with three drainsb | ||||||||
| #9 | Lijiashang | 5/15–10/10 | 5/5–9/4 | 7.3 | 6 | 1.55 | 14.22 | silt loam |
| with seven drainsa | ||||||||
| #10 | Meixi | 6/10–9/30 | 6/25–8/20 | 13.31 | 6 | 1.46 | 17.46 | loam |
| 8/30–9/10 | ||||||||
| #11 | Laoshikan | 6/10–10/30 | 5/20–10/15 | 17.62 | 6 | 1.42 | 16.83 | loam |
| with three drainsb | ||||||||
| #12 | Xiaoyun | 6/20–9/20 | 6/15–8/20 | 16.8 | 6 | 1.39 | 20.62 | loam |
| with five drainsa | ||||||||
| #13 | Liang | 5/10–10/5 | 5/20–9/15 | 13.31 | 6 | 1.46 | 17.46 | loam |
| with three drainsb | ||||||||
| #14 | Heping | 5/15–10/20 | 5/30–8/9 | 7.15 | 5.2 | 1.52 | 24.63 | loam |
| 8/21–9/15 | ||||||||
| #15 | Sizhuang | 5/10–9/30 | 5/25—7/25 | 19.83 | 5.4 | 1.41 | 20.86 | loam |
| 8/10–9/20 | ||||||||
| #16 | Zhuangshan | 5/5–10/20 | 5/25–7/24 | 16.69 | 6 | 1.39 | 22.52 | loam |
| 8/6–10/5 | ||||||||
| #17 | Xiachengba | 5/1–10/10 | 5/15–6/24 | 17.62 | 6 | 1.42 | 16.83 | loam |
| 7/1–9/20 | ||||||||
| #18 | Heluxi | 5/10–10/5 | 5/25–7/24 | 13.31 | 6 | 1.46 | 17.46 | loam |
| 8/6–9/25 |
aeach mid-season drainage lasts about 3–5 days. beach mid-season drainage lasts about 7–14 days.
Table 3. Soil properties of sampled paddy rice fields in Dasong river watershed.
| No. | Site Village | Soil pH | SOC (g kg−1) | Bulk density (g cm−3) | Clay fraction | Soil texture |
|---|---|---|---|---|---|---|
| #1 | Dai | 4.65 | 21.82 | 1.13 | 0.16 | loam |
| #2 | Huashan | 4.79 | 28.88 | 1.16 | 0.17 | silty loam |
| #3 | Fangqiao | 6.61 | 11.00 | 1.49 | 0.27 | silty clay loam |
| #4 | Guanshan | 5.94 | 26.86 | 1.18 | 0.29 | silty clay loam |
| #5 | Guanjiang | 5.02 | 27.20 | 1.08 | 0.24 | silty loam |
| #6 | Henshan | 6.5 | 29.54 | 1.18 | 0.29 | silty clay loam |
| #7 | Xitou | 5.19 | 24.14 | 0.98 | 0.15 | sandy loam |
| #8 | Tangjia 1 | 6.21 | 21.29 | 1.19 | 0.33 | silty clay loam |
| #9 | Tangjia 2 | 7.28 | 15.89 | 1.38 | 0.26 | silty loam |
| #10 | Xichen | 7.22 | 18.70 | 1.09 | 0.26 | silty loam |
| #11 | Xianyi | 7.03 | 17.02 | 1.14 | 0.35 | silty clay loam |
| #12 | Zhouxi | 4.9 | 21.14 | 1.05 | 0.26 | silty loam |
2.2.2. Dasong river watershed data
The soil information was collected from a total of 12 randomly selected paddy rice plots (figure 1(c)), each being about 0.3 hectare. Field soil samples were collected before growing season and analyzed in labs to obtain soil properties (table 3). The soil texture information was determined using the classical sieve and pipette method (SPM). Soil organic content (SOC) was determined from the Walkley-Black method. The soil pH properties were measured potentiometrically and the bulk density was measured by cutting ring method. Soil textures were mostly silty clay loam or silt loam soil. As indicated by the pH values, most soils are acid in the study sites. A substantial variation in SOC (11–29.54 g kg−1) among sampled fields, along with other soil properties, suggests different cropping histories and land management practices.
Table 4. Farm management information of sampled rice fields in Dasong River watershed.
| Number | Sites | Plant-Harvest (M/D) | Flooding | Flooding depth | Fertilization (kg N ha−1) | Straw residue |
|---|---|---|---|---|---|---|
| #1 | Dai village | 6/30–12/23 | 6/30—7/7 7/10—10/21 | 10 cm | Compound: 67.5 Urea: 187.5 | 10% |
| #2 | Huashan village | 5/30–11/02 | 5/30—6/30 7/10—11/2 | 3 cm | Compound: 67.5 Urea: 168.75 | 10% |
| #3 | Fangqiao village | 6/10–11/10 | 5/20—6/20 7/10—9/5 | 8 cm | Compound: 67.5 Urea: 120 | 10% |
| #4 | Guanshan village | 5/25–11/15 | 5/25—6/25 7/25—8/25 | 4 cm | Compound: 108 Urea: 300 | 20% |
| #5 | Guanjiang village | 6/20–11/28 | 6/20—7/30 8/30—11/20 | 5 cm | Compound: 40.5 Urea: 7.5 | 40% |
| #6 | Henshan village | 5/12–10/25 | 6/30—7/7 7/10—10/21 | 15 cm | Compound: 81 Urea: 75 | 20% |
| #7 | Xitou village | 6/20–10/15 | 6/5—7/20 8/20—9/30 | 8 cm | Compound: 67.5 Urea: 37.5 | 30% |
| #8 | Tangjia village1 | 5/25–10/15 | 5/20—6/20 7/10—10/20 | 3 cm | Compound: 81 Urea: 300 | 10% |
| #9 | Tangjia village2 | 5/25–10/15 | 5/20—6/20 7/10—10/20 | 3 cm | Compound: 81 Urea: 300 | 10% |
| #10 | Xichen village | 6/20–11/05 | 6/30—7/7 7/10—10/21 | 10 cm | Compound: 67.5 Urea: 75 | 10% |
| #11 | Xianyi village | 5/20–11/05 | 5/20—6/20 7/10—10/25 | 2 cm | Compound: 54 Urea: 90 | 10% |
| #12 | Zhouxi village | 6/25–11/20 | 6/25—7/25 8/1—9/20 | 4 cm | Compound: 54 Urea: 45 | 30% |
The climate data, including daily precipitation and temperature data for the watershed were downloaded from China Climate Data Portal (www.chinaccdp.org/). Farm management information (table 4) was obtained through interviews with local farmers who either owned or leased those paddy fields. Single rice and one-time midseason drainage were prevalent throughout the Dasong River watershed (table 4). Unlike those in Anji County, farmers in Dasong river watershed did not grow a second crop after the first harvest, and all paddy fields in this area were seedling-transplanted paddies.
2.3. Paddy rice modeling
The process-based DeNitrification-DeComposition (DNDC) model (Li et al 1992, 1994) was initially developed to simulate the dynamic interactions among different C and N pools in the soil and plant (Li et al 2001, Zhang et al 2002) and subsequently has been calibrated and validated over the past twenty years including those by the model developer (e.g. Li et al 2001, Zhang et al 2010, Deng et al 2011). The model has four primary components: climate, soil, vegetation, and management practices to govern the biogeochemical processes that determine crop yield, GHG emissions, and nitrogen leaching. With different management options, soil condition and plant information as inputs, the DNDC model was used to simulate environmental consequences and rice yield potentials.
2.4. Experimental design and model simulations
The DNDC model was first calibrated by comparing simulated yields to reported yields from the case study areas and comparing simulated fluxes against published values (figure 3). Once calibrated, the model was used to simulate paddy rice yield, GHG emissions and N leaching for the subsequent trade-offs analyses among different management options. The model was run based on single rice rotation without considering wheat or rapeseed as the second cropping. Information on direct-seeded versus seeding-transplanting methods were not explicitly simulated.
2.4.1. Village level simulation
The calibrated DNDC model was run to simulate nitrogen loss ratio (NLR) pattern at the village level for Anji County, where NLR was defined as the ratio of nitrogen leached, including N runoff, to total N input:

Two simulations were made to discern the effects of climate variation and farm management practices:
- 1.Historical climate scenario: simulation with historical (1991 to 2009) climate data and surveyed farm management information for five times from 1991 to 2009. Given that continuous management data was not available, the simulation period was divided into five groups, each representing the closest date when management data were surveyed (see table 5).
- 2.2005 climate scenario: simulation with the historical management data, but climate data was fixed to 2005 condition.

Figure 3. Model validation of (a) rice yields, (b) CH4 emission, (c) N2O emission and (d) N loss (runoff plus leaching) against observed or reported values in Zhejiang Province and Taihu Lake region. Data on annual rice yields (means with standard errors) were based on the village level and the field level values from Anji county and Dasong river watershed, respectively. For nutrient fluxes, only annual mean values were presented. Observed data on CH4 (Wang et al 1990, 2001, 1994, Huang et al 2004, Zheng et al 2011, Zhong et al 2016, Sun et al 2016, Yao et al 2012), N2O (Zou et al 2009, Liang et al 2013, Zhong et al 2016, Zhang et al 2009, Zou et al 2007, Yao et al 2012, Hou et al 2016) and N loss via leaching and runoff (Wang et al 1996, Fang et al 2005, Liang et al 2007, Jiao et al 2007, Tian et al 2007, Zhao et al 2012, 2015, Yang et al 2013, Xue et al 2014) from paddy fields in Zhejiang province and Taihu Lake region were compiled from the literature.
Download figure:
Standard image High-resolution imageTable 5. Experimental design for paddy rice farming simulations in Anji County.
| Group ID | Year of survey data | Group of simulation years | Climate for historical and scenarios | Climate for 2005 scenario |
|---|---|---|---|---|
| 1 | 1991 | 1991 to 1993 | 1991 to 1993 | |
| 2 | 1995 | 1994 to 1997 | 1994 to 1997 | |
| 3 | 2000 | 1998 to 2002 | 1998 to 2002 | 2005 |
| 4 | 2005 | 2003 to 2007 | 2003 to 2007 | |
| 5 | 2009 | 2008 to 2009 | 2008 to 2009 |
2.4.2. Field level simulation
The DNDC model was run with current climate and different managements using field level soil information and climate data of 2014 for Dasong River watershed to assess the sensitivity of rice yield and GHG to three alternative management scenarios:
- Varying N fertilizer input from 0–150 kg N ha−1.
- Varying flooding duration from 50 to 120 d.
- Varying rice straw return from 10%–60%.
2.5. Model validation
The differences between simulated and observed yields were less than 5% at the county level for Anji and less than 2% at the field level for Dasong river watershed (figure 3(a)). GHG emission and N leaching data published in the literature were compiled and subsequently used to validate the reliability of the DNDC model (figures 3(b)–(d)). At the county level, simulated mean CH4 and N2O emission, and N leaching ranged from 175 to 300 kg CH4-C ha yr−1, 2 to 5.4 kg N2O-N ha yr−1, and 32–54 kg N ha yr−1. For reference purpose, the observed values in northern Zhejiang and Taihu Lake areas are 14–571 CH4-C ha yr−1, 0.1–15.3 N2O-N ha yr−1 and 8.5–61.1 kg N ha yr−1, respectively (figures 3(b)–(d)), suggesting that the simulated values in this study are well within the range of observed values in the region. At the field level, simulated CH4 ranged from 7–320 kg CH4-C ha yr−1 and N2O from 0.4 to 1.4 kg N2O-N ha yr−1 in 2014 in Dasong River watershed. The results indicate that model simulated fluxes were similar to observed values in the region (figures 3(b)–(c)), suggesting the validity of the model for this region.
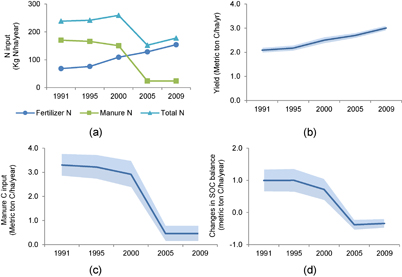
Figure 4. Changes in annual (a) nitrogen inputs, (b) reported rice yields (means with 95% confidence intervals (CIs)), (c) manure carbon inputs (means with 95% CIs) and changes in SOC balance (means with 95% CIs) for Anji County between 1991 and 2009. Notice that positive values in panel d suggest increases in the SOC stock whereas negative values mean depletion of the SOC stock.
Download figure:
Standard image High-resolution image3. Results and discussion
The results suggest that variations in climate and farm management practices in Anji County had significant impacts on rice yield and environmental consequences, with substantial spatial variations among paddy fields. For Dasong River watershed, it was found that the relationship between rice yields and GHG emissions was very sensitive to soil conditions and farm management options, and there seemed to have been plenty of room for N use efficiency improvements.
3.1. Fertilization and nutrient loss
Fertilizer and yields trade-offs: The total N input for surveyed villages in Anji County remained around 250 kg N ha−1, but reduced to less 200 kg N ha−1 after 2000. However, chemical N fertilizer input (urea plus compound fertilizer) increased quickly since 1995 (figure 4(a)). While manure was the main source for N input in 1990s, chemical N fertilizer has replaced manure as the main fertilizer input since the early 2000s (figure 4(a)) as the number of villages using manure as fertilizers reduced from thirteen (13) in 1990 to four (4) in 2009. This is because chemical fertilizer, when compared to manure, is readily available for applications and far more convenient to handle, thus less labor intensive. Labor saving has been overlooked in the past as a driver for increased chemical fertilizer uses; however, as China's economy continues to grow, migration of rural young population to urban cities, leaving seniors behind in the farm fields (Chang et al 2011). The choice between manure and chemical fertilizer is thus an easy one, when labor is considered.
From the economic perspective, fertilizer prices have been kept quite low for the past two decades (1990s–2010s) due to regulation and state subsidies to the fertilizer production industry (Li et al 2014). Subsidized fertilizer price, in turn, incentivized the widespread of excessive N fertilizer uses across China (Li et al 2013). Replacing manure with chemical N fertilizer increased rice yields (figure 4(b)), but also reduced the amount of organic matter returned to soils (figure 4(c)), which led to a decrease in soil organic carbon (SOC) after 2000 (figure 4(d)).

Figure 5. Simulated changes in annual methane (CH4) emission (means with 95% confidence intervals) under (a) observed historical climate (1991–2009) and (b) using 2005 climate data only scenario in surveyed villages in Anji County.
Download figure:
Standard image High-resolution image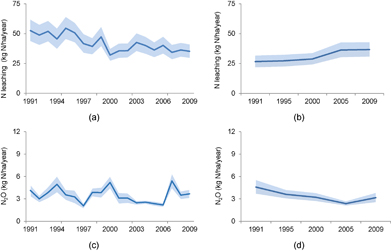
Figure 6. Simulated N leaching and N2O from rice fields (means with 95% confidence intervals). (a) N leaching under 1991–2009 climate. (b) N leaching under 2005 climate. (c) N2O emission under 1991–2009 climate. (d) N2O emission under 2005 climate.
Download figure:
Standard image High-resolution imageEnvironmental trade-offs: Temporal changes in temperature and precipitation (figure 2) seem to have stronger impacts on methane emission and nitrogen loss from paddy rice fields. The average CH4 emissions increased significantly from 1991 (~200 Kg C ha yr−1) to 2009 (~300 kg C ha yr−1) (figure 5(a)). One might speculate that increased N fertilizer applications promoted CH4 emission. However, previous studies found N application may promote or inhibit CH4 emission, depending on local soil texture and/or climate conditions (Cheng-Fang et al 2012, Xie et al 2010). In fact, simulation under the 2005 climate scenario (figure 5(b)) suggests that CH4 emission would only increase marginally (11%) if climate variation were not considered. In Anji county, the elevated temperature during the 1991–2009 period (figure 2(a)) may explain the increase in CH4 emission because higher soil temperature could potentially enhance methanogenic activity and therefore higher bio-methane production (Allen et al 2003, Sun et al 2016, Tian et al 2015). Recently, a field experiment in the region also confirms the relationship (Sun et al 2016).
Comparison of simulated N loss pattern under historical and 2005 climate scenario indicates that changes in N leaching and N2O emission over past two decades were more strongly influenced by precipitation variation than the N rates. For instance, the amount of average N leached from paddy fields decreased from 52.5 to 35.2 kg N/ha yr−1, or a 33% reduction, between 1991 and 2009 (figure 6(a)). However, when precipitation pattern holds constant at 2005 level, N leaching increased by 37.8% (figure 6(b)). This was likely caused by increased N fertilizer applications and reduced manure input because N fertilizers are much easier to be leached (Fan et al 2017). Similarly, N2O emission fluctuates between 1991 and 2009 without a clear increasing or decreasing trend (figure 6(c)). However, a clear decreasing trend in N2O emission can be observed when 2005 precipitation is used throughout the simulation period (figure 6(d)). The reduction in N2O emission under 2005 climate condition is primarily caused by the elimination of manure fertilizer: several field studies found that application of manure could result in higher N2O emission compared to chemical fertilizer (Akiyama and Tsuruta 2003, Zou et al 2006, Jin et al 2010). The contrasting results under historical and 2005 climate data scenarios clearly demonstrated the importance of taking climate variation into GHG mitigation plans.
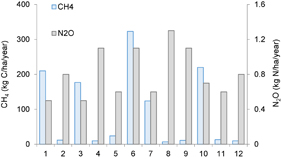
Figure 7. Average emission rates of CH4 and N2O in the sampled rice fields in Dasong River watershed. The graph was generated based on original data from Wang et al (2017).
Download figure:
Standard image High-resolution imageFertilizer use efficiency: Between 1991 and 2009, the fertilizer use efficiency indicator, NLR values, have decreased for most villages, but substantial spatial variation existed within the county. Village level NLR between 1991 and 2009 ranged from 0.01 to 0.48 (mean = 0.19, SD = 0.15) and 0.03 to 0.37 (mean = 0.15, SD = 0.11) respectively. Improvement in NLR is most evident between 1991 and 2000, with mean NLR values decreased from 0.19 to 0.12, which is consistent with the decreasing trend in N leaching. After that, NLR rose again by 0.01 to 0.2 (mean = 0.06) for many villages, although still lower than those in the 1990s. The rebound of NLR signaled that further increasing N rates without better nutrient management would lead to lower N use efficiency. In fact, there is about a 20% gap between crop N demand and crop N uptake in 2009 (results not presented), even though N fertilizer input has increased more than 50% since 2005. This suggests there is plenty of room to improve fertilizer use efficiency and farm management practices.
3.2. Management impacts on N and GHG emissions
Simulated results suggest that current rice management practices are far from being optimal and there is plenty of room to reduce GHG emissions without jeopardizing rice yields. However, the most effective management options for N2O and CH4 are quite different, depending on field soil conditions. There is a large spatial variation in CH4 and N2O fluxes (figure 7) among paddy fields, suggesting that both management practices and soil conditions are affecting CH4 and N2O emissions.
The N2O emissions were particularly sensitive to the soil pH and SOC conditions. Soils with a higher SOC content tend to release more N2O (figure 7) because soil organic matter provides source materials to soil microbial activities. Soils with a pH value between 6–8 tend to release more N2O because denitrification bacteria are more active within this range (Saleh-Lakha et al 2009). Low pH (4.65) at site #1 and low SOC (11.0 g kg−1) at site #3 explain why N2O emissions are lowest among all sites (figure 7), even though N application rates in these two fields are relatively high.
Simulations with varying N input confirmed that N was overused in these fields. Annual N fertilizer input (urea plus compound fertilizer) for the 12 fields in Dasong river watershed averaged at 212 ± 121.5 kg N/ha. This input level generally exceeds crop N demand in this watershed. There seems to be a tipping point in nitrogen fertilizer applications at 37.5 kg N ha−1, at which rate both yields can be maintained while N2O emission was kept minimal (figure 8).
Field flooding is another important factor in GHG emissions. Simulated results showed that CH4 emission is positively correlated to flooding period (figure 9) and flood depth (results not presented) because the anaerobic environment under flooding condition is more suitable for the methanogenic activity. Given that extended flooding duration does not help with increasing rice yields, it is reasonable to keep flooding days to about 70–80 d and low drainage rice strains so that the CH4 emission from paddy fields can be substantially reduced (figure 9). In addition, results suggest that flooding depth would greatly affect CH4 emissions. Among the 12 paddy fields, half of them presented a CH4 rate lower than 15 kg ha yr−1. This is largely because flooding depths in these fields (2–4 cm) are much lower than in other fields (8–15 cm) (table 4). Previous studies also found water-saving irrigations could reduce CH4 emission by more than 80%, when compared with traditional irrigation practices (Xu et al 2015, Hou et al 2016). Still, field based measurements is needed for future validation to understand the unusual low CH4 rate (7 kg C ha yr−1).
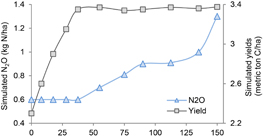
Figure 8. Impacts of N fertilizer application on N2O emission and rice yield. The graph was generated based on original data from Wang et al (2017).
Download figure:
Standard image High-resolution image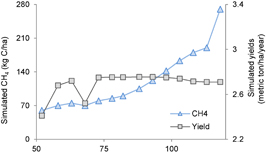
Figure 9. Impacts of flooding days on CH4 emission and rice yields. The graph was generated based on original data from Wang et al (2017).
Download figure:
Standard image High-resolution image
3.3. Opportunities and challenges for policy interventions
Survey results indicate that farmers in Anji County tend to increase paddy rice yield (thus thus income) by growing a second crop after rice harvest, while those in Dasong River watershed simply applied more fertilizers to maintain yields. If the increasing trend of N fertilizer input continues, most farmers in the region would apply more fertilizers than needed, more than 200 kg N ha yr−1. There have been some studies to suggest policy interventions, including eliminating fertilizer subsidies (Kahrl et al 2010) and imposing a fertilizer tax (Liu and Luan 2012). However, these suggestions are unlikely to be politically acceptable because increasing farmer's income (yields) is also a priority for the central government. 'Optimal N rate' is another popular policy suggestion, but the two case studies clearly demonstrated that substantial spatial-temporal variation exist at both the village and field levels, suggesting 'one-size fits all' policies will not achieve desired GHG emission reduction goal without sacrificing farmer's benefits.
At the field level, more 'smart' or adaptive fertilizer management strategies, such as the '4R' technique (Bruulsema et al 2009), which refers to applying right formulation at the right time and right rates in the right locations, are needed to synergize rice production and environment conservation. However, application of '4R' technique for small farms can be more challenging than adopting 'optimal N rate', as it requires more efforts for training and capacity building. Currently, farmers typically over-apply fertilizers as an 'insurance' or receive blanket fertilizer recommendations from local extension services, but studies in Zhejiang Province suggested that farmers are quite interested in techniques like '4R' because they enable increase in yields at lower fertilizer inputs (Wang et al 2003, Fang et al 2005). While profits are likely the main motivation for farmers to adopt new technologies, saving the environment has started to motivate farmers to take actions to reduce N inputs. Widespread of these technologies, however, would be constrained by accessibility of technical support. One possible solution is to provide real-time simulation results to farmers via smartphones or computers to allow direct access to the information needed for optimal N input. This is possible by coupling detailed database (e.g. local soil) with online information delivery, but more government support would be needed to build the capacity.
4. Conclusions
Excessive N use existed in these two study areas and thus has significant impacts on GHG emissions and N leaching. Adjusting farm management practices (such as reduced N input and flooding duration) could reduce GHG emissions and N leaching while maintaining rice yield.
There is a significant spatial and temporal variability in soil and climate that significantly impact rice yields and GHG emissions. Therefore, a single uniform fertilizer policy across the region will likely be ineffective to overcome the spatial heterogeneity issue to achieve optimal N application rate.
The use of agroecosystem models such as DNDC allows an effective analysis of paddy rice yields, nitrogen leaching, greenhouse gas emissions and various management options that can all be optimized to achieve a win-win scenario. Future research, however, is needed to expand such research to larger geographic areas to encompass much diverse soil types, rice cultivars, climate and management, with geospatial tools and methods.
Acknowledgments
We would like to acknowledge the financial support from the Asian Pacific Network (APN) project (ARCP2013-FP25-Wu), the National Aeronautics and Space Administration (NASA)'s Land Cover and Land Use Program grant (NNX15AD51G), NASA's IDS(80NSSC17K0259), and the USDA project (MICL02264) through the AgBioResearch at Michigan State University.