

Abstract
Climate extremes are widely projected to become more severe as the global climate continues to warm due to anthropogenic greenhouse gas emissions. These extremes often cause the most severe impacts on society. Therefore, the extent to which the extremes might change at regional level as the global climate warms from current levels to proposed policy targets of 1.5 and 2.0 °C above preindustrial levels need to be understood to allow for better preparedness and informed policy formulation. This paper analysed projected changes in temperature and precipitation extremes at 1.0, 1.5 and 2.0 °C warming over Botswana, a country highly vulnerable to the impacts of climate change. Projected changes in temperature extremes are significantly different from each other at the three levels of global warming, across three main climatic zones in the country. Specifically, at 2.0 °C global warming relative to preindustrial, for the ensemble median: (a) country average warm spell duration index increases by 80, 65, 62 days per year across different climatic zones, approximately three (and two) times the change at 1.0 (1.5) °C; (b) cold night (TN10P) and cold day (TX10P) frequencies decrease by 12 and 9 days per year across all regions, respectively, while hot nights (TN90P) and hot days (TX90P) both increase by 8–9 days across all regions. Projected changes in drought-related indices are also distinct at different warming levels. Specifically: (a) projected mean annual precipitation decreases across the country by 5%–12% at 2 °C, 3%–8% at 1.5 °C and 2%–7% at 1.0 °C; (b) dry spell length (ALTCDD) increases by 15–19 days across the three climatic zones at 2.0 °C, about three (and two) times as much as the increase at 1.0 (1.5) °C. Ensemble mean projections indicate increases in heavy rainfall indices, but the inter-model spread is large, with no consistent direction of change, and so changes are not statistically significant. The implications of these changes in extreme temperature and precipitation for key socio-economic sectors are explored, and reveal progressively severe impacts, and consequent adaptation challenges for Botswana as the global climate warms from its present temperature of 1.0 °C above preindustrial levels to 1.5 °C, and then 2.0 °C.
Export citation and abstract BibTeX RIS

Original content from this work may be used under the terms of the Creative Commons Attribution 3.0 licence.
Any further distribution of this work must maintain attribution to the author(s) and the title of the work, journal citation and DOI.
1. Introduction
Some of the harshest impacts of climate change are likely to occur through more extreme climate and weather events (Trenberth 2012). Sub-Saharan Africa is among the most vulnerable of regions (Boko et al 2008, Niang et al 2014), with 34 of the top 50 most climate-vulnerable countries located in the continent (ND-GAIN 2016). Therefore, climate change and extremes will continue to pose significant social and economic pressures on livelihoods within the continent under a warming global climate (King et al 2015, ASC 2016). The frequency and intensity of extreme weather events is set to change, often increasing, across most regions thereby increasing vulnerability of those already exposed and sensitive especially rural communities (McElroy and Baker 2012, Adams et al 2013). These extreme events, including heat waves (Ceccherini et al 2017), heavy precipitation events causing floods (Cook et al 2004, Reason 2007, Manhique et al 2015, Moyo and Nangombe 2015) as well as droughts (Richard et al 2001, Rouault and Richard 2005) are already common drivers of vulnerability in southern Africa.
The 2015 Paris climate change accord, drawing on growing evidence from successive IPCC reports, agreed to work to keeping global mean surface temperature (GMST) warming due to greenhouse gas and other emissions to below 2.0 °C, with the ambition to keep temperature change below 1.5 °C of preindustrial temperature (UNFCCC 2015). Based on these two temperature warmings, various studies have been conducted on shifts in climates of different localities across the globe, assessing the extent to which an additional 0.5 °C temperature rise would influence both the mean and the climate extremes (e.g. James et al 2017, King et al 2017, Sanderson et al 2017, Wang et al 2017). With some studies proposing that the 1.5 °C warming level could be crossed as early as 2026 (Henley and King 2017), the need for early action becomes even more critical. This therefore calls for more detailed analysis of the potential regional and local changes in extremes that might accompany these levels of global temperature increase, especially in the most vulnerable regions of the world.
Previous work on assessing observed and projected trends in climatic extremes have largely been based on a set of 27 temperature and precipitation indices, devised by the Expert Team on Climate Change Detection and Indices (ETCCDI) (Zhang et al 2011). Several studies have shown changes in these indices over the last several decades across the globe, based on observed data (e.g. Frich et al 2002, Alexander et al 2006, Manton 2010) as well reanalysis datasets (e.g. Sillmann et al 2013a). These studies have shown a general trend towards more extreme weather under climate change. For future climate change, a number of studies have looked at the projected changes in both extremes of temperature (e.g. Sillmann et al 2013b, Lewis and King 2017) and precipitation (Sillmann et al 2013b) globally. Most of these studies looked at these changes for a particular period in the 21st century following a particular Representative Concentration Pathway (RCP) (Fischer et al 2013, Lewis and King 2017) or emissions scenario (Kharin et al 2007).
At regional scales, a number of studies have been carried out to assess both the historical and projected future trends in temperature and precipitation extremes (e.g. You et al 2011, Monier and Gao 2015, Dosio 2016, Razavi et al 2016). For Southern Africa, New et al (2006) investigated the historical context of extremes from observations, while Shongwe et al (2009) and Pinto et al (2016) looked at the historical and future projection of precipitation extremes from reanalysis and downscaled climate model outputs. There has so far been little research on the relative impact of global warming of 1.5 °C and 2.0 °C on climate extremes at the national or sub-national scale.
Botswana, though highly exposed and vulnerable to the impacts of climate change, is under-researched on physical climate change, especially on the evolution of climate extremes. A recent study ranked Botswana among the top few countries in Africa in terms of national mean temperature and precipitation changes as global temperature rises to 1.5 °C and 2.0 °C (Zaroug et al 2018). This potential vulnerability is reflected in policy and practice in Botswana: Hambira and Saarinen (2015) note the widespread agreement among policy makers on the perceived worsening climate patterns in Botswana; Akinyemi (2017) reports similar perceptions amongst farming communities in Eastern Botswana; in both these cases, there is no quantitative research available to back up these views. This paper therefore aims to quantify the projected changes in climate extremes that can be expected at the global temperature targets agreed in Paris, relative to both pre-industrial and present-day global temperature levels. The paper then discusses the implications of these projected changes for vulnerability of key sectors in Botswana.
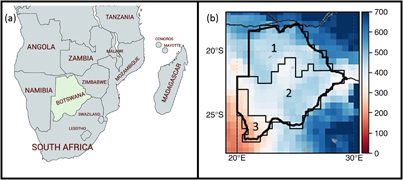
Figure 1. (a) Map of Southern Africa with Botswana highlighted (Mapchart.net). (b) Mean annual precipitation (1979–2013) in mm over Botswana derived from the WFDEI dataset and the three regions of homogeneous monthly rainfall in Botswana (Region 1, 2 and 3).
Download figure:
Standard image High-resolution image2. Data and methodology
2.1. Study area
Figure 1(a)), sharing borders with South Africa to the south, Namibia to the west, Zambia to the north and Zimbabwe to the north east. The subsiding limb of the tropical Hadley circulation defines much of the climate in Botswana, with a semi-permanent high pressure system (the Botswana high) persistent over the region (Driver and Reason 2017). The south-western part of the country is hyper-arid, receiving the lowest rainfall, with aridity then decreasing to North and East of the country (figure 1(b)). Temperatures in Botswana are lowest during the austral winter and highest during the austral summer. In winter, the occasional passing of westerly cold frontal systems can cause minimum temperatures to fall to below freezing resulting in frosts over most parts of the country (Andringa 1984). Summer mean maximum temperatures range between 30.9 °C–33.0 °C across the country, the western parts of the country being hotter (Moses 2017). Occasional heat waves are also experienced in austral summer with temperatures reaching highs of over 42 °C in some places (Moses 2017). Botswana's interannual climate variability is mainly driven by the El Nino Southern Oscillation (ENSO), where El-Nino events are associated with dry conditions (Nicholson et al 2001) and La Nina events are associated with wet years (Mason and Jury 1997). Rain bearing weather systems affecting the country include among others temperate tropical troughs (Williams et al 2007) and mesoscale convective systems (Blamey and Reason 2012). These systems are mainly convection driven and associated with the southward movement of the Intertropical Convergence Zone (ITCZ) in the austral summer months (mainly November to March) (Bhalotra 1987). Tropical depressions that form in the Indian Ocean also occasionally penetrate the subcontinent from the east, bringing along heavy precipitation (Reason and Keibel 2004, Reason 2007). Some heavy precipitation events could be a combination of various weather systems such as westerly troughs (cold fronts), tropical lows and ridging anticyclones creating conducive environment for such events (Crimp and Mason 1999). Cut off lows are also a common occurrence over the region, they tend to bring along heavy precipitation episodes that can cause flooding in some places in Southern Africa including Botswana (Singleton and Reason 2007, Favre et al 2013, Molekwa 2013). Cut off lows also tend to be associated with extreme rainy days that fall outside of the normal rainy season (Favre et al 2013). Dry spells within the rainy season are also a common occurrence in Botswana (Vossen 1990), being more frequent during ENSO warm phases and over the south-western parts of the country (Usman and Reason 2004).
2.2. Data
The ETCCDI temperature and precipitation extreme indices derived from the fifth version of Coupled Model Intercomparison Project (CMIP5) program participating models were analyzed. A total of 24 CMIP5 Global Climate Model (GCM) outputs developed by Sillmann et al (2013a) (table S1 available at stacks.iop.org/ERL/13/065016/mmedia), were downloaded from KNMI Climate Explorer website database, https://climexp.knmi.nl (Trouet and van Oldenborgh 2013). A multi-model ensemble is used to account for uncertainty in the projections of the climate extremes, as both the ensemble mean, and associated spread, provide a more robust assessment of signal and noise than results from one or a few models (Tebaldi and Knutti 2007, Knutti et al 2010, IPCC 2012).
The indices are available re-gridded to a common spatial resolution of 2.5° × 2.5° from their native model resolutions (Sillmann et al 2013b). Historical simulations (1861–2005) combined with the high emissions scenario Representative Concentration Pathway that projects an 8.5 W m−2 radiative forcing on the climate system by 2100 (RCP8.5) (Taylor et al 2012) are chosen for analysis. This RCP is chosen as the forcing is sufficiently intense to guarantee all models reach a warming of 2.0 °C by the end of their simulations; further it is most representative of current forcing trends (Lewis and King 2017). As described below, we analyze indices from individual models at the time they reach specific global temperature targets, so the forcing scenario is not particularly important. Additionally, Pendergrass et al (2015) and Shi et al (2017) have shown that, in general, changes in climate extremes are indistinguishable across different RCPs when using multi-model ensembles; although Wang et al (2017) shows that differences in regional aerosol emissions do produce differences in projected changes over high emission areas (not Southern Africa).
Table 1. Temperature and precipitation climate extreme indices relevant to vulnerability assessment in Botswana. The indices are available from the KNMI Climate Explorer website [http://climexp.knmi.nl].
| Symbol | Name | Units |
|---|---|---|
| Precipitation indices | ||
| PRCPTOT | Annual total precipitation in wet days | mm/yr |
| ALTCDD | Maximum number of consecutive days per year with less than 1 mm of precipitation | days |
| ALTCWD | Maximum number of consecutive days per year with at least 1 mm of precipitation | days |
| RX1DAY | Annual maximum 1 day precipitation | mm/d |
| RX5DAY | Annual maximum 5 day precipitation | mm/5 d |
| R99P | Annual total precipitation when daily precipitation exceeds the 99th percentile of wet day precipitation | mm/yr |
| R95P | Annual total precipitation when daily precipitation exceeds the 95th percentile of wet day precipitation | mm/yr |
| R20MM | Annual count of days with at least 20 mm of precipitation | days |
| R10MM | Annual count of days with at least 10 mm of precipitation | days |
| Temperature indices | ||
| TX90P | Percentage of days when daily maximum temperature is above the 90th percentile | % |
| TN90P | Percentage of days when daily minimum temperature is above the 90th percentile | % |
| TX10P | Percentage of days when daily minimum temperature is below the 10th percentile | % |
| TN10P | Percentage of days when daily minimum temperature is below the 10th percentile | % |
| WSDI | Maximum number of consecutive days per year when daily maximum temperature is above the 90th percentile | days |
This study focuses on extreme indices that relate directly to climate change vulnerability in Botswana (table 1) as determined from a review of vulnerability to climate in semi-arid countries of Southern Africa (Spear et al 2015). Rainfall deficit, rainfall variability and high temperature extremes have been found to be the main climate factors driving vulnerability (Batisani and Yarnal 2010, Omari 2010, Kgosikoma and Batisani 2014, Masundire et al 2016). PRCPTOT relates to annual rainfall deficits, R99P, R95P, RX1DAY, RX5DAY, R20MM and R10MM, ALTCWD heavy rainfall extremes and ALTCDD dry periods (irrespective of season). We note that rainfall extreme indices from GCMs may be biased compared to observations due to limitations in how models represent processes that drive precipitation extremes (Dai 2006, Westra et al 2014); they tend to precipitate more frequently, and in smaller amounts, affecting both dry spell length, as well the absolute value of heavy rainfall. However, within their own climate, they do simulate precipitation extremes (O'Gorman 2015), and so trends in these extremes can provide insights for the real world. For temperature-derived indices, WSDI is used to relate the potential impact of continuous high temperature instances (heat waves as defined by Moses 2017). TN90P, TN10P, TX10P and TN10P are also included to help in defining the potential impact of individual hot and cold events (Klein Tank et al 2009).
2.3. Methodology
A 40 year period (1861–1900) base period for the preindustrial era was defined from which the changes in extreme indices are compared following Huang et al (2017). The years at which each participating model reaches 1.0, 1.5 and 2.0 °C global warming above preindustrial levels is defined using a time sampling method initially used by Kaplan and New (2006) and applied by Zaroug et al (2018). The 1.0 °C temperature warming above preindustrial is used to represent the current climate (warming to date, from preindustrial) given the GMST reached 1.1 °C in 2016 (WMO 2017). A 31 year running mean is applied to the entire time-series for each model ensemble member. The climatology at a given GMST warming above pre-industrial is defined by the year the running mean reaches the GMST of interest and then stays consistently above the GMST. Figure 2 shows the spread of the years the participating models reach 1.0, 1.5 and 2.0 °C warming above preindustrial levels.

Figure 2. Timing of when participating ensemble members reach GMST of 1.0, 1.5 and 2.0 °C warming above the 1861–1900 preindustrial baseline period following the RCP8.5 emissions scenario pathway.
Download figure:
Standard image High-resolution imageMonthly means of observed climate for 1979–2013 from the WATCH Forcing Data methodology applied to ERA-Interim data (WFDEI) (Weedon et al 2014) was used to cluster Botswana into three regions of homogeneous rainfall (figure 1(b)). The WFDEI dataset was found to simulate precipitation well over southern Africa (Li et al 2013) and has been used in a number of studies in sub-Saharan Africa (Andersson et al 2017, Nkiaka et al 2017). Shapefiles of Botswana and the three regions were created using ArcMap and used to extract the gridded sub-sets of the indices over each region, and the whole country.
Area-weighted average climatological means of the indices at a given GMST warming above pre-industrial levels were calculated within the subsets and used to determine the change relative to pre-industrial levels. For all the 24 members, the change for each extreme index relative to preindustrial levels is calculated as
where In n ∈ {1.0, 1.5 and 2.0} represents the area-averaged climatological mean calculated from the 31 year period surrounding the date of GMST, and I0 is the area averaged climatological mean of the index of interest for 1861–1900 preindustrial times. Box-and-whisker plots of the absolute changes for each climate extreme index are plotted spanning the 24 member ensemble for each for the three regions and over the country areal average.
The non-parametric Wilcoxon Paired Signed Rank test (WPSR) is applied to test if the distributions of ensembles of the indices at 1.0, 1.5 and 2.0 °C are statistically significantly different from preindustrial levels, and from each other. This test has been used in previous climate studies looking to determine the significance of changes in various climate indices/variables at different warming levels (Kharin et al 2013, Sillmann et al 2013b). To determine whether the models agree on the sign of change, a criterion that at least 75% of the members need to agree on the sign was adopted (Sillmann et al 2013b, Pinto et al 2016).
3. Results
Results are presented in box-and-whisker plot format, representing the ensemble spread for the change in the indices relative to the preindustrial baseline period. Changes are presented first for precipitation extreme indices followed by temperature extreme indices. From the plots, the ensemble median, interquartile range (IQR) and the outliers are represented. Ensemble member values that exceed 1.5 × IOR are considered to be outliers. The box-and-whisker plots are made for each of the three regions (figure 1(b)) and the country average. Results obtained from testing model agreement on the sign of change are summarized in table S2 while table S3 summarizes the median and IQR changes in both of the precipitation and temperature indices relative to preindustrial levels. The inter-model ensemble spread, shown by the box-and-whisker plots together with the test for model agreement on change of sign depict the uncertainty in the projected changes of the indices. WPSR test results are presented using p-values.
3.1. Precipitation extremes changes
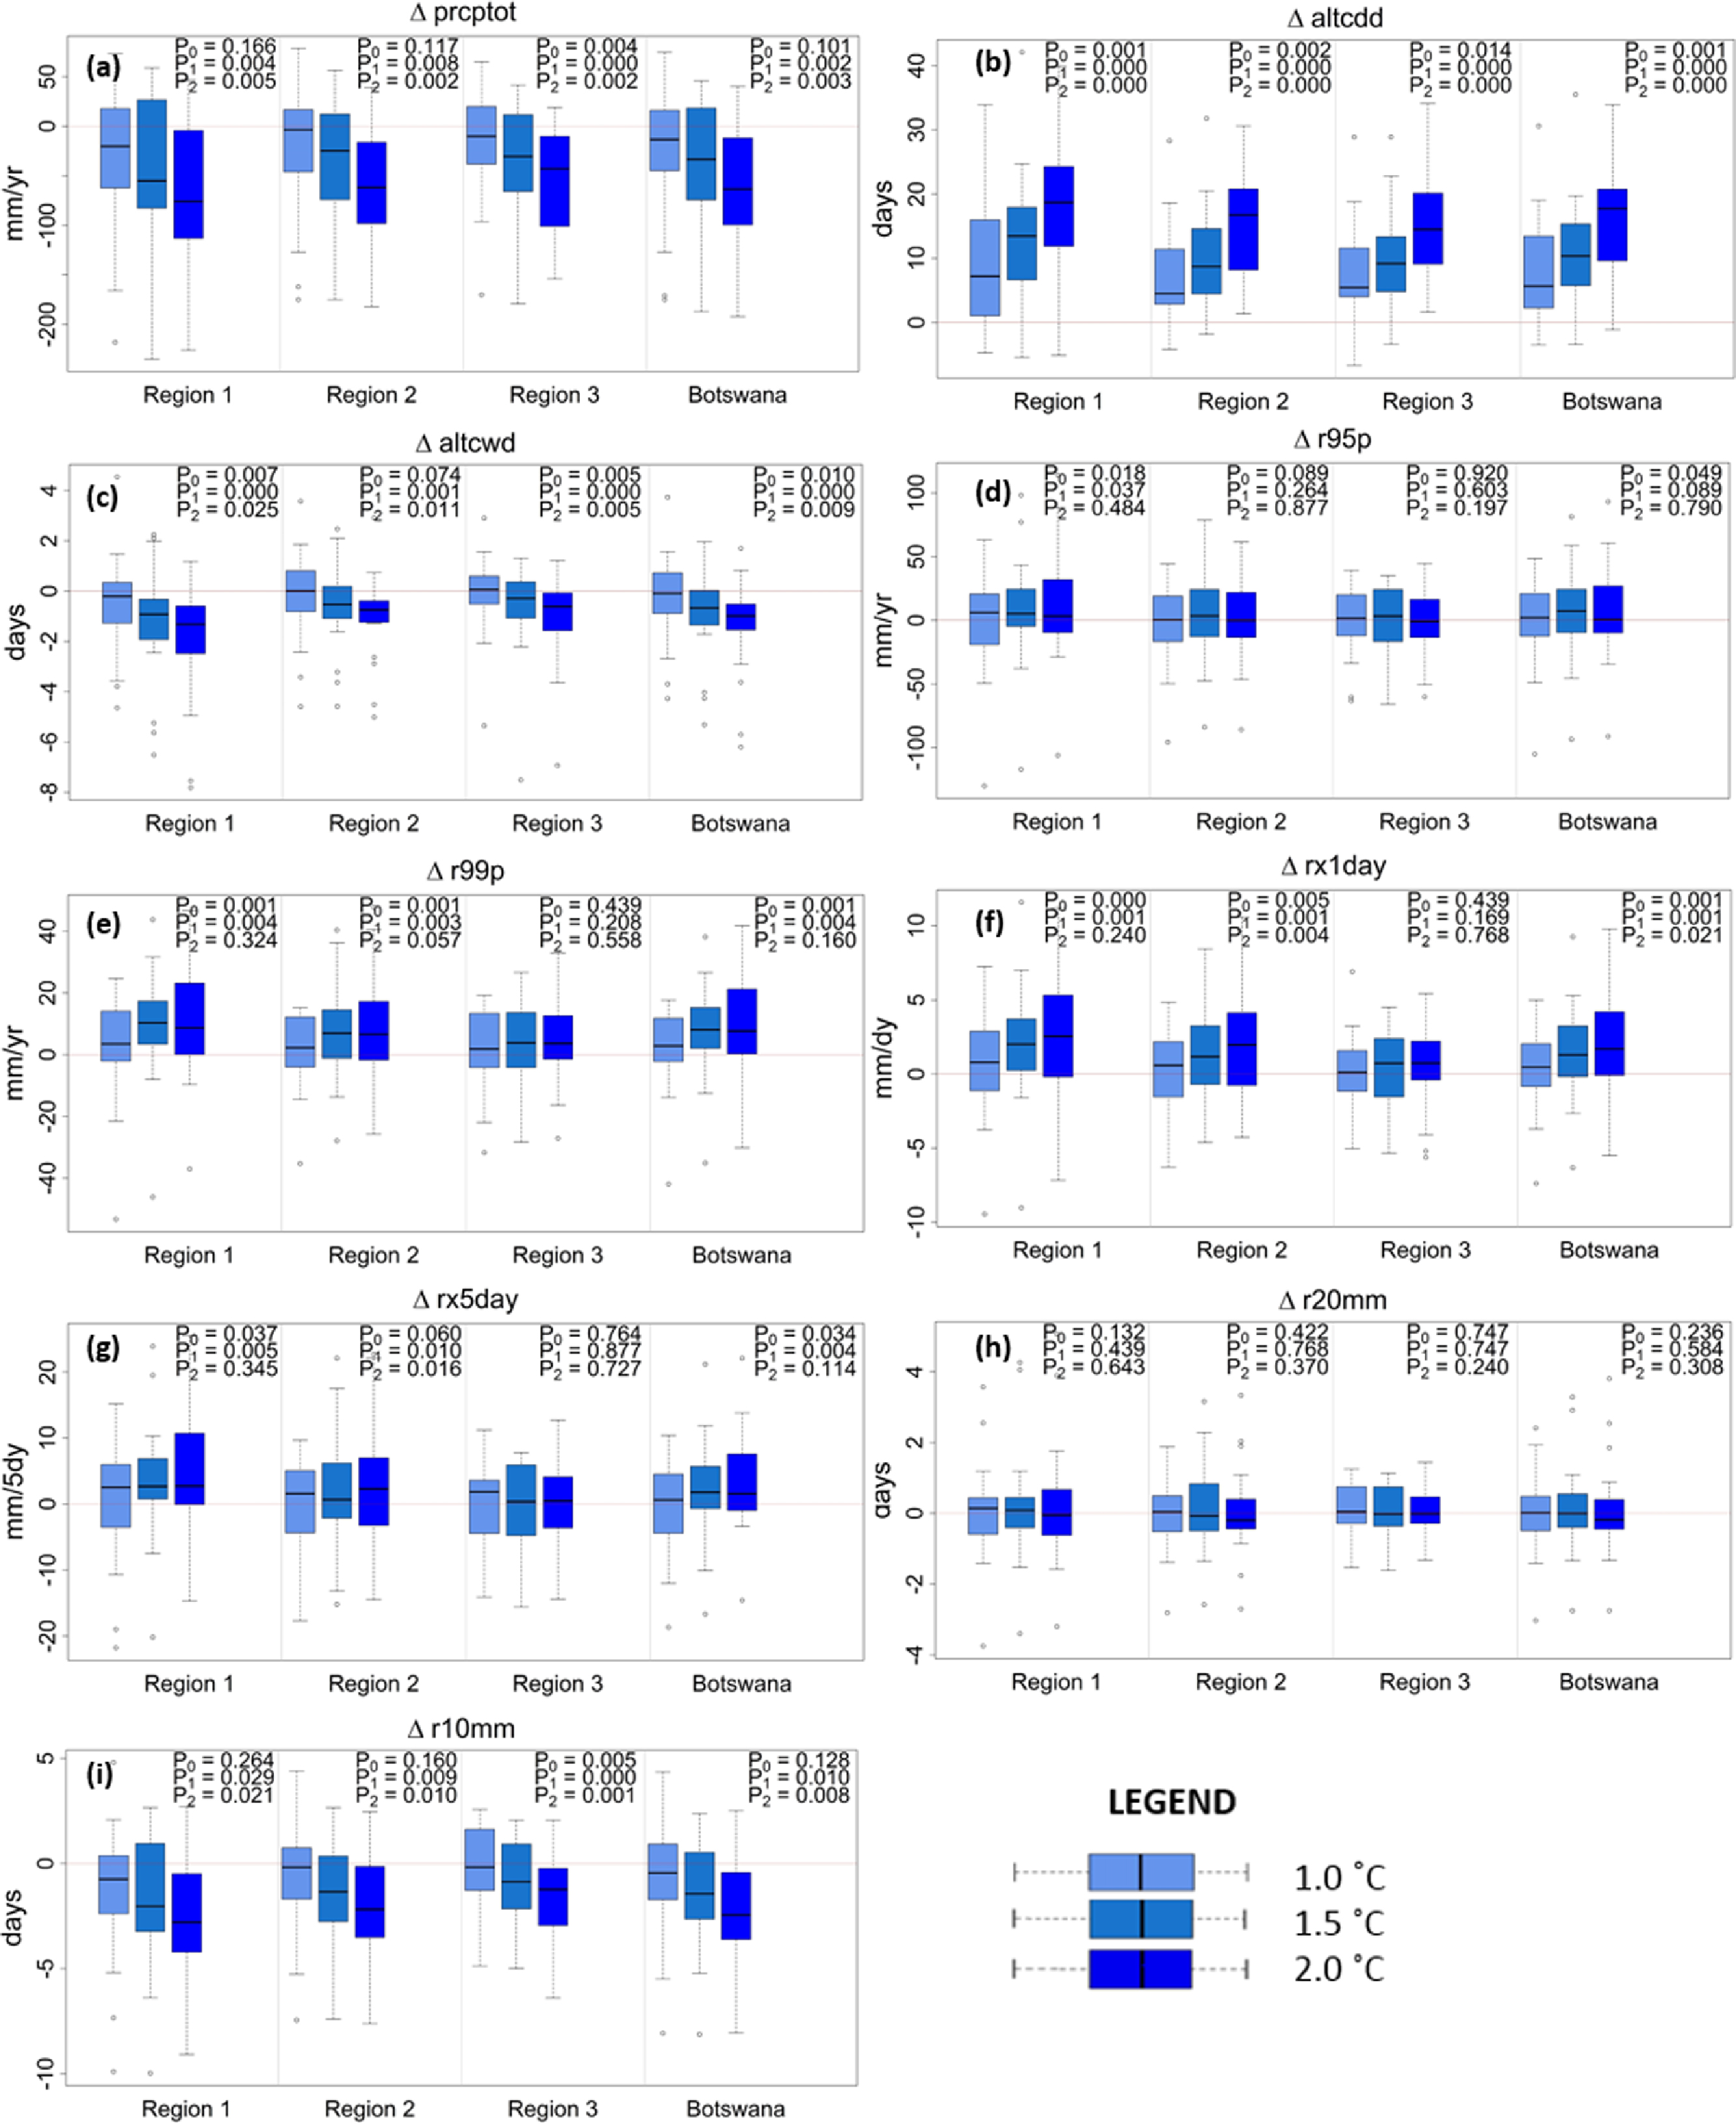
Changes in the precipitation indices at 1.0, 1.5 and 2.0 °C GMST warming above preindustrial levels indicate a progressive drying across Botswana, accompanied by an increase in heavy precipitation events, reduced wet spell events and increased dry spells (figure 3). The country average ensemble median change for total annual precipitation, PRCPTOT at 1.0, 1.5 and 2.0 °C GMST warming above preindustrial levels indicate a reduction of −13 [range of −175; +75], −33 [−187; +46] and −63 [−192; +40] mm/yr (figure 3(a)). Of the three regions, Region 1 representing the northern and wettest parts of the country has the largest median reduction, and range, across the three warming periods with reductions of 20.2, 55.1 and 75.9 mm yr−1 respectively (these are also the largest relative reductions, compared to preindustrial mean precipitation; see figure S1(b)). This region, as opposed to the rest of the country tends to be the one that receives most of its rainfall when the ITCZ shifts south in austral summer. The stabilizing and equatorward shifting of the mean position of the ITCZ under climate change could therefore be the reason behind the reduction (Giannini et al 2008). Region 3 has the least reductions (10–43 mm) in total annual precipitation, because of its already low annual precipitation totals (figure 1(a)); relative reductions are much larger (figure S1(a)). When testing for model agreement on change of sign, the change in PRCPTOT at 2.0 °C is the only one that shows consensus among models with >75% of the ensemble members projecting a reduction across all regions. Taking the country average, 58.3% of the models project a decrease in PRCPTOT at 1.0 °C, 62.5% at 1.5 °C and 83.3% at 2.0 °C GMST above preindustrial levels (table S2). WPSR test results show that the change in PRCPTOT between the three levels of warming is statistically significant across all regions, except for 1.0 versus 1.5 for a couple of the regions. An additional 0.5 °C increment in GMST from 1.5 °C and 2.0 °C therefore has significant impacts on the annual precipitation across the country. We note that PRCPTOT is not strictly a climate extreme, but it is included in climate extreme studies as total annual precipitation is a measure of interannual drought, and has implications on various economic sectors especially in water stressed countries like Botswana.

Figure 3. Box and whisker plots showing the changes in extreme precipitation indices across an ensemble of 24 participating model members. The changes are at 1.0, 1.5 and 2.0 °C above preindustrial levels (1861–1900). P-values from the WRS test are shown: P0, P1 and P2 compares the ensemble spread of 1.0 °C–1.5 °C, 1.5 °C–2.0 °C and 1.0 °C–2.0 °C warmer climate regimes respectively.
Download figure:
Standard image High-resolution imageThe number of consecutive dry days (ALTCDD) (figure 3(b)) show statistically significant increases across all regions for all warming levels. The ALTCDD median increases of 7.2, 13.5 and 18.7 days for the 1.0, 1.5 and 2.0 °C respectively are projected for Region 1, these being the largest of the changes. On average, Botswana is projected to experience median increases of 5.7, 10.4 and 17.8 days in ALTCDD under the respective warmings. There is general consensus on the sign of change of ALTCDD across ensemble members with more than 80% of members depicting an increase across the three warming periods over the entire country. The increases in ALTCDD imply longer dry seasons with late onsets and early cessation of rainfall, as noted by Pinto et al (2016) and Sillmann et al (2013b). Median changes in the number of consecutive wet days (ALTCWD) are generally small in magnitude (figure 3(c)). Relative to preindustrial levels, median changes at 1.0 °C warming are for a decrease of 0.21 days in Region 1 while Region 2 and 3 show median increases of even smaller magnitude. On average, an additional 0.5 °C warming to 1.5 and 2.0 °C reduces ALTCWD by about half a day. The reductions in ALTCWD may be small in magnitude but are very significant given the short-lived and convective nature of rain bearing weather systems in Botswana. The shorter rainfall seasons described by increases in ALTCDD coupled with potentially shorter wet-spells could have serious implications on various economic sectors, with the agricultural sector likely to be particularly vulnerable.

Figure 4. Box and whisker plots showing the changes in extreme temperature indices across an ensemble of 24 participating model members. The changes are at 1.0, 1.5 and 2.0 °C above preindustrial levels (1861–1900). P-values from the WRS test are shown: P0, P1 and P2 compares the ensemble spread of 1.0 °C–1.5 °C, 1.5 °C–2.0 °C and 1.0 °C–2.0 °C warmer climate regimes respectively.
Download figure:
Standard image High-resolution image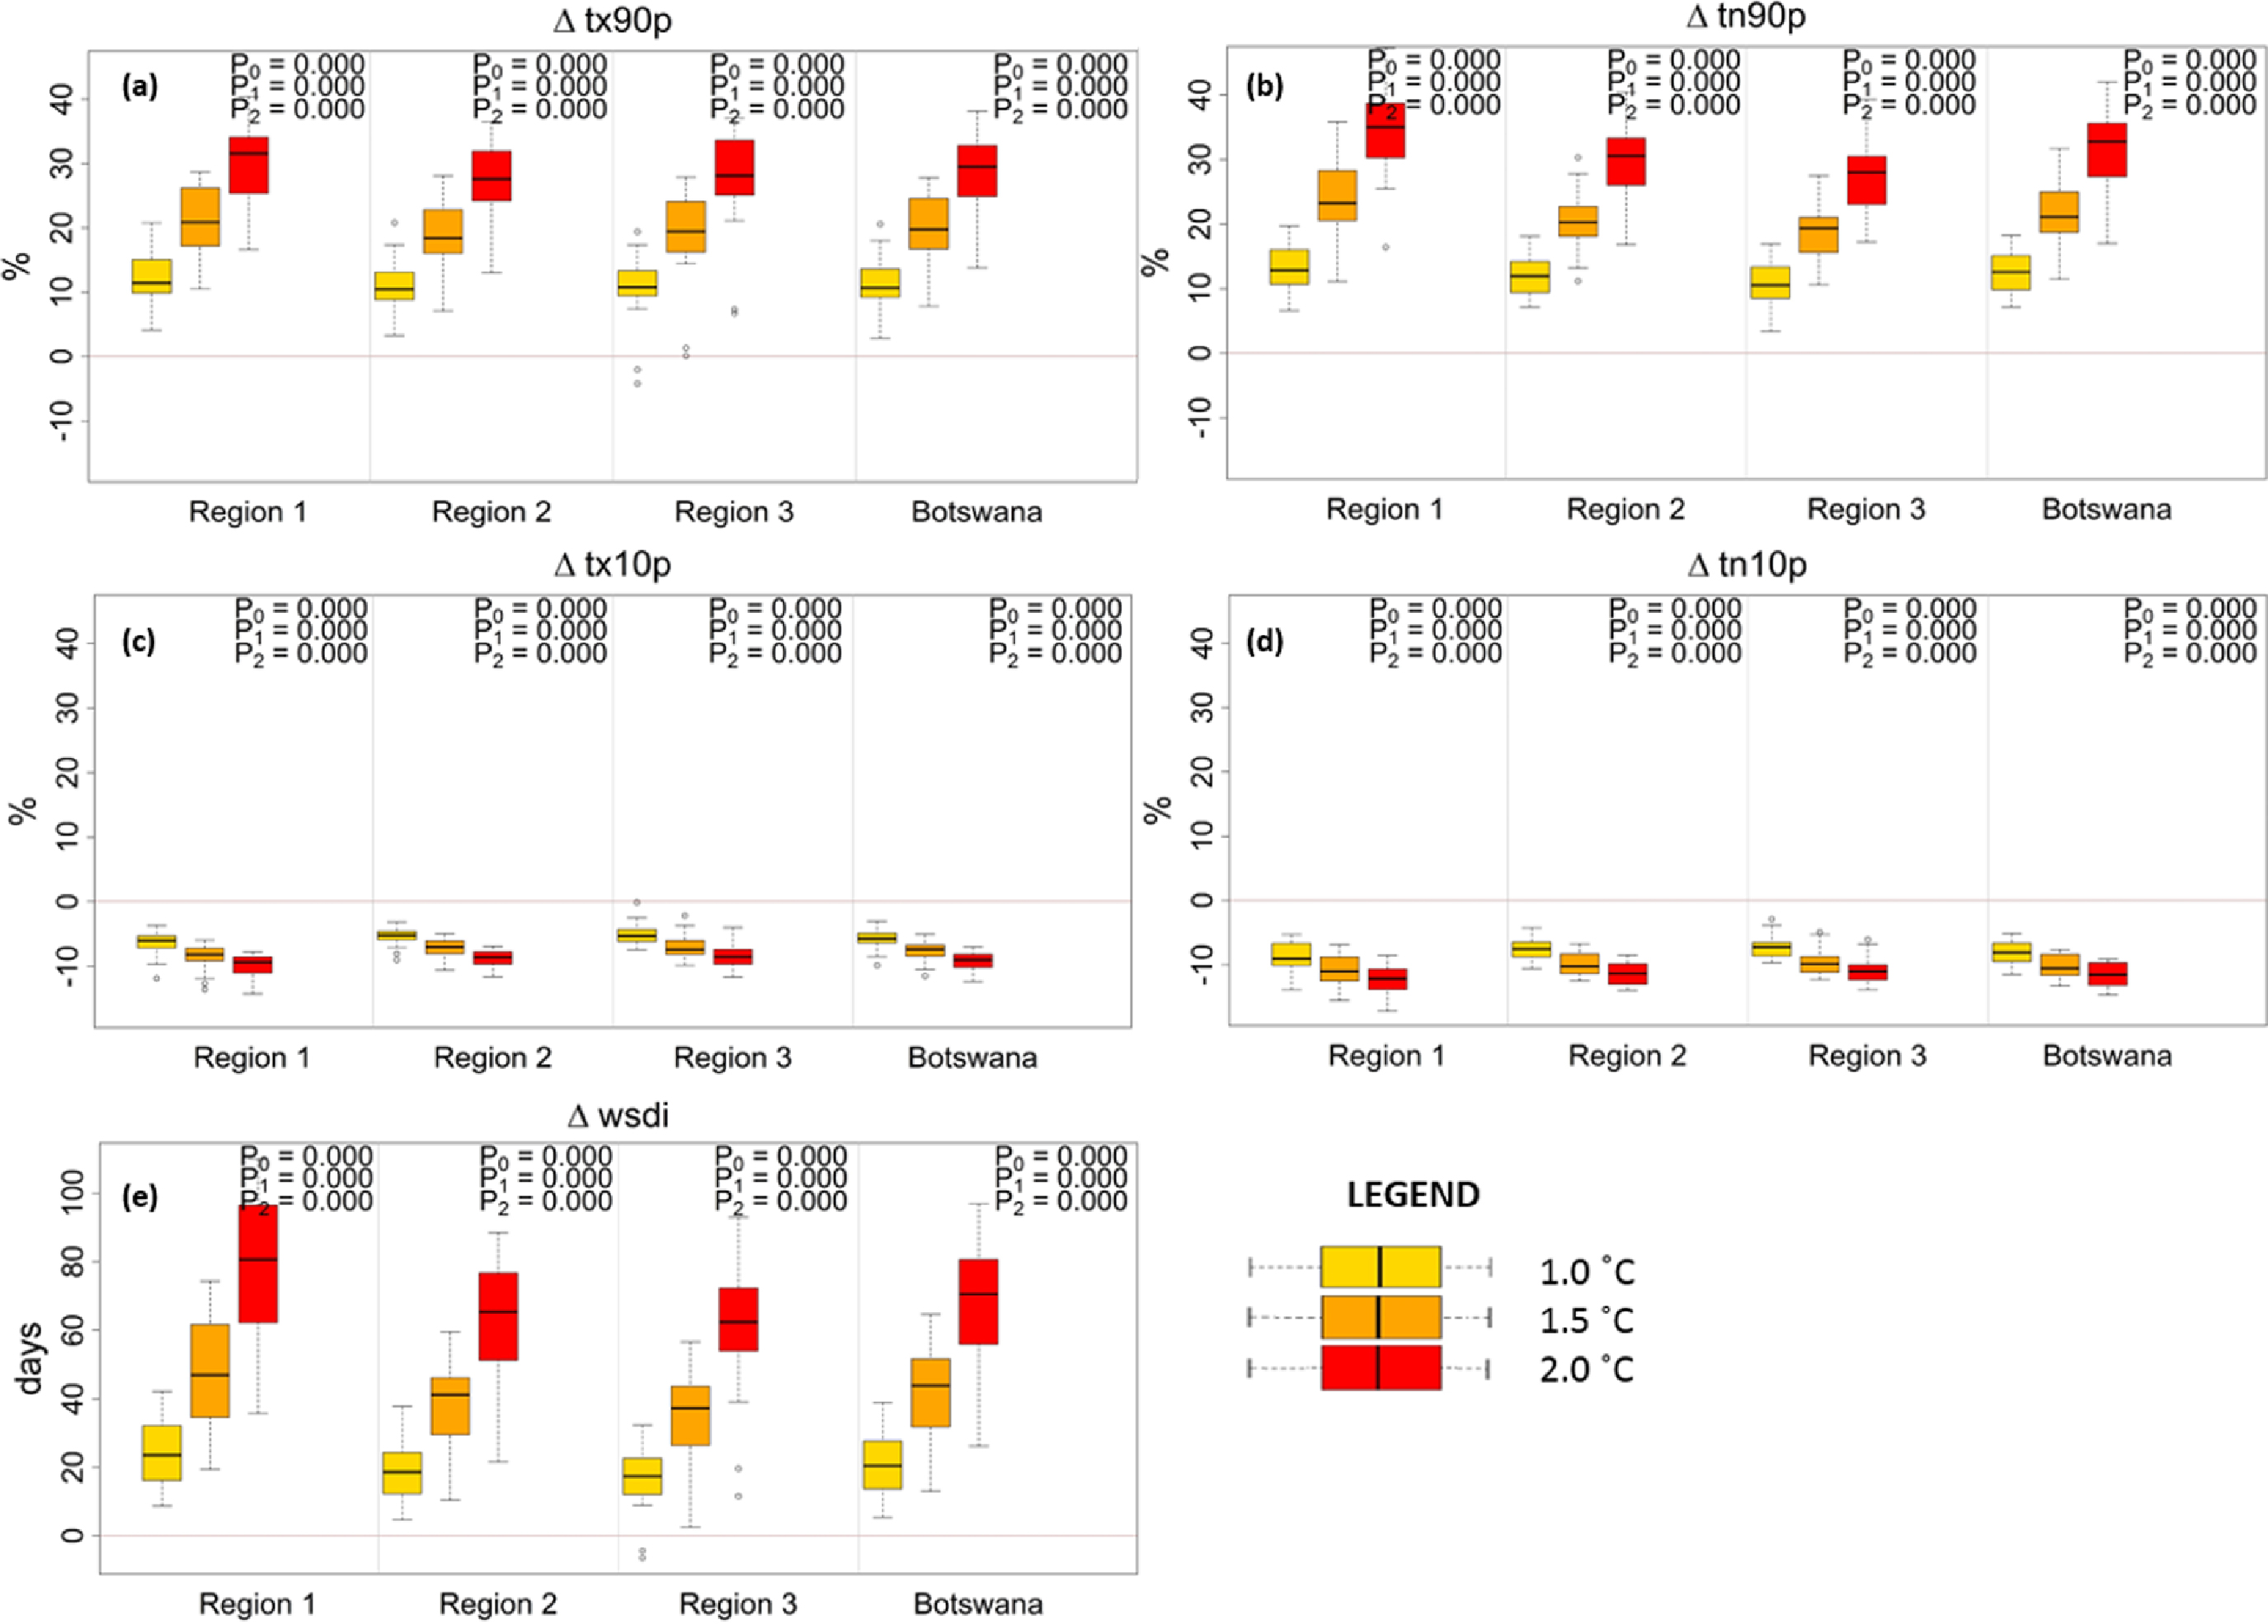
For the heavy precipitation indices, the projected ensemble median changes in total accumulated precipitation from heavy (R95P) and very heavy (R99P) precipitation days are a small, but generally non-significant increase as the climate system warms further (figures 3(d) and (e)). For R99P, the changes are mostly significant between the three warming levels in Regions 1 and 2, but not in Region 3. The ensemble spread generally disagrees on the sign of change for R95P, but there is more agreement for R99P, especially at the 1.5 °C and 2.0 °C warming levels.
Median changes in one-day and five-day maximum precipitation (RX1DAY and RX5DAY) show a general increase across all regions as the models progress to warmer climates. These changes are generally statistically significant over the wetter and semi-arid Regions 1 and 2, but not in the arid Region 3. (figures 3(f) and (g)). These results slightly contradict the findings by Sillmann et al (2013b) who concluded that there is a general decrease (though statistically insignificant) in RX5DAY in Southern Africa when looking at the changes for the period 2081–2100 relative to 1981–2000 Pinto et al (2016)'s findings using downscaled projections over Southern Africa are consistent with our results, though they looked the changes at 2069–2098 relative to the 1976–2005 period. Changes in the frequency of very heavy (R20MM) rainfall events do not show any significant changes, while the frequency of moderately heavy rainfall events (R10MM) show statistically significant decreases across all regions (figures 3(h) and (i)).
To investigate whether biases inherent in climate models especially in simulating accumulated precipitation may influence the results, box-and-whisker plots of percentage changes in the total annual precipitation (PRCPTOT), one day maximum precipitation (RX1day) and the five-day maximum accumulated precipitation (RX5DAY) relative to industrial levels were also analysed (figure S1). Similar results to those obtained using absolute changes were found. An exception was that P0 for PRCPTOT in Region 2 decreases from 0.117 when using absolute changes to 0.097 when using percentage changes (figure S1(a)). The difference suggests that the change in PRCPTOT between the current climate and 1.5 °C are statistically significantly different in Region 2. This could be because of the aridity in Region 2 meaning small percentage changes in total annual precipitation make a significant difference.
3.2. Temperature changes
The changes in temperature indices agree strongly on the direction of change across all indices (figure 4 and table S2). P-values for temperature derived indices obtained from the WPSR test are all very small (≪ 0.10) across all regions and warming levels above preindustrial levels. The p-values here imply that the changes in these indices are statistically significant across all warming levels. The inter-model spread is small for most temperature extremes therefore results are generally associated with less uncertainty.
Of the percentile based indices, the hot day and hot night extremes, TX90P (figure 4(a)) and TN90P (figure 4(b)) show the greatest changes, though the change is more pronounced for TN90P especially over Region 1. TX90P is projected to increase by 30% above preindustrial levels on average in Botswana when the climate system reaches 2.0 °C, an increment of 10% from 1.5 °C levels. For TN90P the average increase at 2.0 °C is even higher, at 35%. Decreases in cold day and night extremes, TX10P (figure 4(c)) and TN10P (figure 4(d)), occur over the entire country with minimum temperature based extremes showing the larger reductions. Hot nights and mild winters are therefore expected to become a common occurrence with a warming climate leading to a decrease in frost occurrences. Warm spells (heat waves; WSDI) increase are projected across all regions, by 80 days compared to preindustrial levels at 2.0 °C for Region 1, and by 65 and 62 days for Region 2 and 3 (figure 4(e)). Even though all models show an increase in warm spells with increased warming, the ensemble spread also increases significantly at 2.0 °C (ranging between 26 and 96 days) compared to present (5–39 days) and 1.5 °C (13 and 65 days) indicating an increasing uncertainty as models warm further. Relating to findings by Moses (2017), the increases in TX90P and WSDI suggest a significant increase in heat wave events across the country. We note here the need to look at these indices seasonally as an opportunity for further investigation (Sillmann et al 2013b), and that the WSDI does not consider the intensity of heat waves (Dosio 2016).
3.3. Implications for vulnerability to climate change in Botswana
The projected changes in both temperature and precipitation extremes under warming climates are likely to have significant negative impacts on many social and economic activities in Botswana, most especially in the agricultural sector, and those dependent on water. The majority of Botswana's population is highly reliant on rain-fed agriculture for livelihoods, so these changes in extremes are likely to produce severe impacts, especially on the most vulnerable, women (Omari 2010). Many crops suffer sharp drops in yield after periods of cumulative heat stress (e.g. Schlenker and Lobell et al 2010). The large increases in temperature extremes projected for Botswana as one moves from 1.5 °C–2.0 °C, suggest potentially large, and growing impacts on crops that are currently farmed, such as maize (Barnabás et al 2008), significantly reducing yields. This is in agreement with previous studies showing that Botswana will be among the most impacted countries with regards to agriculture in Africa (Chipanshi et al 2003, Schlenker and Lobell 2010). These impacts will be exacerbated, particularly for rain-fed agriculture, by the projected decreases in mean annual rainfall and longer dry spells causing plant water stress, more frequently crossing the tipping point between good and average harvests, and complete agricultural failure (Batisani and Yarnal 2010). More intense rainfall will potentially cause crop damage and lower soil moisture. These multiple impacts warn of a growing adaptation challenge as the climate warms from today, through 1.5–2.0 degrees, requiring more heat and drought-tolerant varieties to be developed or adopted. The options for expanding irrigated agriculture are small, apart from perhaps the North West of the country in the Okavango basin, but this would involve trade-offs with biodiversity conservation and ecotourism in this unique wetland system. Livestock production is also likely to be negatively impacted as increased dry spells will reduce pasture productivity (Setshwaelo 2001, Mberego 2017), compounded by inadequate adaptation strategies (Kgosikoma and Batisani 2014).
Water resources are also likely to be heavily impacted by the reduced total precipitation and increased intensity and longer dry spells, and greater evaporation under more extreme temperatures. Water stress is already a challenge with various economic sectors competing for the scarce resource; drought in 2014–2016 led to water-supply failure in the capital city, Gaborone (Siderius et al 2018). For Region 3, in the south-western parts of the country where rainfall is already low (annual accumulations of less than 300 mm), further reductions in rainfall imply increased pressure on the already stressed water sources (Batisani 2011). The increasing RX5DAY implies a potential increase in very heavy rainfall events that could cause flooding and lead to economic losses (Tsheko 2003). Though this is the case, some of these heavy rainfall events could come as a relief, replenishing stressed water resources. An example of such a case is the heavy downpours that came with post cyclone Dineo in February 2017, filling up the Gaborone dam that had run dry the previous year.
Climate sensitive diseases such as malaria will also be affected by the changes in climate extremes. As malaria epidemics thrive in wet and warmer climates, a general drying of the climate and shorter rainy seasons could lead to a reduction in the extent of the disease (Tanser et al 2003). Tanser et al (2003) also note that though for drier climates climate change might lead to a reduction in malaria incidences, epidemics can rise during times of heavy precipitation in these generally dry climates (Huang et al 2017). Based on the reasoning above, epidemics of malaria cases could also become a challenge as the climate systems warms to 2.0 °C. Other implications for health include increased chances of heat related mortalities as heat waves become a common occurrence, malnutrition due to reduced food supply as the agricultural sector is negatively impacted, and direct mortalities and injuries from floods (McMichael et al 2006).
4. Conclusions
This study found that Botswana is projected to experience significant increases in all temperature and many rainfall extremes as GMST increases from 1.0 °C through 1.5 °C–2.0 °C above preindustrial levels. The changes are particularly strong for temperature extremes; for each increment of global warming, temperature extremes are statistically different, indicating markedly different regional climates over Botswana at different levels of global warning. Similarly, there are projected statistically significant decreases in mean rainfall and increases in dry-spell length at each global temperature level. In contrast, although intense rainfall indices do show ensemble median increases, the spread in model results means that changes at each increment are not statistically distinguishable.
These changes in extremes present a growing adaptation challenge between 1.5 °C and 2.0 °C for key economic sectors in the country. Rain-fed agriculture is already marginal across much of the country, and the combined changes in heat extremes and decrease in moisture may well make current agricultural practices unviable at 1.5 °C and 2.0 °C warming. Botswana is already water-stressed; the projected decreases in mean annual rainfall, as well increased dry spell length, will escalate stress, leading to more frequent water shortages in today's urban and agricultural supply systems. Further work is needed to better quantify the impacts, and resultant costs of adaptation at these different levels of global mean warming. However, our results suggest that, for a climate-stressed country such as Botswana, even small increments in global mean temperature have serious societal consequences that will demand progressively more radical adaptation responses.
A key limitation in our study relates to the use of GCM data, which are known to not completely represent extremes, especially rainfall, due to their relatively course spatial resolution. Further work is needed to apply downscaling methods to the GCM data, to add more information at finer space scales, subject to suitable evaluation of the downscaled data, as suggested by Pinto et al (2016). Another limitation to this study is that all extremes analysed are calculated on annual timescales; given that some of the indices such as ALTCDD and WSDI are also significant when looked at within seasons, further work is needed to look at the changes at seasonal timescales (Sillmann et al 2013b, Sillmann et al 2017).
Acknowledgments
This work was carried out under the Adaptation at Scale in Semi-Arid Regions project (ASSAR). ASSAR is one of four research programs funded under the Collaborative Adaptation Research Initiative in Africa and Asia (CARIAA), with financial support from the UK Government's Department for International Development (DfID) and the International Development Research Centre (IDRC), Canada. The views expressed in this work are those of the author and do not necessarily represent those of DfID and IDRC or its Board of Governors.