

Abstract
Humid tropical forests provide numerous global ecosystem services, but are under continuing threat of clearing from economic drivers. Here, we report primary humid tropical forest extent for the year 2001, and primary forest loss and distance to loss from 2002–2014 for the largest rainforest countries of Brazil, Democratic Republic of the Congo (DRC), and Indonesia. Brazil's total area of primary forest loss is more than twice that of Indonesia and five times that of DRC. Despite unprecedented success in slowing deforestation along its forest frontier, Brazil's most remote forests are increasingly nearer to loss, as extractive activities such as logging and mining intrude upon previously intact forests. In absolute terms, DRC has the lowest area of primary forest loss; however, its forests are increasingly encroached upon as smallholder agriculturalists move into remaining forests, often to escape conflict and insecurity. The decrease in DRC forests' distance to loss as a function of area of forest loss was five times that of Brazil or Indonesia. In 2014, Indonesia had the least area of remaining primary forest. Despite an announced moratorium on concession licenses in 2011, Indonesia exhibited a rate of primary forest loss twice that of DRC and triple that of Brazil by the end of the study period. Forest loss dynamics in Indonesia range from industrial-scale clearing of coastal peatlands to logging of interior montane rainforests. While results illustrate considerable variation in forest loss dynamics between the three countries, the dominant narrative is of ongoing exploitation of primary humid tropical forests.
Export citation and abstract BibTeX RIS

Original content from this work may be used under the terms of the Creative Commons Attribution 3.0 licence.
Any further distribution of this work must maintain attribution to the author(s) and the title of the work, journal citation and DOI.
Introduction
Primary forests play a crucial role in ecosystem services, including carbon sequestration, climate and water cycle regulation, and maintenance of biodiversity (Gibson et al 2011, Barlow et al 2007). Humid tropical forests play a disproportionate role in the provision of these services compared to other forested biomes (Daily 1997). However, increasing rates of tropical forest cover loss due to land use change threatens the continued functioning of many of these services (Achard et al 2014). For example, tropical deforestation accounts for 10%–15% of anthropogenic greenhouse gas emissions (Houghton 2013) and replacement land uses such as pasture are often sources of additional emissions (Galford et al 2010). Primary humid tropical forests have the highest biodiversity of terrestrial ecosystems and resulting disproportionate risk of biodiversity loss (Betts et al 2017) and are deemed irreplaceable in terms of conservation value (Gibson et al 2011). As a result, tropical forests are a target of many policy initiatives, for example the United Nations Framework Convention on Climate Change (UNFCCC) Reducing Emissions from Deforestation and forest Degradation (REDD+) program.
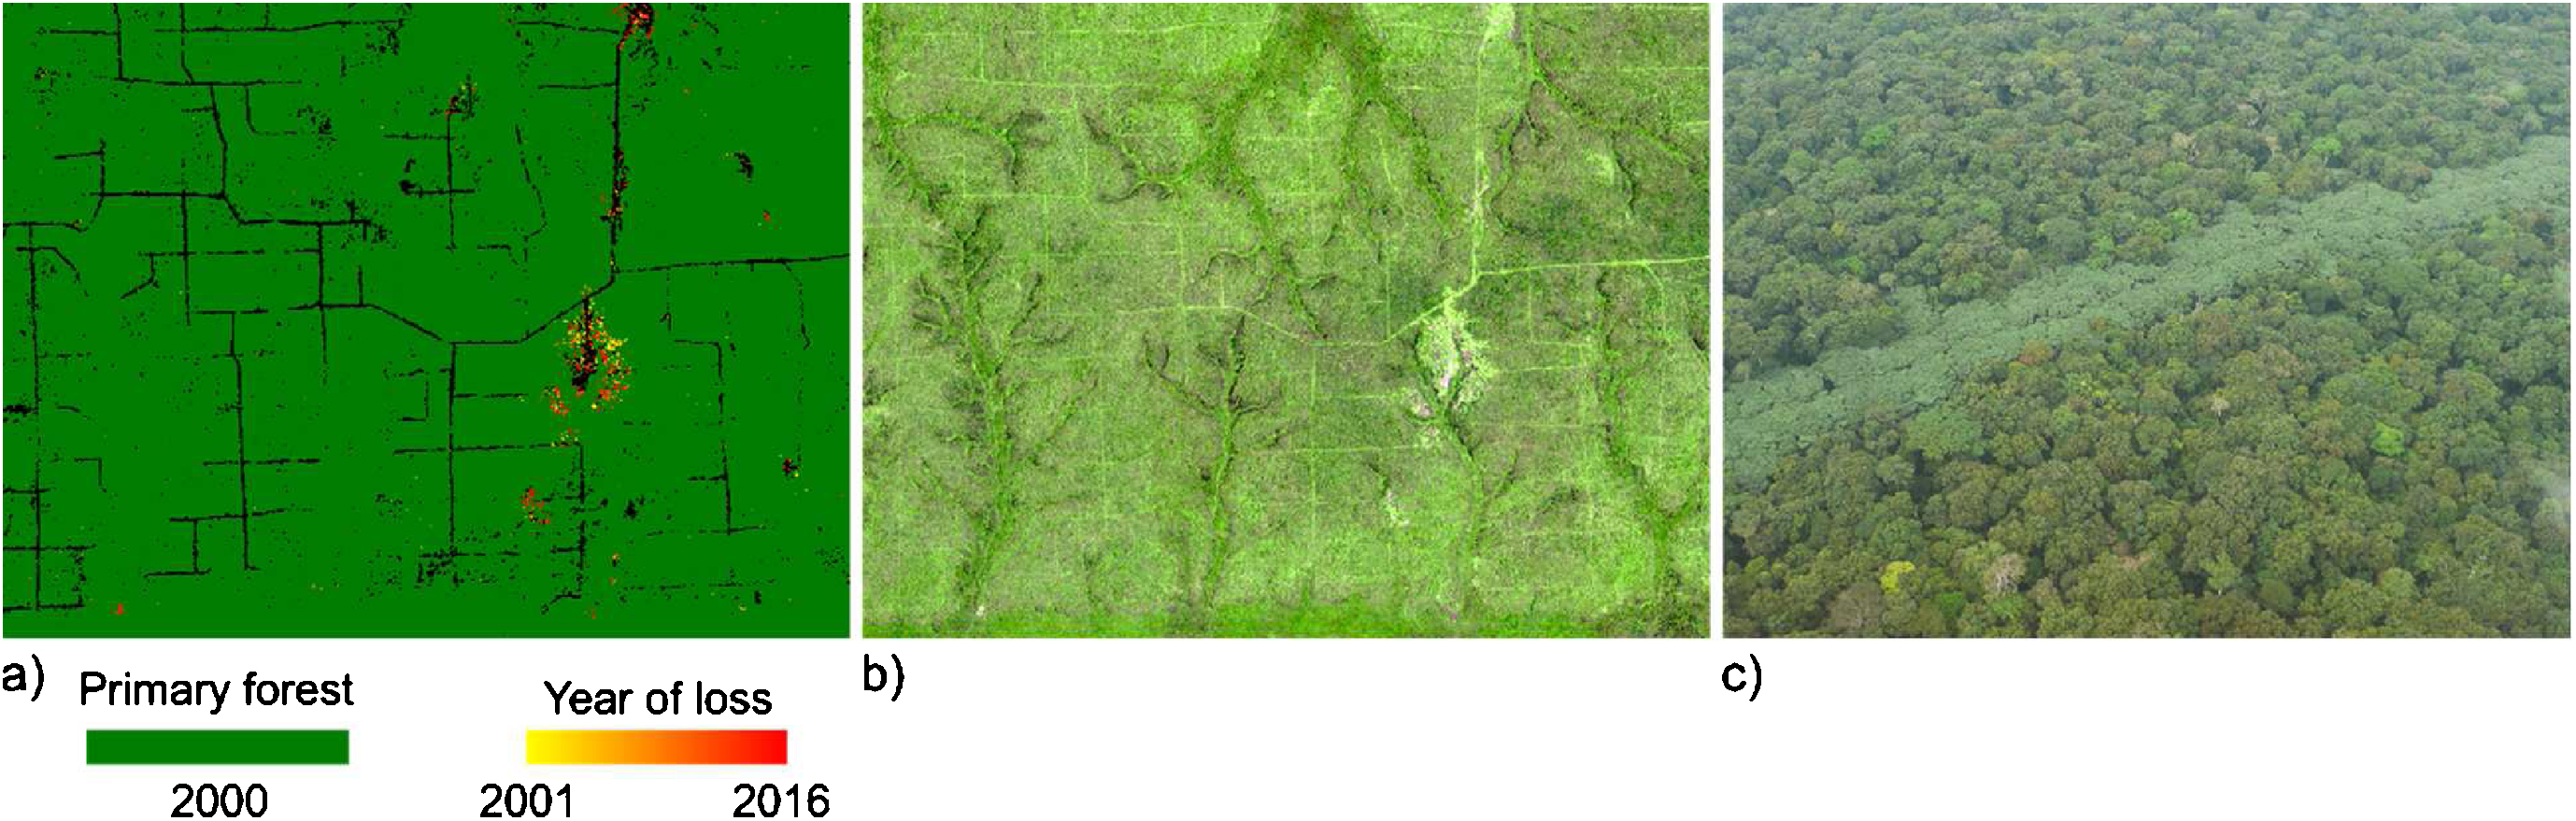
Figure 1. Subset of defunct logging concession from the 1970s–80s in what was then Zaire, now DRC: (a) 2000 primary forest map and loss through 2016, (b) 2016 Landsat false color image of swir1-nir-swir2 bandwidths in red-green-blue combination, and (c) an aerial photograph of primary forest bisected by a concession logging road with regrown secondary forest. Subset is 30 km by 22.5 km centered at 20d59'E, 1d15'N (photo from 2010, courtesy of Chris Justice, University of Maryland).
Download figure:
Standard image High-resolution imageHere, we report on primary humid tropical forest extent in 2001, and primary forest loss and distance to loss from 2002 through 2014 in the three largest tropical forest countries: Brazil, Democratic Republic of Congo and Indonesia. Primary forest is defined as mature natural humid tropical forest cover that has not been completely cleared and regrown in recent history. Our definition of primary forest loss consists of all stand-replacement disturbances at a 30 m spatial resolution, including many associated with degradation dynamics such as road building, intensive logging and severe fire. We define intact primary forests as primary forests having no detectable signs of human-caused alteration or fragmentation, as delineated per the intact forest landscape (IFL) method (Potapov et al 2017). Primary forests outside of IFLs include mature humid tropical forests that have experienced partial canopy loss at the 30 m mapped spatial resolution, or are located in proximity to forest loss, or that exist as fragments that do not meet IFL criteria. Examples include effects of selective logging or other disturbances that may have altered forest composition and structure (Margono et al 2012, ITTO 2002). Such forests may be able to recover core ecosystem services, for example biomass and habitat for biodiversity after selective logging (Gourlet-Fleury et al 2013, Morgan et al 2017). Importantly, primary forests are directly observable in the 30+ year medium spatial resolution (30 m) satellite record, allowing for synoptic assessments of extent and change not viable using other data sources or methods. Figure 1 illustrates the mapping of primary forests per our definition for an example in the DRC. In figure 1(a), logging roads and sites of intensive timber extraction predating the study period are not mapped as primary forest. Limited primary forest loss due to smallholder agriculture within the inactive concession is contemporaneous with the study period (figures 1(a) and (b)). Figure 1(c) shows regrowing tree cover of an abandoned logging road within the concession, an example of tree cover excluded from our definition of primary forest.
In satellite images, primary humid tropical forests feature low albedo and high texture, both due to tall, differentiated canopy structure. Natural regeneration (<30–50 years) and forestry land uses are readily discriminated in satellite imagery due to different and more uniform spectral signatures than those found in primary forests. From visual interpretation and algorithm implementation perspectives, these signatures can be used to identify and map the extent of primary forests. Several primary forest maps exist and are used to provide context for tracking spatial and temporal trends in forest loss. For example, the Brazilian Space Agency's PRODES deforestation product relies on a static reference map of humid tropical primary forest extent within the Legal Amazon (Shimabukuro et al 2012). Other similar products exist (Potapov et al 2012, Margono et al 2014), but there is no standard, synoptic pan-tropical reference for humid tropical forests. Such a layer would be a useful reference for quantifying loss of these uniquely high carbon stock, high conservation value forests. For example, the Roundtable on Sustainable Palm Oil mandates that 'that no new primary forests or high conservation value areas have been cleared for palm oil production since November 2005' (RSPO 2011). Verifying such commitments will require objective, science-based reference data on high conservation value forest extent and loss.
The methods implemented here build on the PRODES approach by mapping primary forest extent and overlaying it with available global forest loss data (Hansen et al 2013). Following good practice methods as defined by the IPCC (IPCC 2006, GFOI 2016), maps are used to allocate a probability sample of reference data for area estimation (Tyukavina et al 2015). Sample-based analyses result in unbiased estimates of the mapped land cover themes (Stehman 2013, Olofsson et al 2014). Precision of the estimates allows for reporting annual trends of forest loss. Given sufficient accuracy, the primary forest extent and loss maps are suitable for spatial analyses, and we also quantify changes in distance of extant forest to loss. The measure is similar to a forest attrition distance (Yang and Mountrakis 2017), but here we examine annual change and trends in the dispersal or concentration of primary forest loss area in relation to extant primary forest. Three measures are reported over the study period: primary forest extent, loss, and distance of forest to loss. Results for the study are available at http://glad.umd.edu/dataset/primary-forest-humid-tropics.
Methods
Primary humid tropical forest extent for the year 2001
A year 2001 primary forest extent map was created using Landsat composites and multi-temporal metrics as input data (see supplementary materials available at stacks.iop.org/ERL/13/074028/mmedia for data description) to a supervised classification, a method first prototyped for DRC (Potapov et al 2012) and Indonesia (Margono et al 2014). Landsat inputs were the independent variables related to a set of expert-interpreted training data consisting of pixels labeled as primary forest and not primary forest. Brazil, DRC and Indonesia were characterized separately due to floristic and structural differences between humid tropical forests in the Amazon Basin, Congo Basin and insular Southeast Asia. For example, primary forests in the Amazon exhibit hyperdominance of a relative few species, a disproportionate number of which are palms (ter Steege et al 2013). Palms have a more uniform canopy, resulting in a different spectral response of primary forests compared to other regions. As a result, median near infrared reflectance is higher in Brazil's primary forests compared to DRC, which has few palms. Insular Southeast Asian forests are the tallest (Banin et al 2012) of the three regions, making reflective bands darker than the other forest massifs. Median red reflectance of primary forests in Indonesia is lower than those of Brazil and DRC. On the other hand, tree cover outside of primary forests is also different between regions. Secondary forests and palm estates with high near infrared signatures are more prominent in DRC and Indonesia, respectively, than in Brazil. Due to these factors, mapping each forest realm separately facilitated characterization.
Algorithm implementation for each region consisted of a seven bagged classification tree models. Classification tree models employ an entropy measure, or deviance, to recursively split a population of labeled classes into successively purer, more homogeneous subsets. The median per pixel probability of the seven models was used to label each pixel; a 50% probability threshold was employed to assign the final primary forest or not label. The algorithm was iterated in active learning mode, with training added to correct errors in each iteration. Some forest formations could not be identified using the per-pixel classifier, but could be identified in photo-interpretive contexts. Upon completion of the per country algorithm implementations, a limited hand-editing of each classification was performed to remove inseparable land covers, such as older plantations, observable through shape, landscape context, and other visually interpretable attributes. Primary forests were subsequently differentiated into intact and non-intact subclasses using an overlay of the IFL map for the year 2000 (Potapov et al 2008). In the humid tropics, IFLs represent large, contiguous blocks of primary forest removed from human activity having a (1) minimum area of 50 000 hectares, (2) minimum patch width of 10 km, and (3) minimum corridor/appendage width of 2 km. As such, they are a subset of our primary forest class, which also consists of smaller primary forest fragments and primary forests closer to and within zones of human activity and disturbance.
Primary humid tropical forest loss
Forest cover loss data were subset from the global product and overlaid with the year 2001 primary forest extent map to identify areas of forest loss for the 2002 to 2014 interval. Primary forest loss and no loss pixels were used to create a set of strata for probability sampling of reference data. Per good practice guidance, the reference data were used to estimate the area of annual primary forest loss for Brazil, DRC and Indonesia (Stehman 2013, Olofsson et al 2014). In interpreting reference data, loss was defined as a canopy disturbance that resulted in greater than 50% of humid tropical forest canopy removal at the 30 m pixel scale.
Sample-based area estimation
A stratification for sample-based area estimation of primary forest extent and loss was created using the 2001 extent and 2002–2014 loss layers. The strata per country were defined as follows: stratum 1-primary forest with no change from 2002–2014; stratum 2-primary forest loss from 2002–2014; stratum 3-one pixel buffer around primary forest loss; stratum 4-not primary forest and forest loss outside of one pixel buffer around primary forest loss. The sampling unit was one 30 m Landsat pixel. Interpretation templates for all samples, consisting of Landsat annual composite thumbnails, graphs of annual maximum and minimum Normalized Difference Vegetation Index (Tucker 1979) values, and kml links to GoogleEarth, may be viewed at https://glad.umd.edu/dataset/primary-forest-humid-tropics. Sample allocation is neither proportional nor equal across strata, but applied in order to characterize annual forest loss area per country with a reasonably low uncertainty (table 1). To achieve this, more sample pixels were allocated to the loss stratum to target likely areas of loss. Previous studies (Tyukavina et al 2013, 2015) revealed the value of a buffered loss stratum to include likely areas of false negatives, improving area estimation. Our choice of a one pixel buffer is based on the results of Tyukavina et al who found over 95% of false negatives to be located in pixels adjacent to mapped loss.
Table 1. Sample allocation per country per mapped stratum of 30 m sample pixels.
| Brazil | DRC | Indonesia | |
|---|---|---|---|
| Strata | Number of sample pixels (nh) | ||
| Mapped primary forest (no loss) | 447 | 248 | 278 |
| Mapped primary forest loss | 840 | 420 | 420 |
| One pixel buffer of mapped primary forest loss | 208 | 109 | 100 |
| Outside primary forest (no loss) | 705 | 323 | 302 |
| Total | 2200 | 1100 | 1100 |
The following equations were used to estimate the area of primary forest extent in the year 2001 and the annual area of loss for the years 2002–2014 for each country (Stehman 2013, 2014):
where  —estimated area of primary forest loss;
Atot—total area of the country;
yu = 1 if a sample pixel u is interpreted as 'primary forest in year 2001' or 'primary forest loss in year 20XX', and yu = 0 otherwise;
 , the sample mean of the yu values in stratum h;
H—number of sampling strata;
nh—sample size (number of sample pixels) in stratum h;
nh—total number of pixels in stratum h;
N—total number of pixels within the country.
The standard error of the sample-based estimate of primary forest extent and annual loss area was estimated using the following equation:
Sample interpretation results were also used to assess the accuracy of the primary extent and loss maps.
Distance to loss
Numerous studies have quantified increasing fragmentation of tropical forests over time, employing spatial metrics such as fragment size distribution and distance to forest edge, with deleterious effects for biodiversity and ecosystem processes (Taubert et al 2018, Haddad et al 2015, Qie et al 2017). For example, selective logging has been shown to facilitate accessibility and risk of fire within previously intact forests (Asner et al 2005, Broadbent et al 2010). We posit our primary forest extent map to be a thematic advance over tree cover, the typical input to recent tropical forest fragmentation studies (Taubert et al 2018, Haddad et al 2015). As an example application to complement forest loss area estimation, we employed the mapped primary forest extent and annual loss layers to quantify the remoteness of primary forests from loss for Brazil, DRC and Indonesia through 2015. The measure is a first order examination of the spatial pattern of primary forest cover loss and is not meant as an assessment of land use drivers, habitat fragmentation, or biodiversity (Haddad et al 2015). Specifically, the minimum distance of each extant primary forest pixel to annual primary forest cover loss pixels was calculated and averaged per year per country. Its derivation is graphically illustrated in figure 2. The measure represents a relative threat indicator of current, ongoing primary forest clearing to the remaining natural forest resource, as it relies on distance to annual forest loss as the measure against which existing primary forest is assessed. To avoid the impact of isolated commission errors, only primary forest loss areas greater than or equal to 0.5 ha were included as reference in calculating distance to primary forest. Per pixel distances of all extant primary forest to nearest primary forest loss are ranked and reported by quartiles for each year. The presented measure is a complement to the area estimates of primary forest extent and loss and meant to emphasize the need to place area of primary forest loss within a spatially explicit context. As previously noted, both primary forest extent and loss map layers are available for more traditional and exhaustive analyses of primary forest fragmentation.
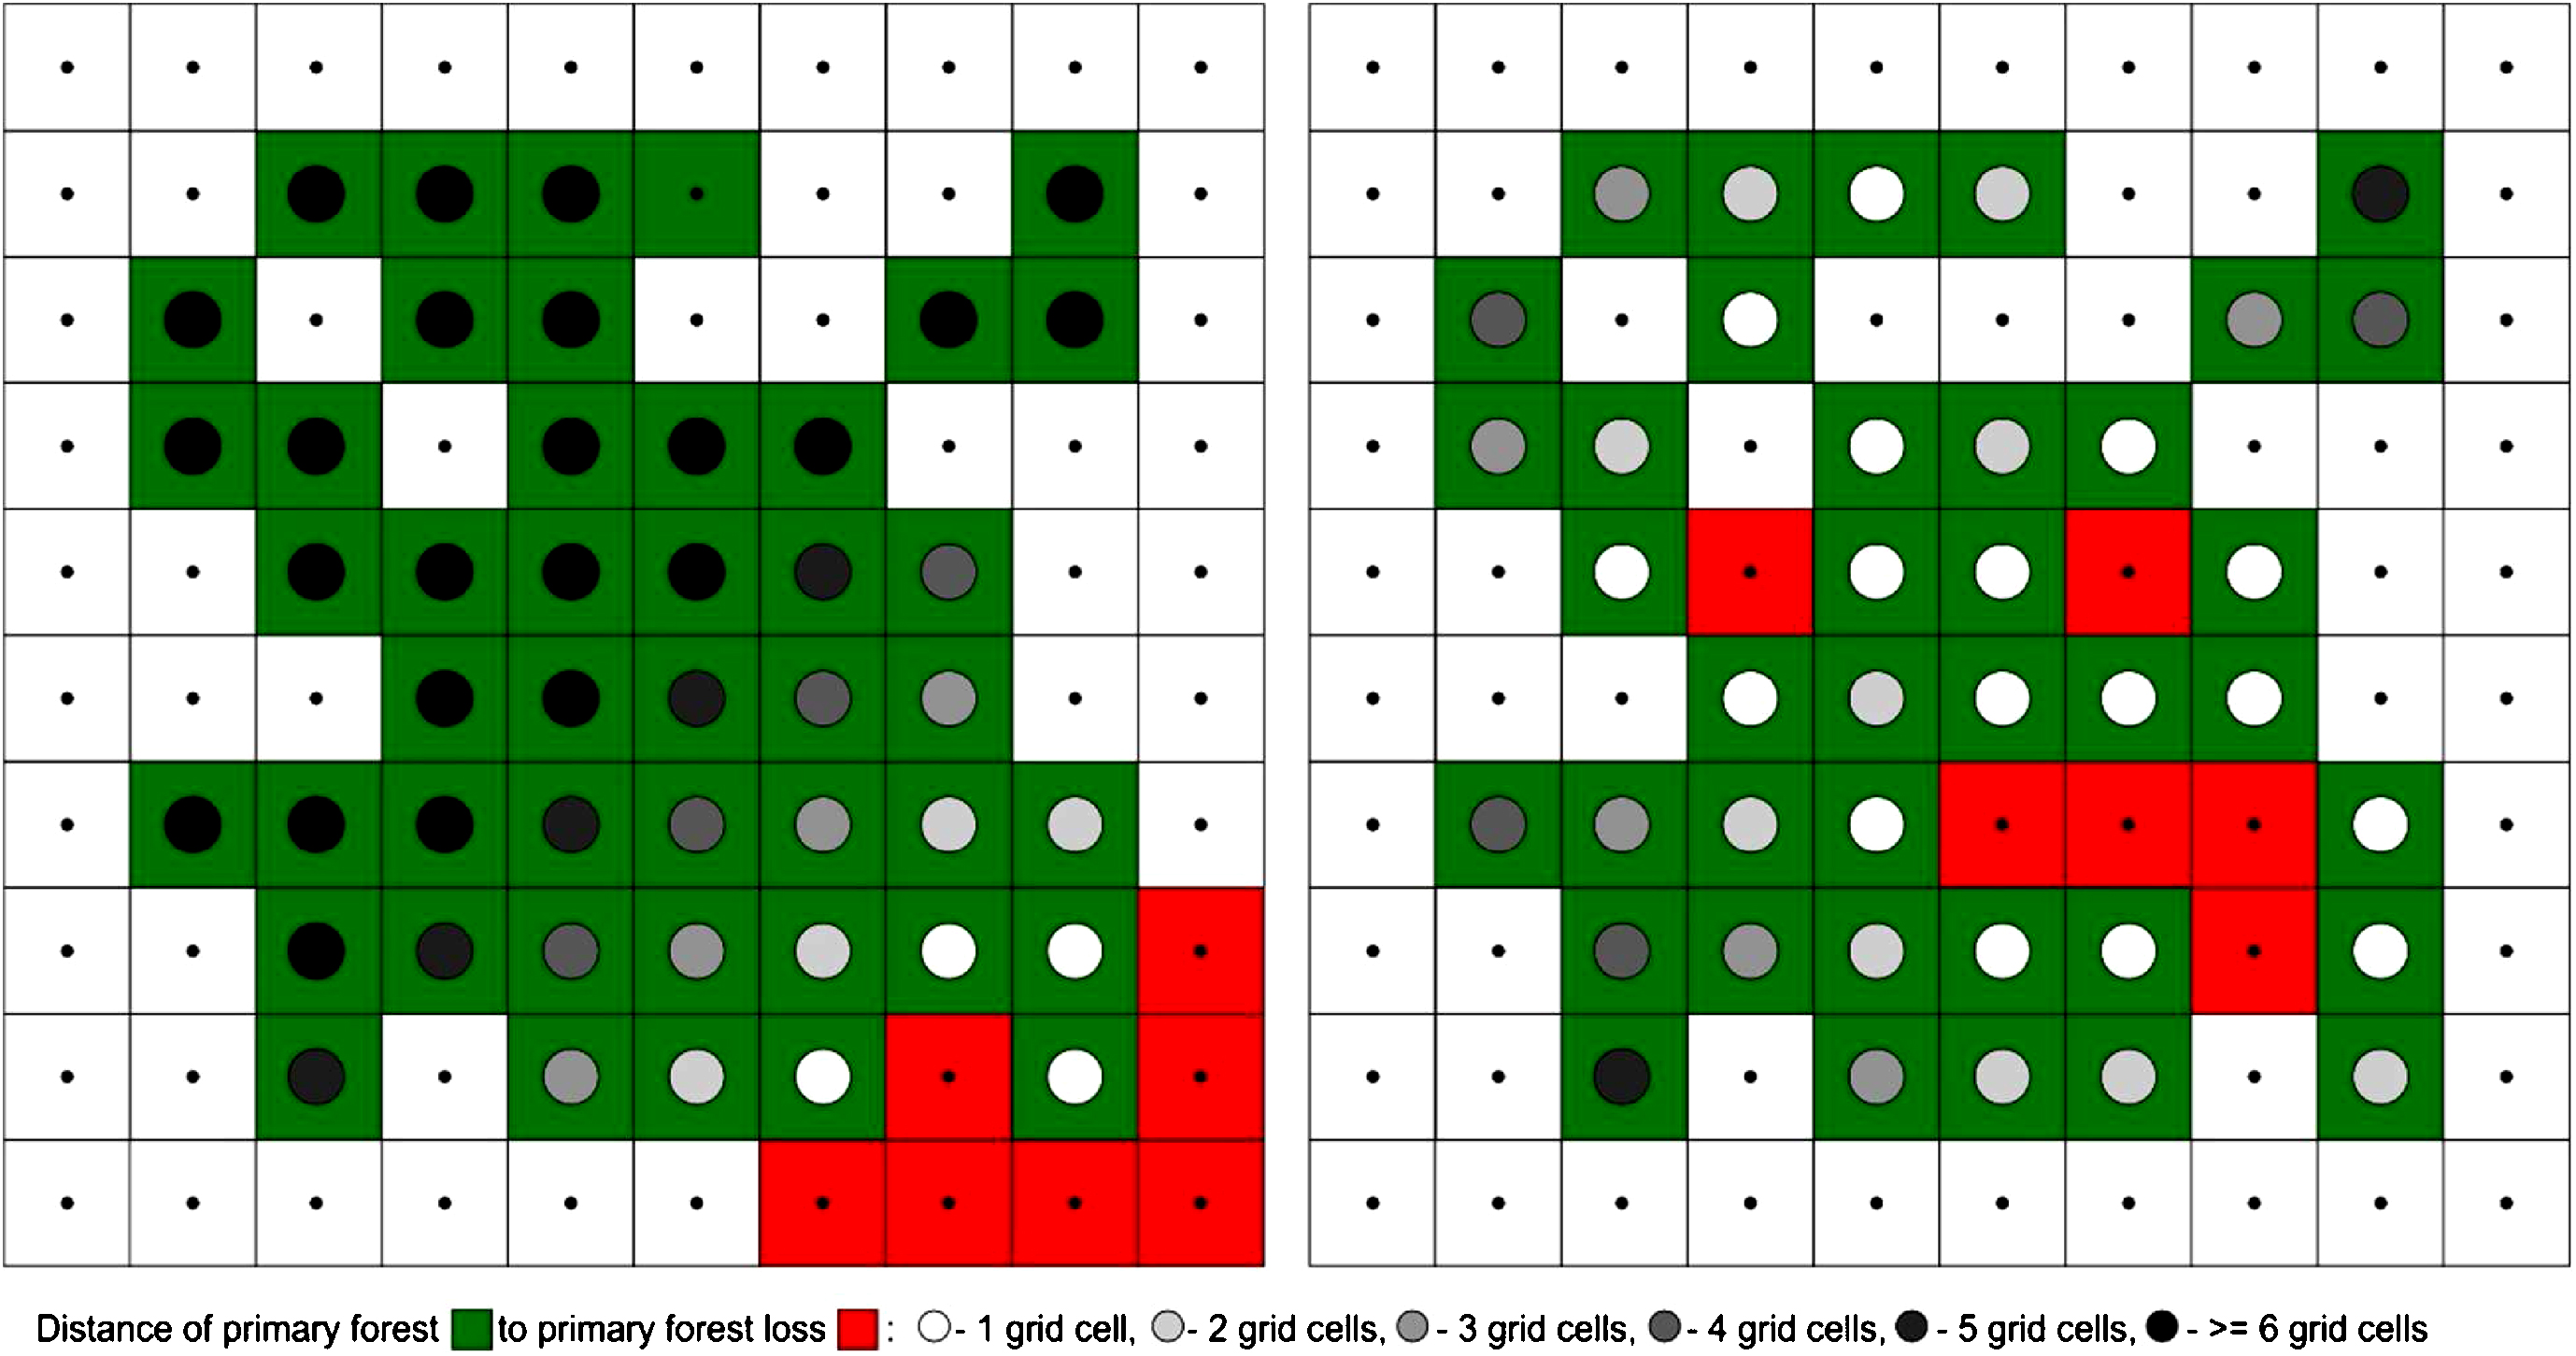
Figure 2. Distance of extant primary forest to primary forest loss. Two successive years of extant primary forest in green and annual primary forest loss in red are illustrated. On the left, concentrated forest loss results in an average distance of primary forest loss to extant primary forest of 4.5 grid cells. The percent of forest loss equals 13.2% (7/53). On the right, in the modeled subsequent year, distance of forest loss to extant forest is reduced to 1.8 grid cells due to a greater spread of forest loss. The gross forest loss is the same as the previous year (seven grid cells), while the percent loss increased to 15.2% (7/46).
Download figure:
Standard image High-resolution imageResults
Map accuracy and sample-based area estimates
Spatial accuracy of mapped primary forest extent is shown in table 2. Results illustrate a very accurate characterization of primary forest extent in 2001. The lowest user's accuracy of 99.02%, reflecting commission error, is found in the DRC map. The lowest producer's accuracy of 96.43%, reflecting omission error, is found in the Indonesia primary forest map. The very high accuracy values result in similar mapped and sample-based area of 2001 primary forest extent (underestimates of 0.6%, 2.1%, and 2.6%, for Brazil, DRC and Indonesia, respectively). Given the results of the accuracy assessment, the primary forest maps are a suitable reference layer for tracking forest loss within high conservation value forests. Sample-based primary forest area totaled 3.455M, 1.044M and 0.969M km2 for Brazil, DRC and Indonesia, respectively. Sample-based primary forest cover loss totaled 0.191M, 0.036M, and 0.077M km2 for Brazil, DRC and Indonesia, respectively. Unlike primary forest extent, mapped primary forest loss is biased compared to sample-based primary forest loss, with underestimates of 14%, 27% and 10% for Brazil, DRC and Indonesia, respectively. All countries have high user's accuracies and comparatively low producer's accuracies, with DRC having the lowest producer's accuracy. The finer-scale forest clearing dynamic in DRC due to smallholder agriculture compared to agro-industrial land uses in Brazil and Indonesia are more challenging to successfully characterize (Tyukavina et al 2013, 2015). Results from the sample-based assessment of annual primary forest loss are shown graphically in figure 3 and in tabular form in supplementary table S1.
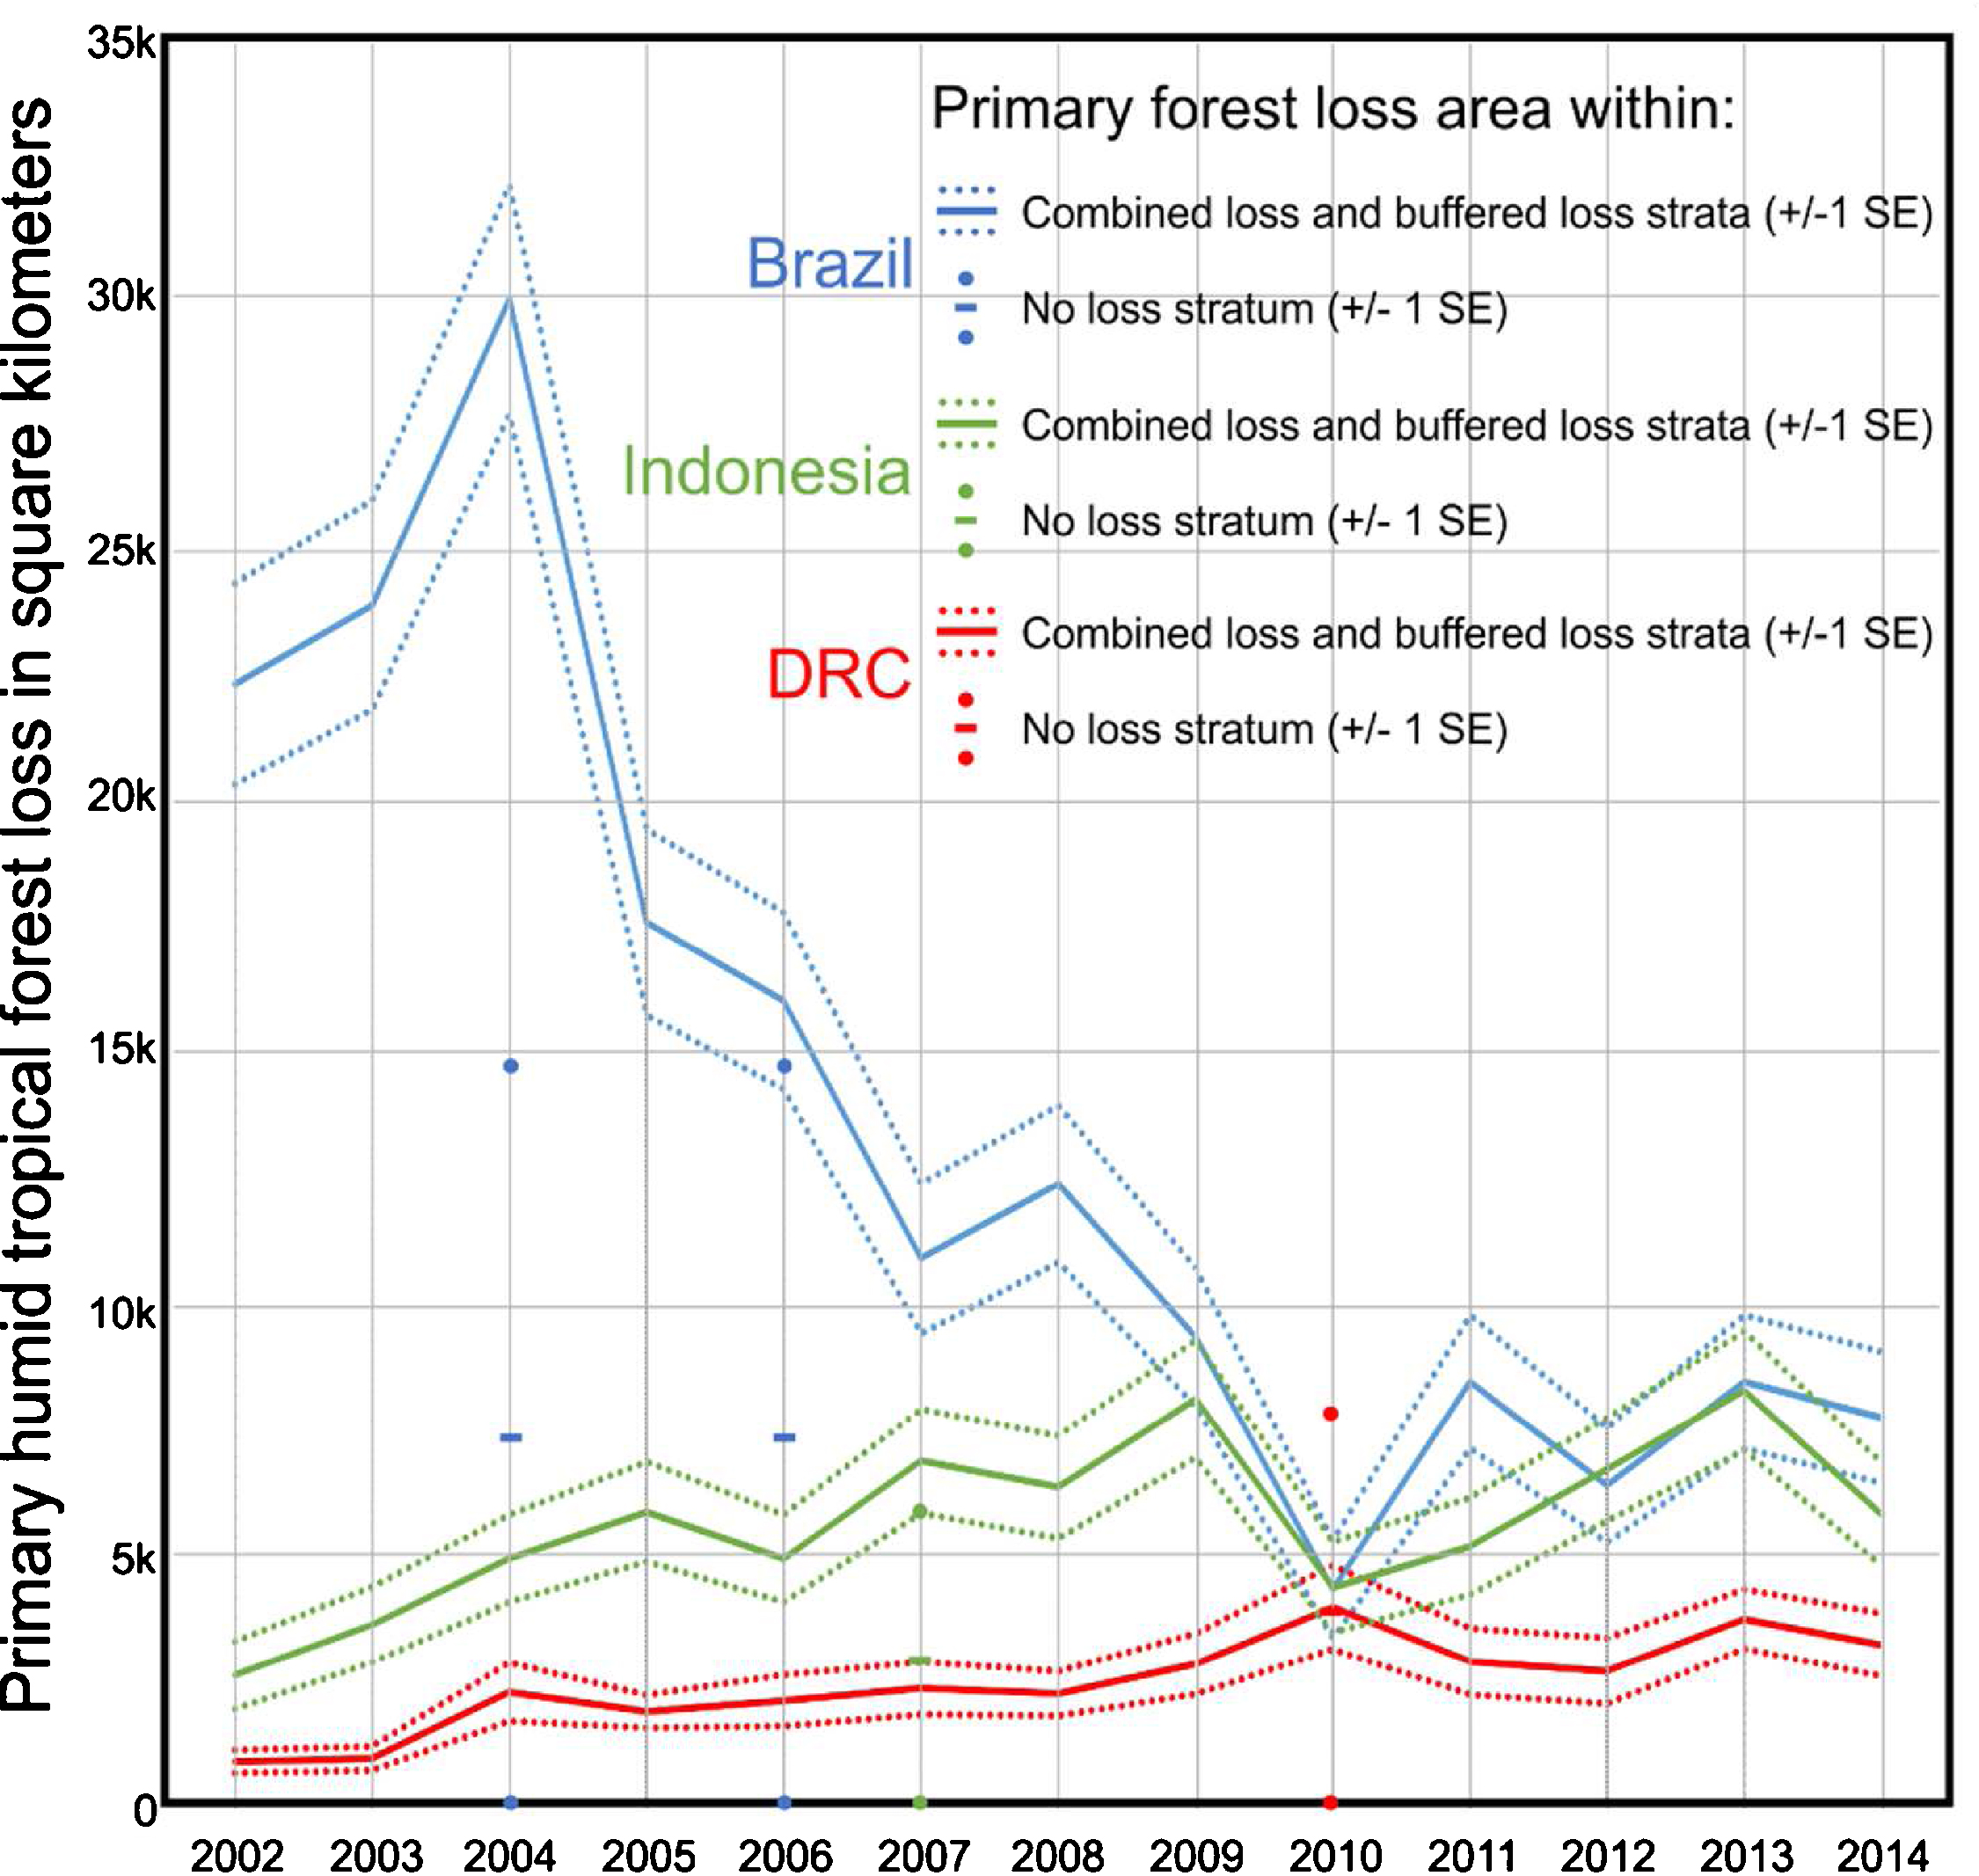
Figure 3. Estimated annual sample-based primary humid tropical forest loss area and associated uncertainty for combined 'loss' and 'buffered loss' strata (line graphs) and the estimated loss area coming from single sample pixels identified as 'loss' within 'no loss' stratum (points). For all other annual graphics, loss area from the 'no loss' stratum was averaged over all years and added to the annual combined 'loss' and 'buffered loss' strata totals. Sample pixels from the 'no loss' strata identified as 'loss' during sample interpretation are rare map omission errors unrepresentative of trends within the time-series.
Download figure:
Standard image High-resolution imageTable 2. Accuracy of 2001 primary forest extent and loss maps.
| Primary forest | Loss of primary forest | |||||
|---|---|---|---|---|---|---|
| Overall accuracy (SE) | User accuracy (SE) | Producer's accuracy (SE) | Overall accuracy (SE) | User accuracy (SE) | Producer's accuracy (SE) | |
| Brazil | 98.43 (0.36) | 99.28 (0.36) | 96.84 (0.78) | 98.68 (0.30) | 95.83 (0.69) | 80.34 (4.23) |
| DRC | 98.02 (0.54) | 99.02 (0.40) | 96.65 (1.07) | 98.41 (0.41) | 86.43 (1.67) | 63.21 (7.49) |
| Indonesia | 98.06 (0.54) | 99.45 (0.33) | 96.75 (0.98) | 98.15 (0.36) | 97.57 (0.76) | 86.21 (3.71) |
Table 3. Sample pixels identified as long-lived natural forest loss per country by 1-no loss stratum, 2 loss stratum, and 3 buffered loss stratum. Similar to equation (1), nh denotes sample size (number of sample pixels) in each stratum, and nh—total number of pixels per stratum. Combined area of strata 1–3 (Atot) is 3.43 M km2 for Brazil, 1.05 M km2 for DRC, and 0.94 M km2.
| Strata | 2002 | 2003 | 2004 | 2005 | 2006 | 2007 | 2008 | 2009 | 2010 | 2011 | 2012 | 2013 | 2014 | nh | nh | |
|---|---|---|---|---|---|---|---|---|---|---|---|---|---|---|---|---|
| BRA | 1 | 0 | 0 | 1 | 0 | 1 | 0 | 0 | 0 | 0 | 0 | 0 | 0 | 0 | 447 | 4205610251 |
| 2 | 106 | 111 | 139 | 76 | 71 | 45 | 54 | 40 | 16 | 34 | 28 | 34 | 26 | 840 | 215764902 | |
| 3 | 5 | 7 | 9 | 9 | 7 | 7 | 6 | 5 | 4 | 6 | 3 | 6 | 9 | 208 | 78718516 | |
| DRC | 1 | 0 | 0 | 0 | 0 | 0 | 0 | 0 | 1 | 0 | 0 | 0 | 0 | 0 | 248 | 1285190306 |
| 2 | 14 | 15 | 22 | 30 | 24 | 28 | 31 | 31 | 30 | 27 | 24 | 50 | 37 | 420 | 33969359 | |
| 3 | 0 | 0 | 3 | 0 | 2 | 2 | 1 | 3 | 7 | 4 | 4 | 2 | 3 | 109 | 41867580 | |
| IND | 1 | 0 | 0 | 0 | 0 | 0 | 1 | 0 | 0 | 0 | 0 | 0 | 0 | 0 | 278 | 1097924392 |
| 2 | 14 | 22 | 30 | 32 | 30 | 40 | 35 | 42 | 21 | 26 | 39 | 43 | 28 | 420 | 89946886 | |
| 3 | 1 | 0 | 0 | 2 | 0 | 1 | 2 | 4 | 3 | 3 | 1 | 4 | 4 | 100 | 39288182 | |
Sample pixels identified as 'primary forest loss' distributed annually per stratum are shown in table 3, with sufficient sampling density to estimate annual loss for the 'loss' and 'buffered loss' strata, but not the 'no loss' stratum. For the 'loss' stratum, sample pixels of no forest loss represent map commission errors. For 'buffered loss' and 'no loss' strata, forest loss sample pixels represent map omission errors. The 'no loss' stratum has a single primary forest loss sample pixel each in the DRC and Indonesia and two in Brazil. These rare, but inordinately weighted sample pixels, account for 7%, 11% and 4% of total primary forest loss area over the study period for Brazil, DRC and Indonesia, respectively. Given their rarity, they do not allow for annual disaggregation of loss within the 'no change' stratum. To assess trends, we employ only the 'loss and 'buffered loss' strata, while keeping the area coming from the isolated loss sample pixels from the 'no loss' stratum separate (figure 3). By adding the 'no loss' area estimates proportionally to the annual trend from figure 3 and regressing loss versus year, we estimate an average annual decrease over the study period of 1913 km2 per year for Brazil and respective increases of 224 km2 and 277 km2 for DRC and Indonesia. Per stratum, per year primary forest loss area estimates are shown in supplementary materials table S1.
Distance of extant forest to forest loss
While the results of the primary forest reference mask reflect a highly accurate map product, mapped forest loss is underestimated (table 2); however, the vast majority of estimated loss occurs within the 'loss' and 'buffered loss' strata (93%, 89%, and 96% for Brazil, DRC and Indonesia, respectively). From a user's perspective, the map is a valid spatial representation of primary forest loss and a useful input to geospatial analyses. Quartiles of primary forest pixel populations' distance to primary forest loss by year are plotted in figure 4 and shown in supplementary materials table S2. All three countries experienced increasing encroachment of forest loss, particularly for remote forests. Brazil's most distant forests (Q3 in figure 4) were on average 15 km farther removed from contemporaneous loss than either DRC or Indonesia. This quartile for Brazil experienced the highest average decline over the study period (0.56 km yr−1), comparable to DRC (0.53 km yr−1) and much greater than Indonesia (0.16 km yr−1). The distance of primary forests nearest to loss (Q1 in figure 4) increased for Brazil. Supplementary figure S1 illustrates a model for Brazil reflecting the general compression of the distance to loss measure over the study period. The increase in Q1 can be attributed to the establishment and general maintenance of protected areas and the policy-driven reduction of clearing along the arc of deforestation. The most remote forests in DRC (Q3 in figure 4) were over 20.4 km removed from loss in 2001. By 2015, the most distant forests were only 13.5 km from loss, a 34% decrease. For this quartile, DRC's reduction in forest remoteness as a fraction of area of primary forest loss is over five times that of Brazil, and seven times that of Indonesia.
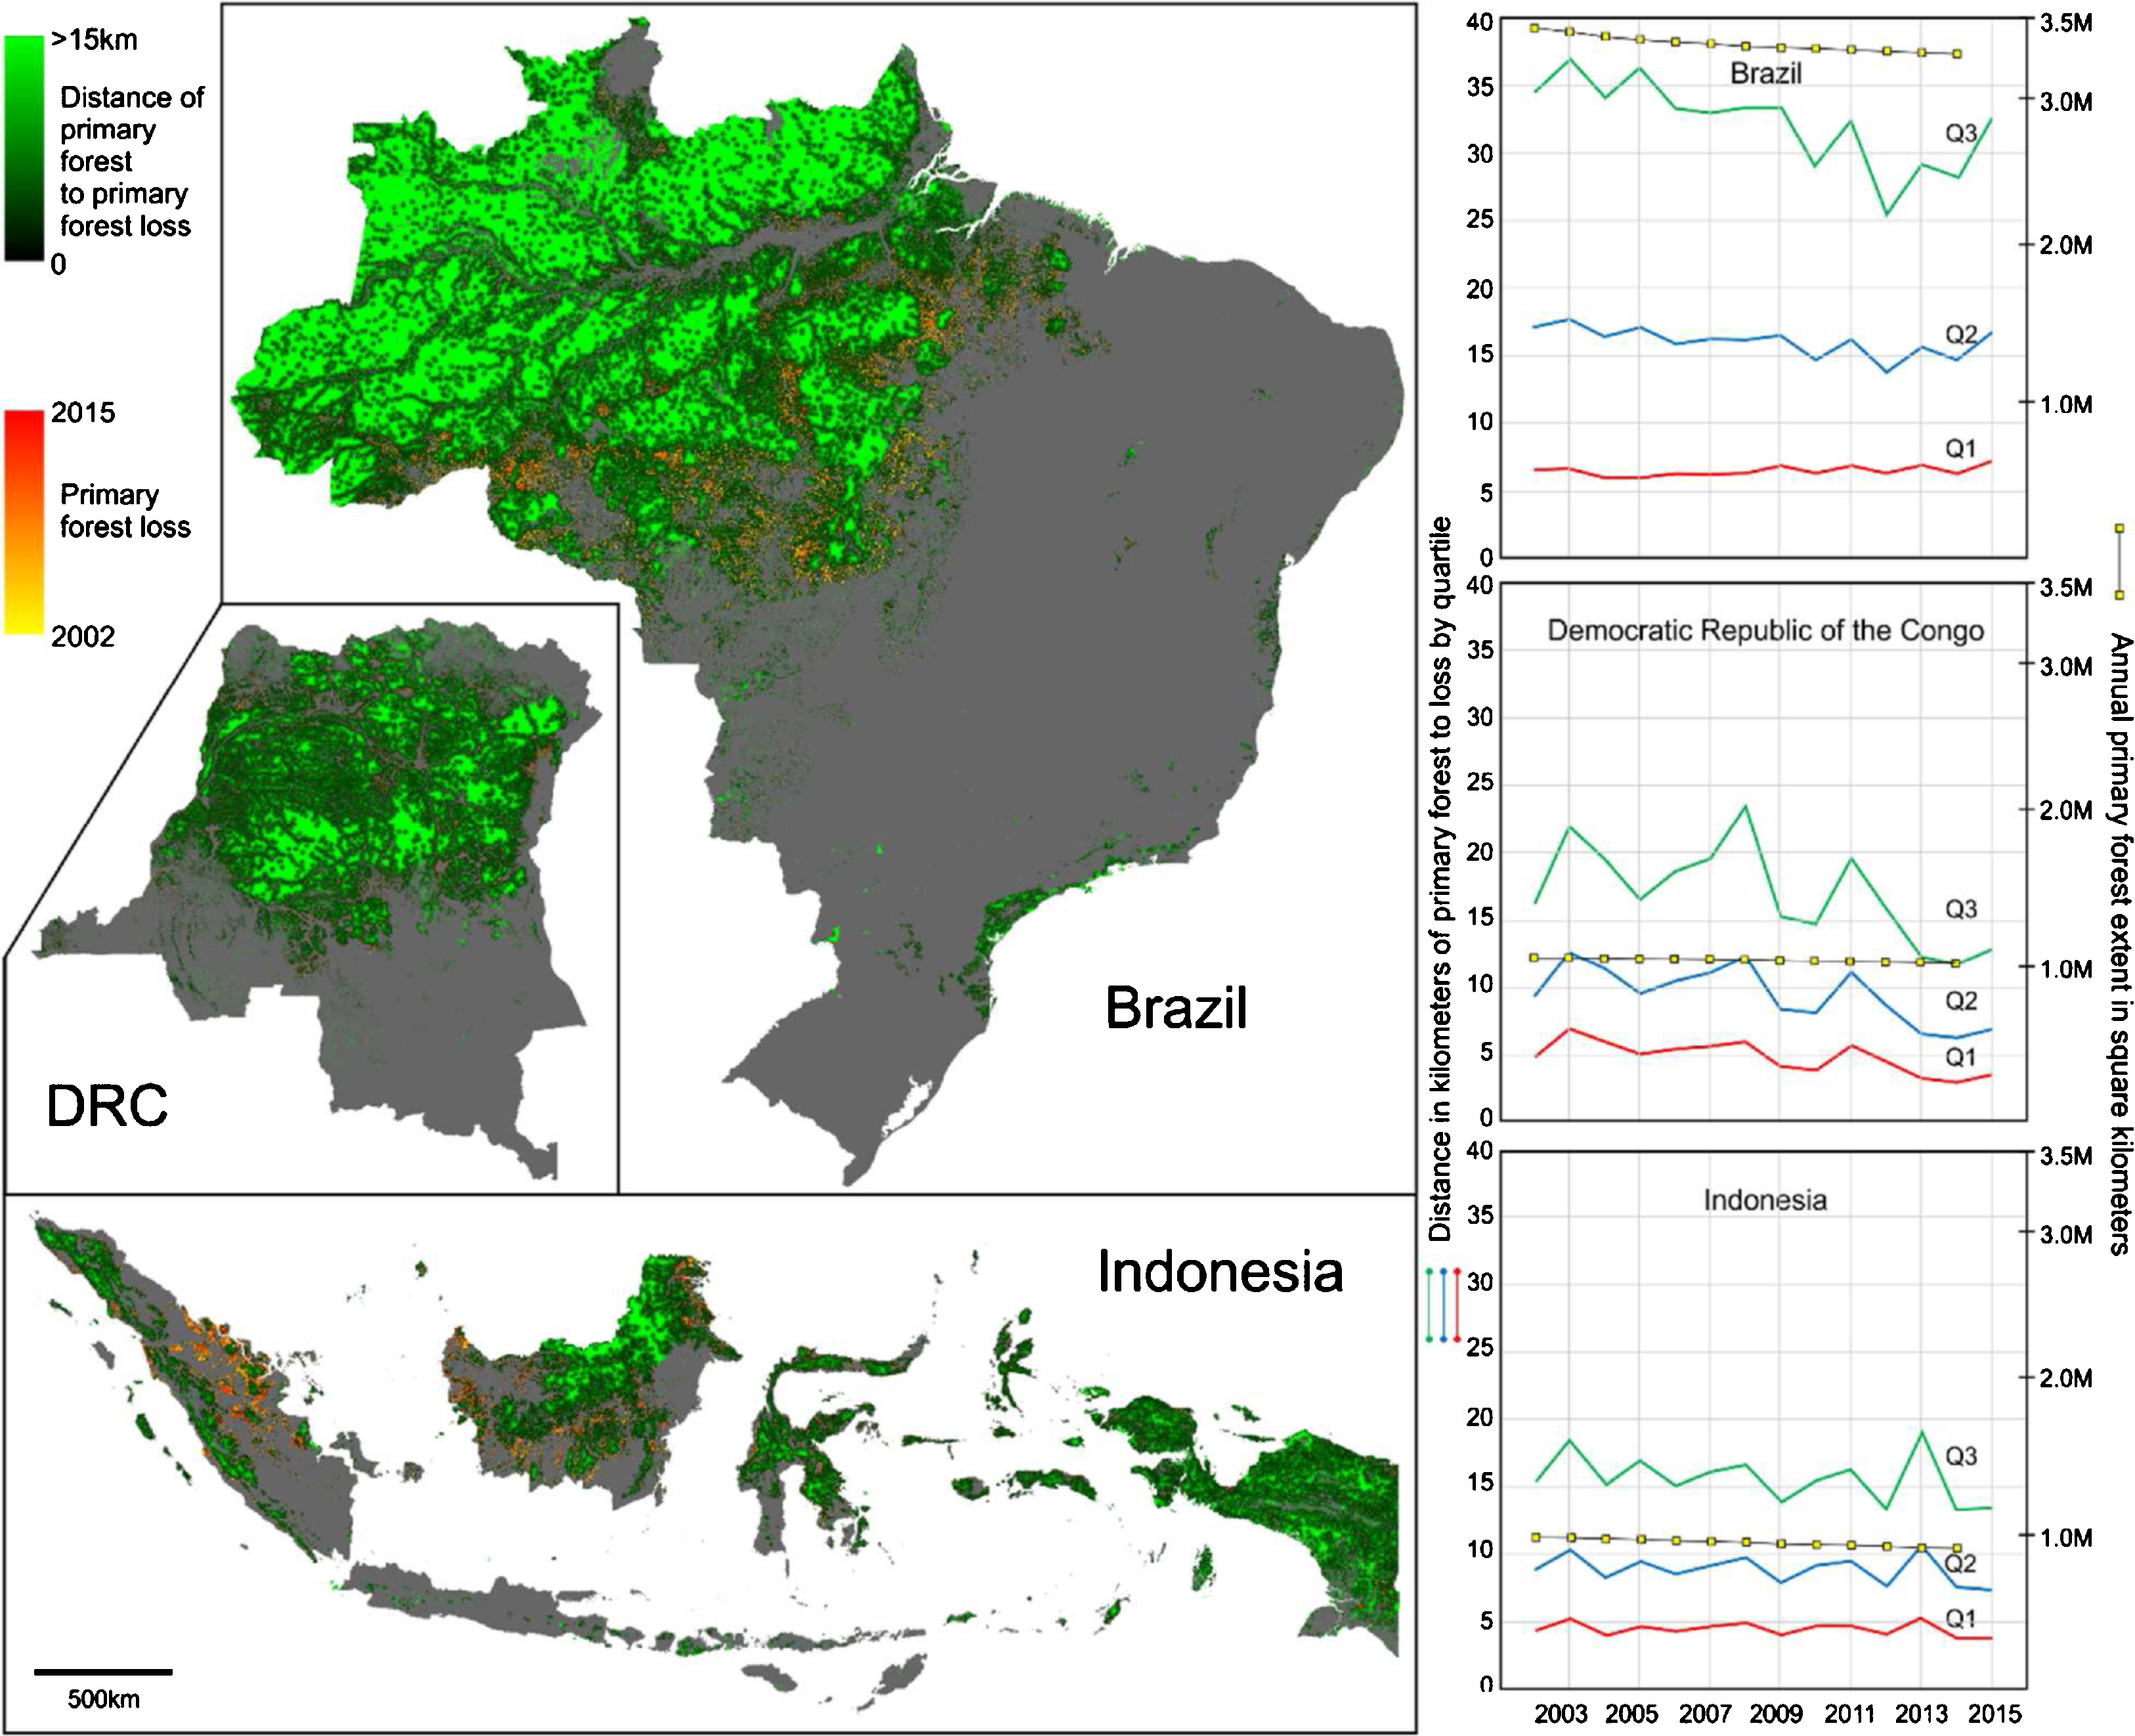
Figure 4. On the left, a summary map showing distance of 2016 primary forest to cumulative primary forest loss from 2002–2015 for loss patches of 0.5 ha and greater. On the right on the x-axis, distance of extent primary forest to annual loss by quartile. Distances of remaining primary forest pixels to loss pixels are calculated per year and distances ranked as follows: Q3 (green) = the quartile defining the 25% most distant primary forest pixels (75%), Q2 (blue) = the quartile defining the median distance of primary forest pixels (50%), and Q1 (red) = the quartile defining the 25% closest primary forest pixels (25%). On the right on the y-axis, annual primary forest extent from 2002–2014 derived from a reference sample.
Download figure:
Standard image High-resolution imageComparison to ancillary height and biomass data
Figure 5 shows the areal extent of >=75% tree canopy cover (Hansen et al 2013) divided into primary forest and other dense tree cover categories for Brazil, DRC and Indonesia. Other dense tree cover in Brazil consists largely of degraded natural tree cover formations in the northeast and coastal Brazil, as well as plantations. DRC's other dense tree cover is principally secondary regrowth within landscapes of shifting cultivation. Indonesia has the highest percentage of other dense tree cover in the form of forestry plantations and palm estates. Table 4 shows the per country mean height (Baccini et al 2012) and aboveground biomass (Avitabile et al 2015) values for these two tree cover categories with significant differences evident. Results validate the differentiation of primary forests from dense tree cover associated with various land use practices. Primary forests are, on average, 50% taller than other dense tree cover and contain 82.1%, 81.5% and 72.1% of national tree cover biomass for Brazil, DRC and Indonesia, respectively. See supplementary materials for description of ancillary data.
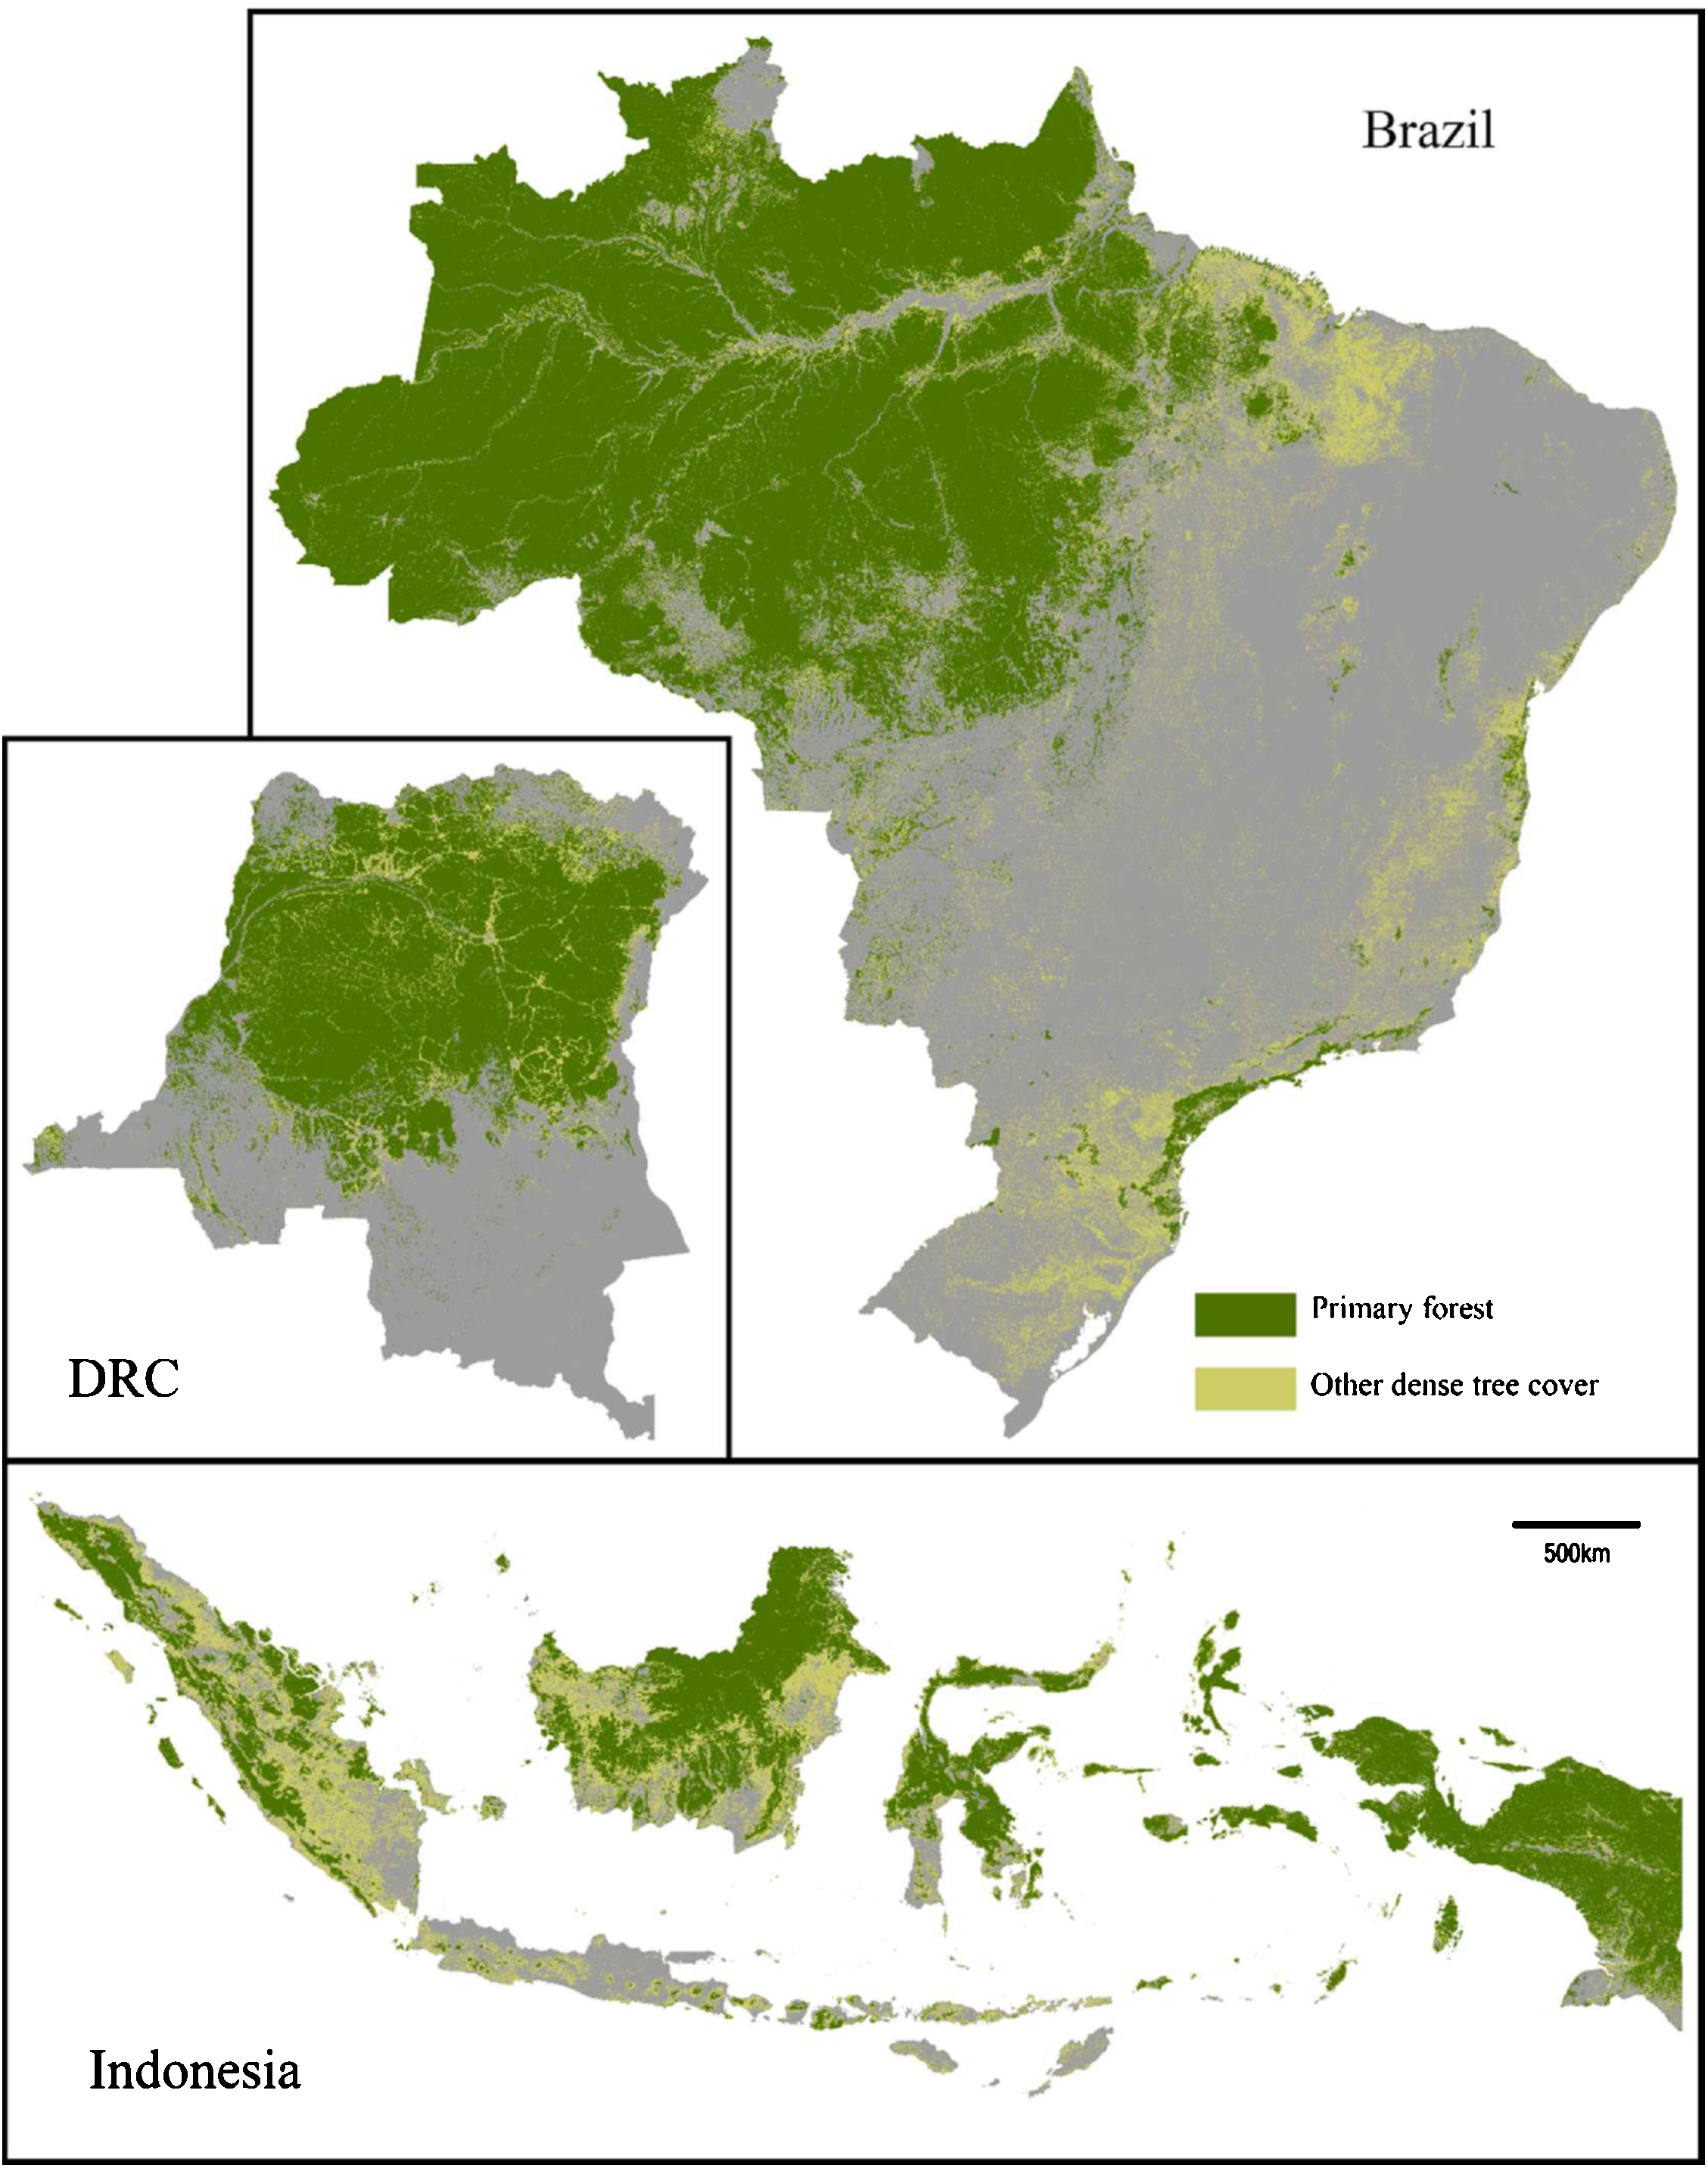
Figure 5. Mapped primary forest and other dense tree cover used to disaggregate lidar-derived vegetation height (Baccini et al 2012) and multi-source aboveground biomass data (Avitabile et al 2015). Summary data for each tree cover category are presented in table 4.
Download figure:
Standard image High-resolution imageTable 4. Mean vegetation height and aboveground biomass (AGB) for mapped primary forest and other dense tree cover (>=75%) for Brazil, DRC, and Indonesia. Average height was derived from lidar-derived vegetation height (Baccini et al 2012); average AGB from multi-source aboveground biomass data (Avitabile et al 2015). Uncertainty is expressed as ± one standard error of the mean (SEM).
| Average height (m) | AGB (Mg ha−1) | %AGB of country | ||
|---|---|---|---|---|
| Brazil | ||||
| Primary forest | 18.8 (± 6.7) | 249.1 (± 82.1) | 82.1 | |
| Other dense tree cover | 12.3 (± 6.3) | 100.3 (± 8.5) | 8.5 | |
| DRC | ||||
| Primary forest | 22.2 (± 6.9) | 312.0 (± 81.5) | 81.5 | |
| Other dense tree cover | 16.1 (± 7.0) | 183.1 (± 7.9) | 7.9 | |
| Indonesia | ||||
| Primary forest | 22.4 (± 8.7) | 315.9 (± 72.1) | 72.1 | |
| Other dense tree cover | 14.1 (± 6.7) | 161.9 (± 19.0) | 19.0 |
Discussion
Comparisons with other estimates
The need to perform sample-based area estimation is illustrated by the underestimation of the mapped loss product. Further evidence of the value of sampling is found in comparing the sample-based primary forest loss estimate with the longest official record of national-scale deforestation, the PRODES product of the Brazilian Space Agency. Given that the global forest cover loss layer is made on a calendar year basis and PRODES on a Southern Hemisphere dry season interval (~August), we compare three year moving averages to account for differences in annual assignment in mapping deforestation. Results are shown in figure 6 and illustrate a strong correlation (r2 = 0.95).
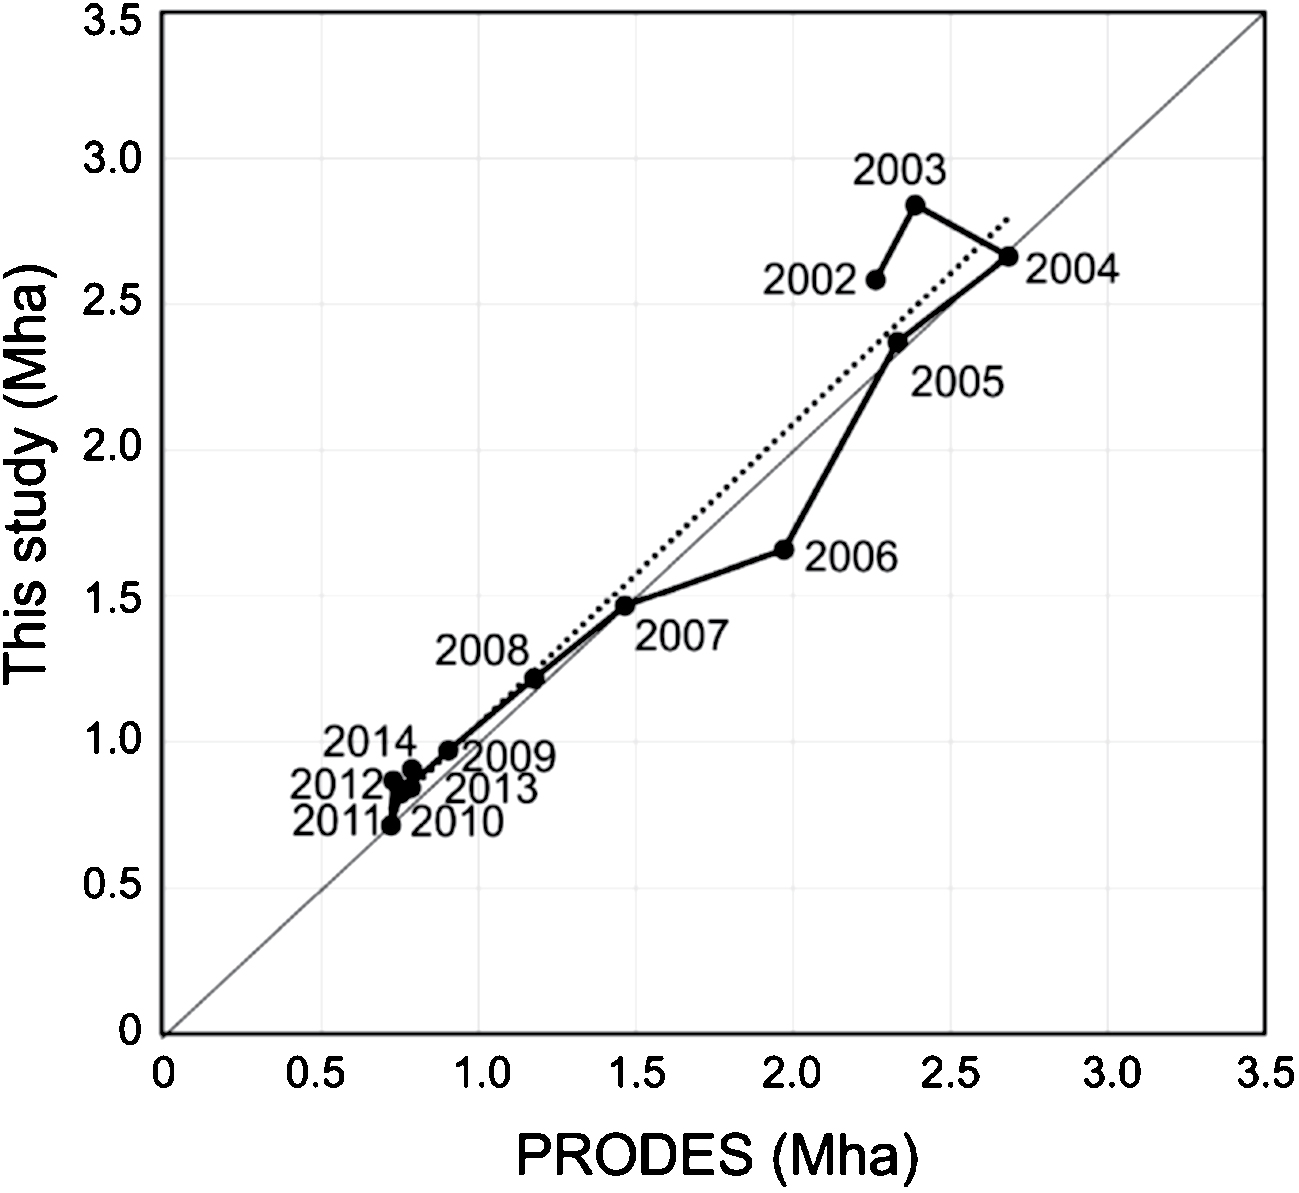
Figure 6. Annual PRODES mapped deforestation area versus sample-based primary forest loss area estimates from the current study for three-year moving averages. The solid line is the 1:1 line and the dotted line the linear fit of the two data sets of y =1.05x with an r2 of 0.95.
Download figure:
Standard image High-resolution imageFor further intercomparison, a summary of published data from previous analyses is shown in table 5. As shown in the results, primary forest area estimates for 2002 from both the map and the sample are in agreement. We compared primary forest extent from this study with data from the United Nations Food and Agricultural Organization (FAO) Forest Resource Assessment. While FAO data are a standard reference for large area studies, including for primary forest (Morales-Hidalgo et al 2015, FAO 2015), FAO data are subject to the vagaries of different definitions, methods, and data inputs (Grainger 2008). FAO primary forest data for DRC in 2002 agree with our results. However, FAO data for Brazil are 61% of the estimate of this study and 51% for Indonesia. FAO primary forest totals for 2005, 2010 and 2015 similarly disagree. Land use considerations are likely to contribute to these discrepancies. For example, in Indonesia, official forest land use as reported to FAO excludes significant primary forest cover (Margono et al 2014).
Table 5. Final results of 2001 primary forest extent and 2002 to 2014 primary forest loss area from this study compared to primary and natural forest extent and loss data and intact forest landscape data from other studies. Note that for most studies, the time interval and themes may differ. Underlined results represent final sample-based area estimates from this study.
| Units in km2 | Source | Brazil | DRC | Indonesia |
|---|---|---|---|---|
| Mapped primary forest area 2001 (this study) | Map | 3 433 857 | 1 045 960 | 942 620 |
| Sample-based primary forest area 2001 (this study) | Sample | 3 455 278 | 1 068 377 | 968 107 |
| FAO FRA primary forest area 2000 (FAO 2015) | Tabular | 2 104 660 | 1 044 550 | 494 530 |
| Brazil PRODES primary forest mask area 2000 (2005 forest mask minus 2000–2005 loss reported by PRODES) | Map | 3 386 749 | ||
| DRC primary forest area 2000 (Potapov et al 2012) | Map | 1 044 450 | ||
| Indonesian primary forest area 2000 (Margono et al 2014) | Map | 984 000 | ||
| Primary forest loss 2002–2014 (this study) | Map | 163 818 | 26 089 | 68 150 |
| Sample-based area of primary forest loss 2002–2014 (this study) | Sample | 191 210 | 35 696 | 76 708 |
| Brazil PRODES deforestation 2002 to 2014 | Map | 187 925 | ||
| Brazil primary forest loss 2000–2013 (Tyukavina et al 2017) | Sample | 224 041 | ||
| Brazil natural forest cover loss 2000–2012 (Tyukavina et al 2015) | Sample | 251 000 | ||
| Brazil FAO primary forest loss, 2000–2015 (FAO 2015) | Tabular | 77 750 | ||
| DRC FACET 2000–2010 primary forest loss (Potapov et al 2012) | Map | 9498 | ||
| DRC sample-based primary forest loss 2000–2010 (Tyukavina et al 2013) | Sample | 16 908 | ||
| DRC natural forest cover loss 2000–2012 (Tyukavina et al 2015) | Sample | 43 000 | ||
| DRC FAO primary forest loss, 2000–2015 (FAO 2015) | Tabular | 17 590 | ||
| Indonesia primary forest loss 2000–2012 (Margono et al 2014) | Map | 60 840 | ||
| Indonesia natural forest cover loss 2000–2012 (Tyukavina et al 2015) | Sample | 75 000 | ||
| Indonesia FAO primary forest loss, 2000–2015 (FAO 2015) | Tabular | 34 290 | ||
| Area of intact forest landscapes in 2000 (Potapov et al 2017) | Map | 2 476 068 | 643 884 | 359 194 |
| Area of intact forest landscapes in 2013 (Potapov et al 2017) | Map | 2 319 160 | 617 028 | 320 242 |
| Area of intact forest landscapes in 2016 (Potapov et al 2017) | Map | 2 277 038 | 608 829 | 305 626 |
Regarding primary forest loss, comparisons of the sample-based area estimates of this study with other studies are more challenging due to different time periods and defined forest cover classes. As already shown, primary forest cover loss data for Brazil from this study largely agree with the official PRODES data. Two other studies (Tyukavina et al 2015, 2017) estimate more loss for Brazil. However, the 2017 paper by Tyukavina et al includes a buffering method to assess areas of degradation, leading to a higher overall area of forest disturbance. The estimate of natural forest loss from Tyukavina et al (2015) is higher still, but includes loss of natural dry tropical woodlands, largely Cerrado, that likewise results in a higher overall loss estimate. Concerning DRC, previous studies have shown the tendency to underestimate change in the non- industrial, smallholder agricultural landscapes of Central Africa. A sample-based estimate by Tyukavina et al (2013) used a 60 m product as the input for stratification, possibly contributing to an underestimation of primary forest loss. The natural forest loss of Tyukavina et al (2015) was performed at 30 m, but as in Brazil, also includes dry tropical woodland loss in addition to humid tropical forest loss. Indonesia data from Margono et al (2014) employed the global map product, and results agree with the mapped area estimate of this study, but are lower than the sample-based loss estimate. Tyukavina et al (2015) natural forest cover loss is closer to the results of this study due to the lower proportional presence of dry tropical woodlands in Indonesia compared to Brazil and the DRC. Overall, existing data sets are largely congruent with DRC being the country with the highest variance in estimates.
By overlaying the IFL product onto the primary forest layer, as was performed previously in studies of Indonesia and DRC (Margono et al 2012, Zhuravleva et al 2013), the area of primary forest outside of intact forest landscapes can be estimated: 28%–30% of total primary forest extent in Brazil, 40%–41% in DRC, and 63%–66% in Indonesia over the course of the study period. These proportions reflect the different pressures within the primary forests of the three countries. The vast, still largely undeveloped hinterland of the Amazon Basin represents the most extensive remaining intact tropical forest landscapes, with a low proportion of primary forest outside of IFLs. The dominant pressure of shifting cultivation within DRC reduces intactness as it spreads into hinterland forests. Indonesia's humid tropical forests are subject to extensive logging pressures and fragmentation, dramatically reducing intact forest extent.
Variation in dynamics for the three largest rainforest countries
Brazil's successful policy intervention to slow deforestation (Nepstad et al 2014) is unique and stands in contrast to the increasing losses of Indonesia and DRC. However, in absolute terms, Brazil's area of primary forest loss over the study period was more than 2.5 times that of Indonesia and 5.3 times that of DRC. In 2010, Brazil experienced its lowest deforestation, followed thereafter by incremental increases. Brazil's annual percent forest loss peaked in 2004, exceeding 0.9% annually, but dropped to below 0.3% in recent years. As a percent of remaining primary forest area, Indonesia (~0.3% to ~0.9%) and DRC (~0.1% to ~0.4%) exhibited an increasing rate of loss. While both countries exceeded Brazil by the end of the study period, Indonesia's recent proportional loss was double that of DRC and nearly triple that of Brazil (supplementary figure S2).
Brazil has the most remote forests of the three countries as defined by distance to forest loss. While the reduction in agro-industrial scale clearings along the Brazilian arc of deforestation has resulted in dramatically reduced deforestation, more distant forests are being subjected to extractive land uses such as logging and mining (Alvarez-Berríos and Aide 2015). Recent government plans to degazette (Mascia et al 2014) a large national park in the states of Para and Amapa for mining are a reflection of the changing dynamic in Brazil. Figures 7(a)–(c) shows an example of widespread mining in Para state, including encroachment on Jamanxim National Park, and is an example of dramatic reduction in the relative remoteness of primary forests. Brazil also differs from Indonesia and DRC in the rate of spatial change for its primary forests closest to primary forest loss (Q1 in figure 4), which slightly increased over the study period in Brazil. Slightly increasing distances of this quartile reflect the decrease of forest clearing along the arc of deforestation coupled with increased loss in intact forests far removed from the arc of deforestation. Figures 7(d)–(f) illustrates an example intact protected area in Para state, the Parakana Indigenous Reserve. The distance of loss to the forests of Parakana rises as the wave of deforestation passes, and may continue increasing if the forests of Parakana remain intact. Supplementary figure S1 depicts a model of the dynamic in Brazil where early 2000s loss is high throughout the arc of deforestation. As with the Parakana Indigenous Reserve, national parks and indigenous reserves literally come out of the woodwork with significant areas of primary forest in the arc of deforestation experiencing increasing distance to forest clearing, particularly given the decline in deforestation over the study period. Coupled with this are new extractive land uses deeper inside primary forest. The net effect is a compression of the interquartile range of the distance of primary forest loss to remaining primary forests (supplementary table S2).
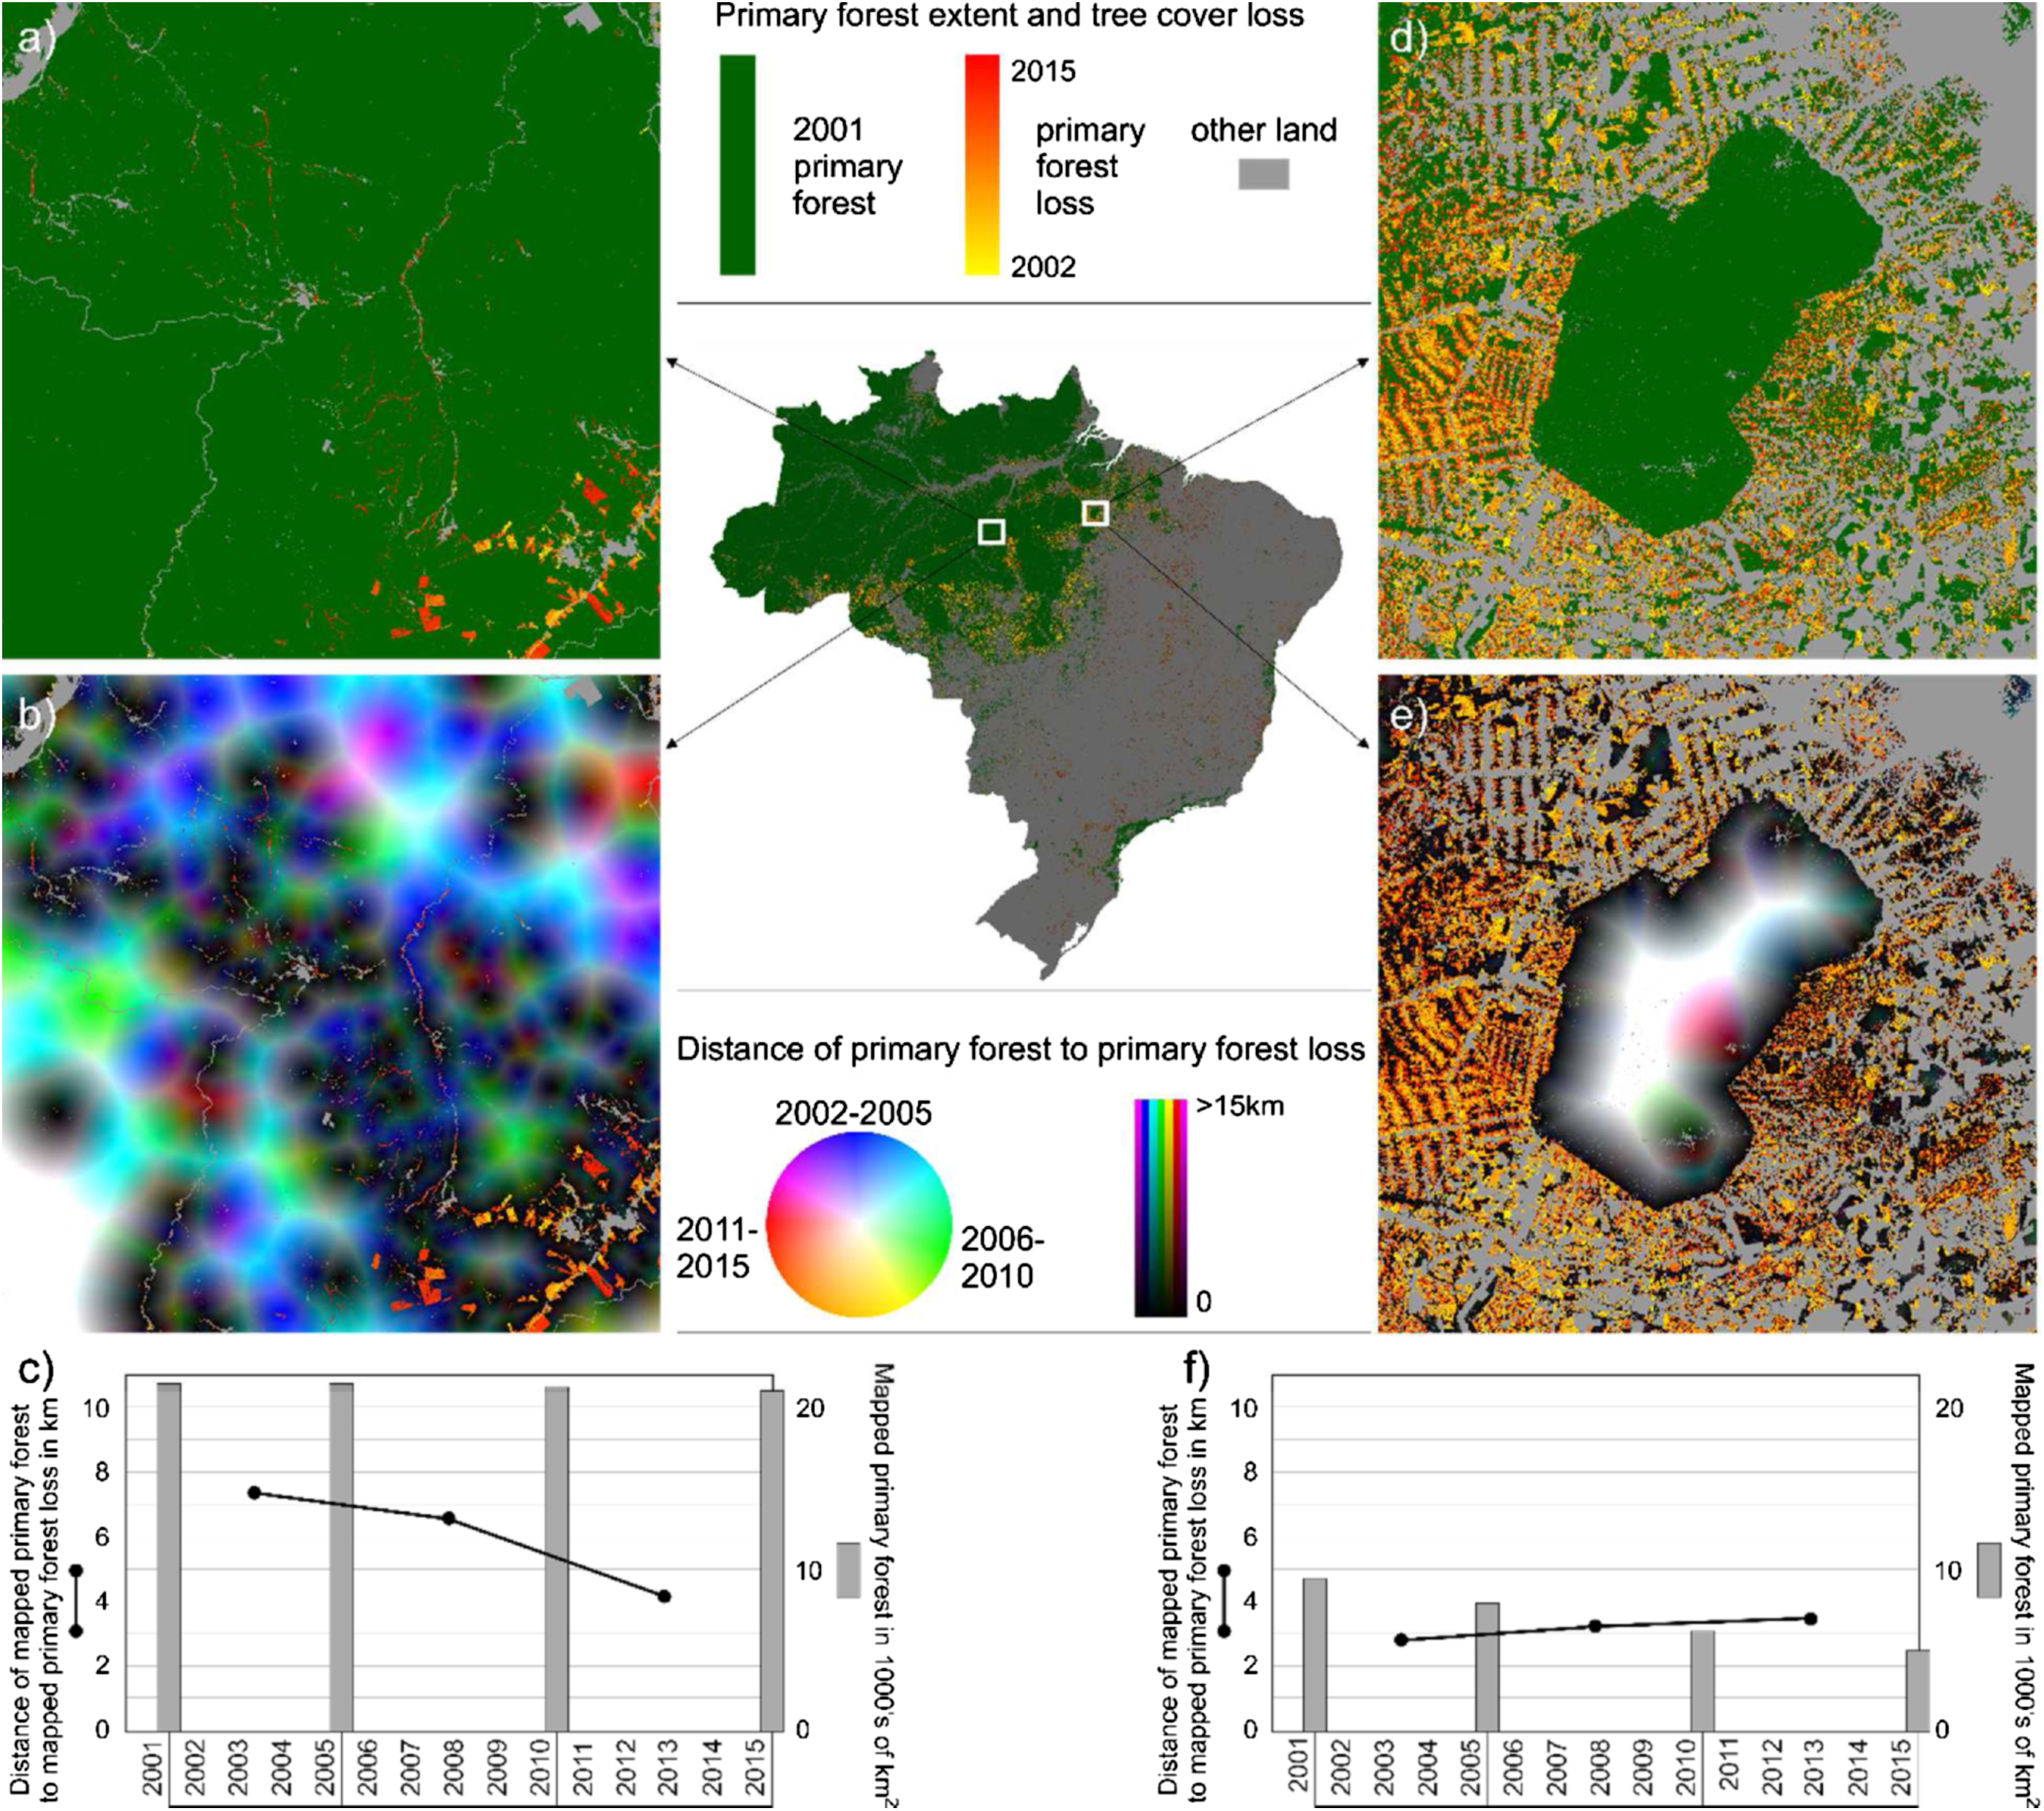
Figure 7. Example subsets of primary forest extent, loss, and distance to loss for two areas in Brazil. On the left, a region of expanding mining and pasture in Para state, centered at 56d30'W, 6 dS. On the right, deforestation around Parakana Indigenous Reserve in Para state centered at 50d6'W, 4d48'S. Subsets (a) and (d) show mapped primary forest extent and annual primary forest loss. Subsets (c) and (f) display distance of primary forest to primary forest loss by epoch (2002–2005, 2006–2010, and 2011–2015) in place of primary forest extent. Remaining primary forest at the end of each epoch is compared to primary forest loss within the epoch and distances calculated. The resulting image depicts ongoing threats to remaining forests, with blue and cyan indicating distances that decreased over the three epochs and red and yellow distances that increased. Subsets are 139 km × 139 km in extent. At the bottom, (c) and (f), line plots depict mean epochal distances of primary forest to primary forest loss. Bar graphs (c) and (f) depict mapped primary forest area for beginning and end years of each epoch.
Download figure:
Standard image High-resolution image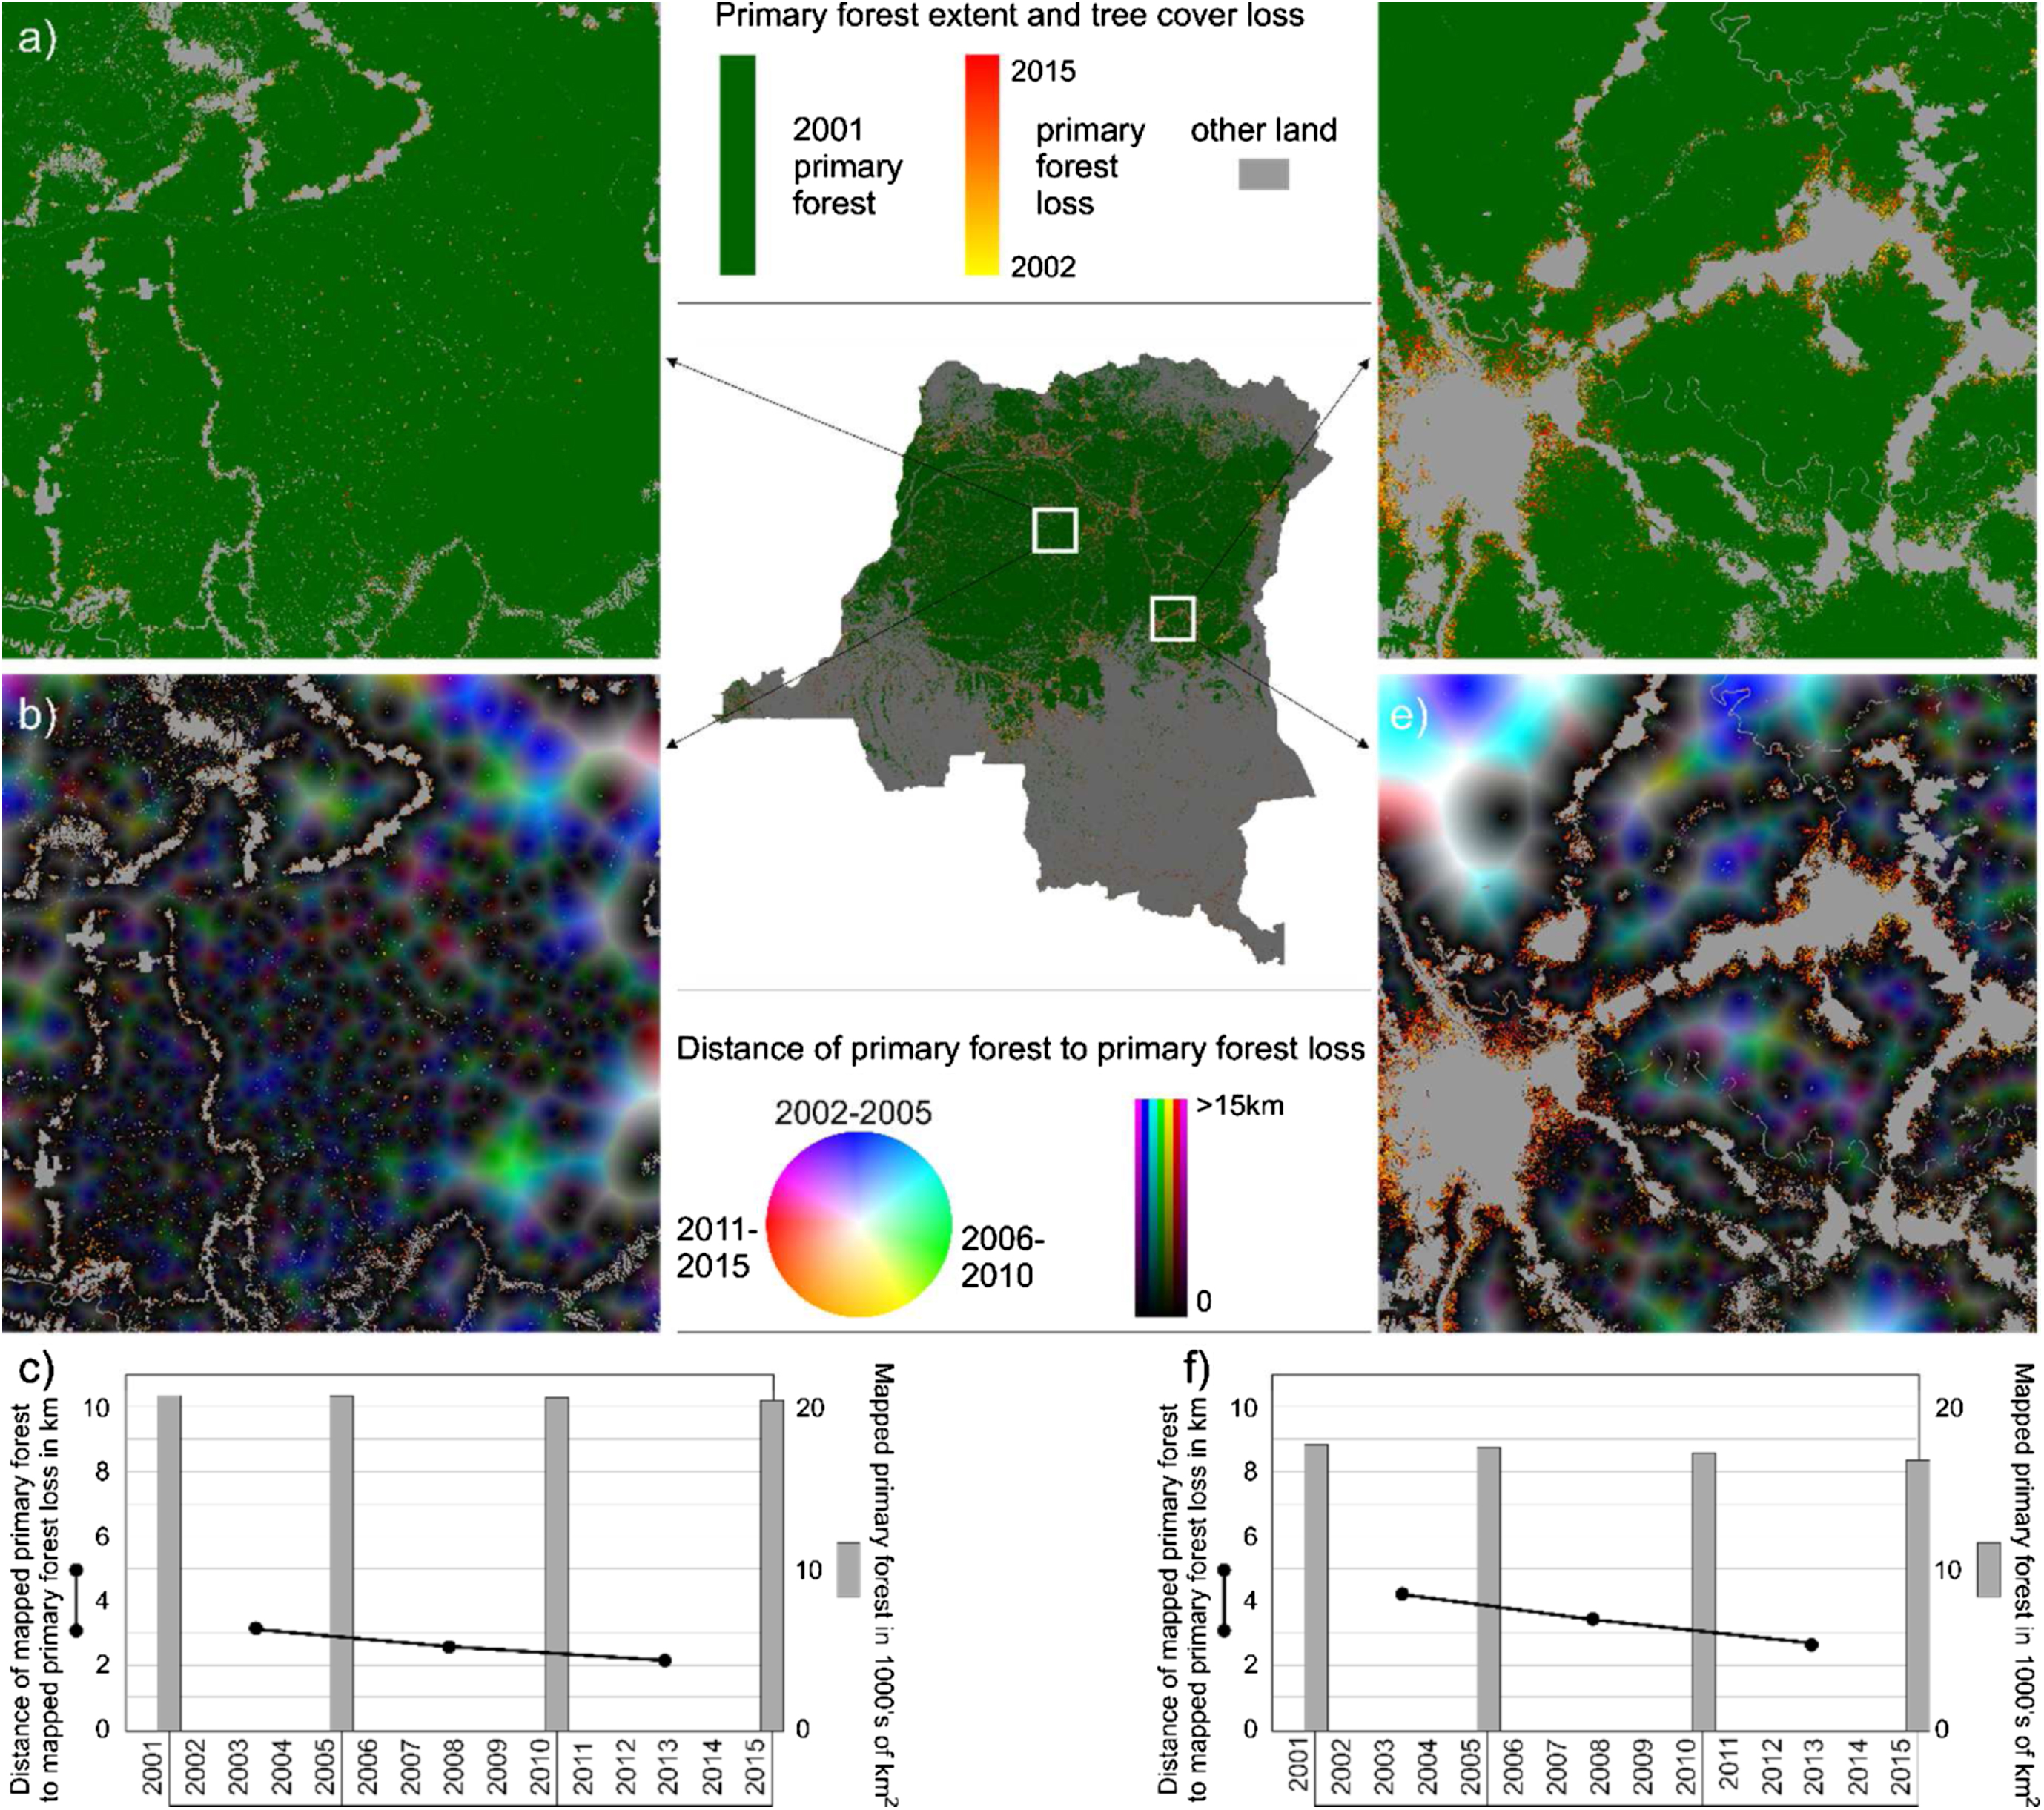
Figure 8. Example subsets of primary forest extent, loss and distance to loss for two areas in the Democratic Republic of the Congo. On the left, a region of scattered smallholder land use along the Tshuapa/Tshopo provincial boundary, centered at 22d47'E, 0d4'S. On the right, smallholder land use in proximity to Kindu, Maniema, centered at 26d23'E, 2d46'S. Subsets (a) and (d) show mapped primary forest extent and annual primary forest loss. Subsets (c) and (f) display distance of primary forest to primary forest loss by epoch (2002–2005, 2006–2010, and 2011–2015) in place of primary forest extent. Remaining primary forest at the end of each epoch is compared to primary forest loss within the epoch and distances calculated. The resulting image depicts ongoing threats to remaining forests, with blue and cyan indicating distances that decreased over the three epochs and red and yellow distances that increased. Subsets are 139 km × 139 km in extent. At the bottom, (c) and (f), line plots depict mean epochal distances of primary forest to primary forest loss. Bar graphs (c) and (f) depict mapped primary forest area for beginning and end years of each epoch.
Download figure:
Standard image High-resolution image
Figure 9. Example subsets of primary forest extent, loss and distance to loss for two areas in Indonesia. On the left, an area of peatland conversion in West Kalimantan, centered at 109d32'E, 0d1'N. On the right, expansion of logging near the Malaysian border (white line) along the North Kalimantan and East Kalimantan border, centered at 115d0'E, 1d15'N. Subsets (a) and (d) show mapped primary forest extent and annual primary forest loss. Subsets (c) and (f) display distance of primary forest to primary forest loss by epoch (2002–2005, 2006–2010, and 2011–2015) in place of primary forest extent. Remaining primary forest at the end of each epoch is compared to primary forest loss within the epoch and distances calculated. The resulting image depicts ongoing threats to remaining forests, with blue and cyan indicating distances that decreased over the three epochs and red and yellow distances that increased. Subsets are 139 km × 139 km in extent. At the bottom, (c) and (f), line plots depict mean epochal distances of primary forest to primary forest loss. Bar graphs (c) and (f) depict mapped primary forest area for beginning and end years of each epoch.
Download figure:
Standard image High-resolution image
DRC has the lowest mean rate of primary forest loss over the study period. However, unplanned smallholder agriculture is spatially pervasive with civil conflict and resulting insecurity leading populations to move deeper into remote forests (Nackoney et al 2014). Resulting forest clearing is diffused and expanding throughout the country, resulting in the least remote remaining primary forests of the three countries studied (supplementary table S2). The general spread and increase of human populations and their continued clearing of forests for subsistence livelihoods results in closer proximity of extant primary forest to ongoing loss. Figure 8 shows two subsets in DRC, one removed from major population centers along the Tshuapa/Tshopo provincial boundary and another in the environs of the city of Kindu in Maniema province. Both illustrate high total primary forest area extent and low forest loss, with loss found along major trunk roads, and increasingly scattered within previously intact forest expanses. Figure 8(b), in particular, highlights the contagion effect of populations abandoning the main transport routes in Tshuapa/Tshopo to seek livelihoods deep inside primary forests (black colors denoting short distances from primary forest clearing to extant primary forest).
Indonesia's distance measures changed the least over the study period, reflecting an overall dearth of remaining remote forests. In contrast to Brazil, the Indonesian government's moratorium on the issuance of licenses in 2011 (Murdiyarso et al 2011) has not comparably slowed primary forest loss. For example, new permits covering a 'staggering' 3 million hectares were granted in the lead-up to the decree's announcement beginning in 2011 (Maryudi 2016). Figures 9(a)–(c) in West Kalimantan shows the dramatic collapse of remnant coastal peatland forest cover to agro-industrial land uses. Logging in Papua and interior Kalimantan (figures 9(c), (d) and (f)) is a primary driver in opening up the remaining forests of Indonesia. Given a spatially pervasive disturbance dynamic and high rates of loss for comparatively low remaining forest area, Indonesia exhibits greater pressure on remnant primary forests than either Brazil or DRC.
Conclusion
Humid tropical forests are a matter of global environmental concern that merits their systematic monitoring (Mackey et al 2015). This study demonstrates a method for mapping and monitoring the extent of primary humid tropical forests, defined as tall, dense tree cover absent of observable disturbance in the satellite record. Results quantify ongoing exploitation and consequent loss of primary forest areal extent, and decreasing distance of remaining forests to contemporaneous loss. The establishment of a 2001 pan-tropical primary forest baseline is achievable, with the possibility of moving the baseline back even further, given sufficient archival Landsat data. The creation of such a map, which could include intact dry tropical woodlands, would clarify the extent of the resource base most relevant to policy initiatives focused on carbon sequestration and emissions, biodiversity conservation and indigenous peoples within remaining tropical forests. National-scale primary forest data can be used to facilitate land use planning in balancing the goals of economic development and maintenance of ecosystem services. Countries lacking significant areas of such forests can focus forest management programs more appropriately on forest restoration efforts (Aerts and Honnay 2011).