

Abstract
Health risk assessments for extreme heat and the design of corresponding interventions can be enhanced with more information regarding causal drivers of year-to-year variability in adverse outcomes. Summer 2016 was a record-setting year in terms of summer heat and its impacts on health in Maricopa County, Arizona, USA. The month of June was the warmest observed in the county and the six-month warm season spanning May through October was the fourth warmest. In the same year, a record number of heat-associated deaths was reported by the heat surveillance program run by the county health department. We analyzed the time series of heat-associated deaths to quantify the extent to which the unprecedented death count in 2016 was driven by anomalous weather. We first estimated the historical association between temperature and heat-associated deaths for the time period 2006–2015 using a time series regression model. Subsequently, we used the model to generate predictions of daily heat-associated deaths in 2016 based on the observed weather. We found no evidence that the unusually high number of heat-associated deaths observed in Maricopa County in 2016 was related to observed meteorological conditions. Regardless of the exposure variable or model parameterization chosen, the prediction for 2016 fell near or below the historical average number of heat-associated deaths. If the conventional methods for estimating the temperature–mortality association are reasonably approximating a causal relationship, factors other than the weather were mostly responsible for the surge in deaths in 2016. These findings highlight the importance of non-meteorological factors as drivers of temporal variability in the health burden associated with heat, which have generally not been included in quantitative retrospective or prospective studies. Further, they highlight a shortcoming in preparedness and response efforts for heat in the study setting that should be diagnosed and addressed as soon as possible.
Export citation and abstract BibTeX RIS

Original content from this work may be used under the terms of the Creative Commons Attribution 3.0 licence. Any further distribution of this work must maintain attribution to the author(s) and the title of the work, journal citation and DOI.
Introduction
Extreme heat poses public health risks in many cities across the globe, especially in regions where heat is persistent and severe (e.g. Hartz et al 2013, Harlan et al 2014). Quantifying the public health burden of heat in places that experience this hazard most intensely, as well as understanding the causal drivers of that burden, may be instructive as cities prepare for a warmer future. Here, we explore factors that may have contributed to an unprecedented number of heat-associated deaths that occurred in one of the hottest metropolitan areas of the United States in the summer of 2016—one of the warmest seasons on record.
Many studies point toward a future with higher average temperatures as well as more intense and frequent extreme heat events as a result of greenhouse gas forcing and urbanization (e.g. Georgescu et al 2014, Maloney et al 2014, Russo et al 2014). These changes have also been projected to increase heat-associated morbidity and mortality (e.g. Åström et al 2013, Kingsley et al 2016, Petkova et al 2016). However, it is unclear how reliably historical models of the temperature-health association at short time scales (days) produce estimates of variability at longer time scales (e.g. seasons, years). Available evidence suggests that long-term variability may be difficult to model (Guo et al 2012). There is high uncertainty regarding the contribution of climate change as a driver of the future public health burden of heat in comparison with other factors such as population growth, demographic transition, and adaptation strategies (Hondula et al 2015, Petkova et al 2016, Gosling et al 2017). The interplay between these factors has rarely been examined retrospectively, but the limited evidence available suggests that social factors play a substantial role in influencing long-term trends in heat-associated mortality (e.g. Bobb et al 2014, Ng et al 2016).
One of the planet's warmest urbanized regions is the southwestern United States. Understanding the impact of heat in this region, where conditions are already severe throughout a prolonged warm season, may provide insights into how other cities may be able to cope with projected warming (Centers for Disease Control and Prevention (CDC) Environmental Public Health Tracking Program 2018). Maricopa County, Arizona, which spans most of the rapidly growing Phoenix Metropolitan Area, is home to more than four million people (US Census Bureau 2017). In 2016, the month of June was the warmest to date in the US National Oceanographic and Atmospheric Administration Climate Division within which Maricopa County is located, the month of July was the second-warmest, and the six-month warm season spanning May through October was the sixth warmest (NCEI 2018). In the same year, the Maricopa County Department of Public Health (MCDPH) reported a record high number of heat-associated deaths (MCDPH 2017). The 155 confirmed heat-associated deaths in 2016 exceeded the previous record by 48 cases and was more than 82% above the standardized prior ten-year average.
The objective of our analysis is to quantify the extent to which the abnormally high heat-associated death count of 2016 was driven by meteorology using heat-associated death records in concert with weather observations. In doing so, we hope to shed more general insights into the factors that reduce or exacerbate the impacts of heat and how preparedness and response strategies can improve. This knowledge is especially important to build in light of projections of large increases in heat-associated mortality in many cities resulting from global and urban warming.
Methods
Maricopa County, Arizona, is located in the Sonoran Desert in the southwestern United States and has a hot, arid climate. Summer daily maximum temperatures routinely exceed 38 °C (100 °F) and an average year brings 18 days of daily maximum temperatures of 43 °C (110 °F) or higher at Phoenix Sky Harbor Airport (CDC Environmental Public Health Tracking Program 2018). Rapid urbanization over the past several decades has led to large increases in daily minimum temperatures, a distinctive signature of the urban heat island effect (Chow et al 2012, Georgescu et al 2013). The county accounts for the majority of the geographical extent and population of the Phoenix-Mesa-Chandler Metropolitan Statistical Area, the 12th largest by population in the United States (US Census Bureau 2017).
Several regional agencies have made significant efforts to assess and reduce the public health burden of extreme heat. Among them, MCDPH operates an advanced and distinctive heat mortality surveillance program. Health authorities began more closely monitoring and classifying heat-associated deaths in 2006 after a highly publicized heat wave in 2005 resulted in greater local awareness of heat-associated deaths (Yip et al 2008). Since 2006, MCDPH has tracked and investigated heat-associated deaths, collecting data on location, time, demographics, and other circumstantial evidence for cases in which heat is suspected to have been the immediate cause of death or a contributing factor. The health department obtains this information from two sources: (1) the Maricopa County Office of the Medical Examiner, which flags deaths that it suspects to be heat-associated, and provides circumstances of death; and (2) the Arizona Department of Health Services, Office of Vital Registration, which contains a database of confirmed heat-associated cases. MCDPH extracts confirmed heat-associated cases by querying the Vital Registration database using key phrases (e.g. 'heat exposure', 'exhaustion'). The program also looks for certain International Classification of Disease-10 (ICD-10) codes that might indicate a heat-associated death (e.g. X30 (Exposure to excessive natural heat), T67.X (Effects of heat and light), P81.0 (Environmental hyperthermia of newborn)). MCDPH's efforts have culminated in a record of heat-associated deaths that is more inclusive than queries based on ICD codes alone (e.g, Berko et al 2014) but more precise than the construct of excess all-cause deaths that is often used for temperature–mortality studies (e.g. Anderson and Bell 2011, Gasparrini et al 2015). More details of the MCDPH heat surveillance programs are available online (https://maricopa.gov/1858/Heat-Surveillance).
MCDPH heat surveillance data from 2006 to 2016 were used for this analysis. This time period encompassed all years for which MCDPH has implemented their enhanced surveillance system for heat-associated deaths. The time series of heat-associated deaths spans the full calendar year, although the vast majority of cases (∼90%) are reported in the months May–September. Daily heat-associated counts were standardized to account for longer-term changes in population size and composition (e.g. age structure) as well as overall population health status. We directly standardized the data by adjusting the daily heat-associated death counts based on the total deaths from all causes reported in the county each year. We surmised that total deaths would be proportional to population size and composition as well as overall population health. All-cause annual mortality data were sourced from the Arizona Department of Health Services Office of Vital Statistics (http://pub.azdhs.gov/health-stats/report/ahs/ahs2015/pdf/5e1.pdf). All data were standardized to 2015, the most recent year for which total mortality counts are available.
Daily meteorological data were obtained from the National Centers for Environmental Information for Phoenix Sky Harbor Airport, an official first-order weather station located near downtown Phoenix. We obtained daily maximum, mean, and minimum dry bulb temperature, and examined the daily distribution of temperatures in 2016 compared to the ten years prior, with an emphasis on the five-month warm season (May–September) that accounts for the majority of heat-associated deaths. We did not incorporate humidity into the exposure models given prior research demonstrating little difference between temperature–mortality models that include or exclude humidity in the study setting (e.g. Harlan et al 2014). We also incorporated information from an experimental National Weather Service (NWS) product called HeatRisk (https://wrh.noaa.gov/wrh/heatrisk/). HeatRisk provides a daily classification of observed or forecast meteorological conditions based on the relative severity of hot weather compared to climatology and is being used as a decision support tool in NWS Weather Forecast Offices across the American Southwest at present.
Our methodological approach was to hindcast the 2016 heat-associated death counts based on temperature–mortality associations derived from the period 2006–2015 and meteorological observations from 2016. Because there is no consensus regarding the optimal statistical model or exposure variable for associating weather and heat-associated deaths in this region (e.g. Hondula et al 2014, Petitti et al 2016) or others (e.g. Barnett et al 2010), we used a number of different modeling approaches and exposure variables to create hindcasts for 2016. To minimize the introduction of bias into the hindcasting approach, the functional form of all models was determined ahead of detailed review of observations or model output.
We created three different types of models: (1) simple temperature–mortality; (2) complex temperature–mortality; (3) HeatRisk. The models estimate the daily association between the exposure variable and the risk of heat-associated deaths based on the observed time series of heat-associated deaths for the entire population of Maricopa County and the observed daily weather. For the simple and complex temperature–mortality models, we tested maximum, mean, and minimum temperature as the exposure variable. The simple temperature–mortality models took the following form:

where scaled_heatdeaths is the standardized daily heat-associated death count from the MCDPH surveillance program, s is a natural penalized thin plane smoothing spline with k knots, and temp is the exposure variable (maximum, mean, or minimum temperature). We did not control for seasonality in these models because we anticipated that any seasonality in heat-associated death counts would primarily arise from meteorology and not confounding factors (following Petitti et al 2016). The complex temperature–mortality models took the following form:
where complex_temp variable was applied to take into account the lagged effect of temperature on human mortality (e.g. Gasparrini et al 2015). The complex_temp variable was defined as n-day moving average of maximum, mean, or minimum temperature of the current and previous days. Alternative variants of the moving average from two-day (lag 0–1) to five-day (lag 0–4) were used in the complex model, and the moving average providing the best fit (based on the generalized cross validation score) was used as the final model. The HeatRisk model took the following form:

where HeatRisk variable represents the NWS's HeatRisk classification (five categories: No Elevated Risk, Low Risk, Moderate Risk, High Risk, Very High Risk).
We generated hindcasts of 2016 heat-associated mortality using the observed daily temperatures from 2016 as input to each model. Daily hindcasts of heat-associated deaths were generated and summed by year. Model performance was evaluated by examining the deviance explained in the daily historical (2006–2015) heat-associated death records. Subsequently we reviewed the extent to which the model captured annual variability in heat-associated deaths counts, with an emphasis on how the hindcast for 2016 compared to other years. Confidence intervals (C.I.) for annual sums were calculated as the square root of the annual sum of the squared radii of the daily C.I. All analysis was conducted using R version 3.4.2, accessed through RStudio version 1.1.383. Time series modeling relied on the mgcv package (Wood 2017).
Results
Climatological assessment of 2016
Warm season daily mean temperatures in Maricopa County in 2016 followed a progression similar to the prior ten-year average, peaking in June (daily average mean temperature = 34.9 °C) and July (daily average mean temperature = 36.2 °C). The highest daily mean temperatures were observed during two prolonged periods in which the average daily mean temperature was above 37 °C, one occurring 19–28 June and another that spanned most of the latter half of July. The highest daily mean temperature of the summer was recorded on 20 June (39.4 °C). Despite the high frequency of very warm days in 2016, compared to other years in the period 2006–2015, there were relatively few days at the highest end of the temperature distribution (figure 1). For example, there were nearly 15 fewer days with daily mean temperatures at or above 32 °C than the average of the previous ten years. More importantly from a health perspective, there were only eight days with daily mean temperatures above 38 °C compared to an average of 10.6 over the previous decade, and zero days with daily mean temperatures of 40 °C or above. An even more pronounced absence of days at the high end of the temperature distribution was observed for minimum temperatures, whereas the pattern of maximum temperatures was more closely aligned with the previous ten years (not shown).
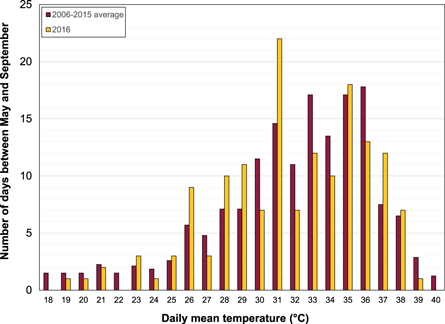
Figure 1. A comparison of the distribution of observed warm season (May–September) daily mean temperatures between 2006–2015 (maroon bars) and 2016 (gold bars) at Phoenix Sky Harbor Airport in Maricopa County, AZ. Daily mean temperatures were rounded to the nearest integer.
Download figure:
Standard image High-resolution imageTemperature–mortality models
The mean standardized annual heat-associated death count in Maricopa County over the period 2006–2015 was 85.6, with a standard deviation of 24.6. In 2016 the number of reported cases (155) was more than 85.5%, or 2.8 standard deviations, above the historical average (figure 2).

Figure 2. A comparison of observed and modeled heat-associated deaths in Maricopa County, Arizona, 2006–2016. The bars show the standardized (gold) and raw (maroon) observed annual heat-associated death totals. The symbolized lines show the annual hindcast heat-associated death totals from simple (circles), complex (squares), and categorical (triangles) temperature–mortality models. Standardization of heat-associated death totals used 2015 as the reference year. No standardized heat-associated death total is available for 2016 because total annual mortality counts had not yet been aggregated by the state health department at the time this manuscript was prepared; the standardized total for 2016 is assumed to match the raw total.
Download figure:
Standard image High-resolution imageSimple temperature–mortality models all showed a clear and strong relationship with historical daily heat-associated deaths. Figure 3 illustrates the modeled relationship between daily heat-associated deaths and daily mean temperature, which was a better predictor of the relationship over the period 2006–2015 than minimum or maximum temperature. Differences between the models were, however, very small. The daily mean temperature model with zero lag accounted for 50.7% of deviance in daily standardized heat-associated deaths; minimum temperature accounted for 49.3% and maximum temperature accounted for 46.9%.

Figure 3. The modeled relationship between daily heat-associated deaths and daily mean temperature in Maricopa County, Arizona, United States, 2006–2015. The solid line shows the effect estimate and the dashed lines show 95% confidence intervals.
Download figure:
Standard image High-resolution image
There was a much weaker association of the relationship between modeled and observed heat-associated deaths when the model predictions and observations were aggregated by year (figure 2). The modeled annual heat-associated death counts fell in a narrow range (74.1–95.6) compared to the standardized annual observations (43.9–121.6). Model uncertainty was low relative to the inter-annual variability in the observations; the 95% C.I. for the annual heat-associated deaths counts (not shown on figures) was never wider than ±1.0 deaths per year. The aggregated counts from the zero lag mean temperature model explained approximately 19.7% of the variance in the aggregated annual observations. Using this model, we would have anticipated 79.7 heat-associated deaths in 2016 (95% C.I. = 78.8, 80.6) based on the observed temperatures. Predictions from models based on minimum and maximum temperature were 77.6 (76.9, 78.4) and 84.1 (83.0, 85.1) deaths, respectively.
Regardless of the exposure variable chosen, the prediction for 2016 and the upper bound of its 95% C.I. using a simple temperature–mortality model falls below the historical average number of heat-associated deaths. In fact, based on mean temperature, the prediction would have ranked as the 3rd lowest over the 11 years for which model predictions are available. The model consistently under predicted mortality across the three months of the warm season with the most heat-associated deaths, with June, July, and August associated with under-predictions of 42%, 51%, and 50%, respectively. Similarly, daily errors in model predictions were inversely correlated with temperatures, with larger errors occurring on the hottest days. The mean absolute error for daily predictions on days with daily mean temperatures above the 95th percentile in 2016 was 1.47 deaths, whereas on days between the 75th and 95th percentile the mean absolute error was 0.97 deaths.
Complex temperature–mortality models provided a better fit to the historical data than the simple models. After testing multiple combinations of exposure variables, smoothing windows, and interaction effects with month, we identified the best complex model to include four-day moving average daily mean temperature (lag 0–3), with an interaction term for month as a categorical variable. This model explained 56.0% of the deviance in daily standardized heat-associated mortality. Replacing mean with minimum and maximum temperature, keeping other parameters consistent, only changed the model diagnostics slightly (54.7 and 55.1% deviance explained, respectively). We did not find strong evidence of an added 'heat wave' effect in our exploration of more complex statistical models, and thus did not investigate the potential impact of heat wave attributes including duration, timing, and intensity (see Anderson and Bell 2011).
Despite the statistical improvement of the complex temperature–mortality models in fitting the historical data, the hindcast for heat-associated mortality in 2016 did not change considerably. Using the complex model with mean temperature, we estimated 82.0 (95% C.I. = 80.0, 84.1) heat-associated deaths in 2016 based on the observed meteorology. Hindcasts based on minimum (80.6 (78.6, 82.6)) and maximum (82.0 (80.2, 83.9)) temperature were similar, and all three were below the historical average of 85.6 heat-associated deaths per year (standardized). The complex model had a similar pattern of seasonal errors as the simple model, with larger errors on hotter days and in hotter months.
The model based on the NWS HeatRisk product did not fit the historical observations as well as the simple and complex temperature–mortality models. This categorical variable explained 33.1% of the deviance in observed heat-associated deaths. Effect estimates were greater than one heat-associated death for the two highest HeatRisk categories (red and magenta), with 1.25 deaths predicted per red day and 1.53 deaths predicted per magenta day. The model prediction for 2016 using HeatRisk was 77.3 (75.7, 78.8) heat-associated deaths, which is below the observed historical average and is the lowest number of heat-associated deaths predicted by any model we examined in this study.
Discussion and conclusions
Using widely applied statistical modeling techniques, we were unable to find evidence to suggest that the unusually high number of heat-associated deaths observed in 2016 in Maricopa County, Arizona, was related to observed meteorological conditions. Most models, in fact, suggested that 2016 should have been a year with a normal or below-normal number of heat-associated deaths. If population health risks related to heat are reasonably well approximated by widely applied time series models of the temperature–mortality association (e.g. Barnett et al 2012, Harlan et al 2014, Gasparrini et al 2016), our results indicate that factors other than the weather were predominantly responsible for the surge in heat-associated deaths in 2016.
The study findings serve as a case study for one geographic location and one defined time period and should be interpreted within that context. Replication to other settings with similarly available health records is a necessity and the methodological approach should be highly transferable elsewhere. If these results are more widely applicable, they challenge some existing methods and paradigms in the scientific literature concerning temperature-related health impacts. For instance, many studies project significant increases in heat-associated mortality in the future with models that are largely based on temperature change alone (Huang et al 2011, Hondula et al 2015). Projection-oriented studies typically do not take into account key factors that may act as effect modifiers such as timing and duration (Barnett et al 2012, Gasparrini et al 2016) environmental variables including air quality (Burkart et al 2013, Vanos et al 2014, Willers et al 2016), social attributes (Burkart et al 2014, Kovach et al 2015, Urban et al 2016), health outcomes observed in previous seasons (Rocklöv et al 2009, Ha et al 2011), and mortality displacement (Hajat et al 2005, Yang et al 2012, Saha et al 2013, Qiao et al 2015). Our findings suggest that these factors may be critical to include in assessments of future risk and potential uncertainties associated with applying contemporary models are quite wide. Our results are similar in nature to those of Guo et al (2012), who found high year-to-year variability in the relative risk of heat-related mortality among the elderly in the United States, which also suggests an important role for factors beyond those typically considered in temperature–mortality studies. If successful adaptation to heat was occurring in this community, the historical model should have overestimated the number of heat-associated deaths observed in 2016. Instead, nearly all of the models we generated led to an underestimate. Understanding the extent to which societies will continue to be able to adapt to heat, especially given projected urban- and global-driven climate change, is a critical research need (Åström et al 2017, Gosling et al 2017).
The major finding of our study, that an exceptionally warm summer should not have seen an exceptionally high number heat-associated deaths, may seem counterintuitive. However, conventional summary statistics commonly used to determine monthly and seasonal records are not optimal indicators of the risk of heat-associated deaths. Although 2016 was an abnormally warm summer in Maricopa County based on conventional metrics, the distribution of daily temperatures was relatively favorable from a health perspective. The nonlinearity of the temperature–mortality functions implies that the number of days at the uppermost end of the temperature distribution is especially influential in the predicted annual total of heat-associated deaths; the hottest days are associated with the highest modeled heat-associated mortality. The relative absence of these days in the record for 2016 (figure 1) contributed to a lower total number of hindcast heat-associated deaths for that year. There is some evidence that the timing of heat within the warm season may also be important to consider in modeling heat-related mortality (e.g. Gasparrini et al 2016). In Maricopa County in 2016 the six days with the highest mean temperature were split evenly between the months of June and July, which is consistent with the long-term climatology associated with the regional monsoon pattern that suppresses temperatures in late summer. There were two multi-day periods with anomalously high daily mean temperatures in the month of June, and June was the month with the greatest positive difference in monthly mean temperatures versus the prior ten years. The absolutely high daily mean temperatures in the month of June contributed to a higher hindcast total for annual mortality, but there was no evidence from the historical mortality record to suggest that this relative early-season warmth should have been especially dangerous.
Given that meteorological differences between 2016 and other years in our study period do not appear to account for the increase in heat-associated deaths observed in 2016, we investigated other factors that may be responsible. Because detailed information about the circumstances and exposure histories of decedents are not systematically available, even from an advanced surveillance program like the one operated by MCDPH, it is very difficult to make a strong causal argument based on the health records alone. We offer a few potential explanations drawing from our local observations and expertize. Of the many potential risk factors for heat-associated deaths that are tracked by MCDPH, two stood out with disproportionately high representation in 2016 cases: homelessness and age.
One possible contributing factor was an increase in unsheltered people experiencing homelessness in the region (MAG 2017). Unsheltered people experiencing homelessness are believed to be more vulnerable to environmental heat because of higher exposure and higher physical susceptibility related to pre-existing health conditions including mental health disorders (e.g. Longo et al 2017, Schmeltz and Gamble 2017). According to point-in-time survey data collected by the regional transportation planning association, Maricopa County has seen an increase in the general population experiencing homelessness since 2014 and experienced a 25% increase in unsheltered people experiencing homelessness between 2015 and 2016 (MAG 2017). Given the high degree of vulnerability to heat-associated with homelessness, an increase in the number of unsheltered people experiencing homelessness could increase the number of heat-associated deaths overall. According to MCDPH statistics, the number of heat-associated deaths among individuals experiencing homelessness over the period 2011–2015 ranged from 8 to 13 deaths per year, accounting for 9.5%–16% of total cases. However, in 2016 MCDPH reported 55 heat-associated deaths among people experiencing homelessness, which represented 35.5% of all heat-associated deaths recorded. Further, all heat-associated deaths for those experiencing homelessness were discovered outside, strengthening plausibility that living in unsheltered circumstances would increase a homeless person's vulnerability to heat. Though the causal pathway linking increased numbers of unsheltered people experiencing homelessness and the increase in heat-associated deaths among this population is still uncertain, the statistics suggest an association between shelter status and number of homeless deaths.
An additional population that experienced a high number of heat-associated deaths in the era of the MCDPH surveillance program was the 50–64 age group. In 2016, this age group accounted for 41% of heat-associated deaths. In a typical year, the 50–64 age group accounts for the highest number of heat-associated deaths, and this remained the case in 2016. However, in 2016 the rate of heat-associated deaths was also highest for the 50–64 age group compared, whereas it is usually the 65–74 and 75+ age groups that have the highest rate. When stratified by gender, the differences were more apparent; the mortality rate for 50–64 year old males well exceeded that of both 65–74 and 75+ males in 2016. This is significant as men consistently make up the vast majority of the deaths in this age group (73%–100% between 2011 and 2016) and maintain mortality rates that are at least twice as high as females indicating a potential high-risk group. Although homeless 50–64 year olds made up a significant proportion of the total deaths for 2016, homelessness does not appear to fully account for the unusually high rates in this age group. Given these statistics, it is possible that current intervention strategies overlook this population which may include many who are still of working age and maintain outdoor jobs, putting them at high risk for heat illness or death.
Limitations
This study was designed using records from a distinctive local heat mortality surveillance program. As such, the study findings are only directly relevant to one particular study area. Differences in reporting practices for heat-related deaths are highly variable between different jurisdictions and reporting agencies, and replication of this study design in other settings would inform the generalizability of results. Despite the advanced nature of the Maricopa County heat surveillance program, there are some uncertainties in the mortality time series that could have influenced our results. We cannot completely rule out the potential for error in the year-to-year counts associated with personnel changes and subjective interpretation of cases, although we have no evidence to suggest substantial changes in the reporting practices and systems from which the heat mortality data are generated. To the best of our knowledge any related errors should be random over time. Furthermore, there is some error introduced into the analysis related to the timing of heat-associated deaths: in cases where the body is presumed to be found after the day of death, the death is officially pronounced by the Office of the Medical Examiner at the time and date the body was found. We anticipate that any error in our models related to the time difference between actual and recorded death to be small given that lagged models of the temperature–mortality relationship were not superior to models with no lag. We also acknowledge that there is some uncertainty regarding the accuracy of the point-in-time survey data that we examined as an estimate for the size of the homeless population in Maricopa County. The point-in-time survey is collected by a predominantly volunteer group outside of the warm season and may not be an optimal representation of the summertime population. However, as is the case with the health records we examined, we have no evidence of major changes in data collection or reporting practices during our study period.
Although we adopted a number of different modeling approaches to estimate the exposure-response relationship, our focus was on temperature as the primary independent variable. The analysis did not span the full range of potential confounding variables or effect modifiers such as air pollutants, humidity, short-term mortality displacement, intra-seasonal changes in susceptibility, the influence of winter mortality on the size of the population susceptible to heat, and spatial variability in heat exposure associated with the urban heat island effect (O'Neill et al 2005, Stafoggia et al 2009, Ha et al 2011, Goggins et al 2012, Qiao et al 2015, Davis et al 2016 and Gasparrini et al 2016). We also did not explicitly measure the effects of 'heat waves' independent of the main temperature effect. Prior research and our own experience analyzing these records in Maricopa County leads us to expect that all of these effects would be small and not influence the overall findings (Harlan et al 2014, Petitti et al 2016). Finally, a more systematic evaluation of multi-year trends in heat-associated mortality risk factors would be a useful complement to this work.
One of the variables we used in our analysis is the categorical HeatRisk metric from an experimental NWS product. The model to estimate heat-associated deaths based on HeatRisk did not perform as well as the simple and complex models based on continuous temperatures and month. HeatRisk offered a theoretical advantage to other models because of its implicit consideration of current weather conditions relative to climatology, which has been suggested to be a risk factor for heat-associated deaths (e.g. Guirguis et al 2014). However, the categorical nature of HeatRisk severely limited the extent to which the statistical model could discriminate risk between small differences in high temperatures. HeatRisk is intended as a tool for public communication and decision-making and not for precise estimates of heat-associated deaths. We did find a higher risk of heat-associated death at more severe HeatRisk categories, which is encouraging in terms of the tool's potential to encourage meaningful behavior change on the most dangerous days.
Conclusions and recommendations
In general, our study findings highlight gaps in our current understanding of the drivers of year-to-year variability in heat-associated deaths and gaps in current local policies and programs striving to reduce the public health impacts of heat. We recommend more research attention toward analysis of local policies and programs that are intended to modify the association between temperature and human health. The demographic shifts we observed among the decedents in this study may suggest that public health and social interventions for specific highly vulnerable populations are not yet fully understood or effective in our region. We are severely limited, however, in our ability to speculate about the pathways and interactions among contributing factors that may have led to those shifts. Generating more data that can help researchers and practitioners understand behaviors and exposure circumstances contributing to risk of heat-related illness and death should be a high priority (e.g. Kuras et al 2017). These data would be especially important to help practitioners prioritize urban heat mitigation initiatives, which have significantly varying impacts on different parts of the diurnal temperature cycle (e.g. Hondula et al 2014). Our analysis suggests that efforts are needed to reduce both daytime and nighttime temperatures, as mean temperatures were more strongly correlated with heat-associated deaths than minima or maxima.
Our results highlight the importance of non-meteorological factors as drivers of the health burden associated with extreme temperatures, which have generally not been included in quantitative retrospective or prospective studies. Recent research indicates that projections of heat-related deaths may be more sensitive to assumptions about adaptation measures rather than global emissions scenarios or climate model choice (Gosling et al 2017), and more historical evidence concerning the relative importance of different factors that contribute to annual variability in heat-health impacts may help refine and guide future policy. Failure to account for other important components of the causal pathway that link outdoor conditions to health outcomes, which our study suggests were dominant factors for one notable year in one city, might lead researchers to reach incomplete or even incorrect conclusions regarding the current and future health risks associated with heat and the optimal strategies to reduce those risks. Further, the results highlight a shortcoming in preparedness and response efforts for heat in the study region that should be diagnosed more specifically and addressed as soon as possible. As global and urban-driven warming continue to increase temperatures in cities, further clarification of the complex interactions between the many social and physical determinants of risk of heat-related illness and death remains necessary to optimize climate adaptation plans and programs.
Acknowledgments
The authors acknowledge the efforts of colleagues at the Maricopa County Department of Public Health and the National Weather Service Weather Forecast Office in Phoenix, AZ for collecting and archiving the data resources used in this study. HP, DH, and MR were partially supported by the CDC's Climate-Ready Cities and States Initiative, grant no. 1 NUE1EH001318-01-00. MR was also partially supported by the CDC's Environmental Public Health Tracking Program, grant no. 1 NUE1EH001339-01-00. AU was partially supported by the Programme for research and mobility support of starting researchers, Czech Academy of Sciences, project no. MSM100421604 and by the Czech Science Foundation, project no. 18-22125S. The authors also thank Paul Chakalian at Arizona State University and Ken Komatsu at the Arizona Department of Health Services for their useful feedback on drafts of this manuscript.