

Abstract
The impacts of climate change on crop yields, as projected by a slew of impact assessments carried out since the 1980s, have brought the issue of future food insecurity to the fore. A meta-analysis of ∼27 000 data points from studies published over the last four decades reveals that at country level, average impacts of climate change on crop yields up to the 2050s are generally small (but negative) for rice and wheat, and modest for maize, provided farmers adopt practices and technologies such as improved varieties, planting at optimal times, and improved water and fertilizer management. These technologies also have the potential to reduce differences across political, economic and climatic regions. Once these are adopted, climate change may not add significantly to the challenge of food production for the majority of countries except for some potential hotspots distributed around the world. Massive investment, policy, and institutional support will be needed, however, to facilitate adoption and scaling-out of such practices, and to address climatic variability.
Export citation and abstract BibTeX RIS

Original content from this work may be used under the terms of the Creative Commons Attribution 3.0 licence. Any further distribution of this work must maintain attribution to the author(s) and the title of the work, journal citation and DOI.
Introduction
Systematic studies of climate change impacts on crop yields started in the 1980s resulting in a large body of research that has been ably summarized in many scientific reviews and IPCC reports. Most studies indicate increasing impacts of climate change on agriculture with time, with the largest impacts affecting low-latitude (tropical), lower-income countries of South Asia, Latin America and Sub-Saharan Africa that have limited adaptive capacity [1–4]. Farmers continuously make changes in their practices, such as planting dates, irrigation and fertilizer management, and in crops and varieties to manage many types of climatic risks (called incremental adaptation [4]). Several assessments including IPCC's AR5 have shown that such adaptation practices of farmers are beneficial, but the residual negative impact may still be substantial, especially in low-latitude countries [4]. Based on such assessments, many studies have projected significant impacts of climate change on global food availability [5], prices [6], resultant health issues [7] and concerns on feeding the world even in the near future [8].
Although there have been significant advances in impact assessment methods, considerable uncertainties remain surrounding the impacts, benefits, and costs of adaptation. Meta-analyses of a large number of studies has been used to better understand the impacts of climate change and adaptation on crop yields [9–11]. Most of these were limited in their regional scope and number of studies reviewed. Here, we present a new global meta-analysis at the country level, based on a comprehensive and systematic review of 157 studies from across the world published since 1984; resulting in a database of 27, 208 data points (refer to the SI; available online at stacks.iop.org/ERL/14/043001/mmedia for details). This study further differentiates itself from past research by scientifically combining results from multiple methods using a balanced weighting scheme used for the first time for meta-analysis of climate change impact assessments on crops.
By summarizing a large body of work on climate impact assessment on global agriculture, we quantify the size and variability associated with impacts of mean climate change on yields of the three major cereal crops (wheat, maize, rice), with different agricultural practices. These include changes in planting date, choice of cultivars, improved fertilizer and irrigation management; and their combinations (see supplementary information for details). These practices may not represent 'true adaptations' to climate change, as their comparative effect under both current and future climate scenarios is seldom studied [12]. It is argued that without such comparison, adaptation benefits can be exaggerated, as such practices are yield-enhancing, and not necessarily climate impact reducing. In such cases, yield growth due to technology is measured as opposed to adaptation benefit in future climate. Regardless, the effect of such practices and technologies in future climate can still give important clues for food security challenges [12] and prioritization of investments, in spite of whether they are qualified as a true adaptation to climate change or not. We have thus continued to label such data as adaptation, based on the common use of this term in the studies analyzed under this meta-analysis. With this background, the objectives of this study are (a) to summarize the research on climate impact assessment on agriculture, (b) determine the future food security implications of climate change impacts (with adoption of such agricultural technologies) and (c) identify potential hotspots of food insecurity (on the basis of projected climate change impacts, food supply rates and likely future demand).
Data and methods
A detailed dataset comprising of impact studies across major regions, since the 1980s was assembled. Literature search was inclusive with no preference given to specific region, method or crop. Only studies which dealt directly with agricultural productivity changes (and not projected production changes, farm income etc) were retained. References in all IPCC Assessment Reports were particularly focused and the database was later expanded with other studies. Main sources of data included:
1. Scientific Database (Scopus, Web of Science, CAB Direct, JSTOR, Agricola etc).
2. Journals and Open Access Repositories.
3. Institutional Websites (FAO Database, AgMIP Database, World Bank etc) and Google Scholar.
An exhaustive review of the selected publications was done. Finally, based on relevance, 27 208 data points were curated. These data points represented individual impact values (as a percent change in crop yield under climate change for a particular time period) reported by all the studies under different sets of assumptions (crop, country, timeslice, model settings, adaptation levels, different climate/crop/emission models, methodology, downscaling techniques or other input data) and were thus independent. Since the objective of this paper was to assess how climate impacts changed over time, no limitation was set to publication year (studies ranged from 1984 to 2016). The search terms used for the meta-analysis included 'agriculture' or 'crop 'or 'farm' or 'crop yield' or 'crop yields' or 'farm yields' or 'crop productivity' or 'agricultural productivity' or 'maize' or 'rice' or 'wheat' and 'climate change assessment' or 'climate impacts' or 'impact assessments' or 'climate change impact' or 'climate impact' or 'effect of climate' or 'impact of climate change'. The PRISMA statement for the meta-analysis is given below (figure 1).
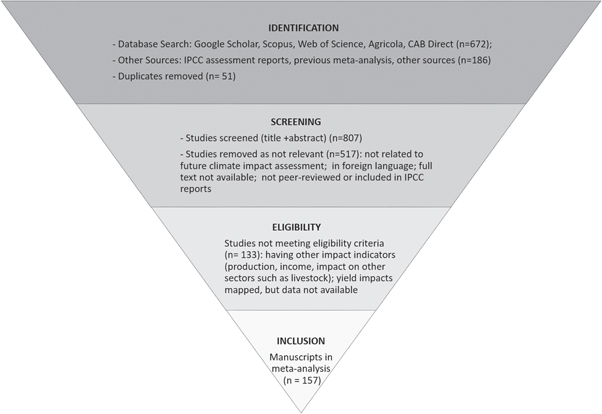
Figure 1. Methodology for selection of studies in this meta-analysis.
Download figure:
Standard image High-resolution imageThe dataset had variations in multiple indicators like agro-ecological conditions, crops, varieties, the methodology of impact assessment, climate models and emission scenarios used, carbon fertilization etc. Data from all the different climate models, crop models, and emission scenarios was pooled for all the studies. The final dataset curated at the end covered all major crops and regions. Details of the studies used in the meta-analysis and data description are given in supplementary information. Majority of the data belonged to three major crops of maize, rice, and wheat which were included in the analysis. An important consideration for the analysis was the geographical spread of data and representation of agriculturally important regions. Top five countries with the highest number of entries in our dataset (∼8% of total data) represent 70% of the world's cereal production (supplementary table 2). Therefore, there was no skewing of data towards a highly researched but agriculturally not-important country.
Quality control
Data was examined and outliers were identified for different projection periods. The first screening for outliers was done by identifying values outside 5 and 95 percentiles for a specific country, crop, and time period. The identified points were then examined in detail as to the reasons for impact values to be extreme (positive/negative), use of extreme climate change scenario, the accuracy of the study, input setting of the model (subsistence/rainfed agriculture) etc. The impact data where such extreme values could not be explained scientifically, and which differed significantly from most studies of particular country and projection period were then identified as outliers (example yield loss of −50% in a temperate country for the 2020s in wheat). In the end, 76 such points were identified and dropped from the analysis.
Baseline correction
Changing baselines were identified as a major source of bias as recent studies with later baselines (for e.g. 1970–2000) would invariably show lesser impacts for the same timeslice than the studies with older baselines (1960–1990). Studies with recent baselines may consider impacts of climate change that had already taken place, autonomous adaptation, and technological growth. This bias was removed by considering climate change impact per year relative to the baseline used and thus final figures used in this analysis refer to a fixed baseline and timeslice for projections (by fixed year gap between mid-baseline and mid projection point- supplementary table 1).
Statistical analysis
Meta-analysis procedure—calculation of country-level impacts
Global studies dramatically increased the number of data points as they covered multiple crops under different scenarios and timeslices. Use of balanced weighting technique, however, ensured that all studies, irrespective of scale and number of data points, were similarly valued. Individual impact values reported in the studies rarely reported prediction intervals around the impact estimate (for each data point), therefore the variance of the ensemble mean was calculated as standard error for each study (for every crop, country, and timeslice). Different studies were thus weighed based on this calculated variance around ensemble mean (of every study for a particular crop, country, and timeslice). Due to inherent differences in various studies (like methodologies, climate and crop models used, spatial scale, downscaling techniques and numerous other factors) which could result in heterogeneity, a random effects model was applied for estimating mean effect size (average impact for every country), which takes into account heterogeneity among various studies and calculates average impacts by accounting for both within-study and between-study variance [13–15].
By this procedure, mean effect size (impacts with and without adaptation) was calculated for every country, crop, and timeslice. Please note, only global, regional and national studies were used for calculating country-level impacts. Single site-based studies which carried simulations of only one specific site in a country were omitted from the analysis, as they were not considered representative of impact for the entire country (especially large area countries with diverse agro-ecological regions), but were used in regression analysis in table 1.
Table 1. Relation of crop yield impacts with adaptation to different variables (year of publication, modelling technique, method, climate and crop model, and spatial scale), based on more than 25000 data points. One thousand bootstrap replications were used to improve the accuracy of the estimates. Stars indicate the significance level of the variable (p-value less than 0.05).
| Variable | Coefficient | S.E. |
|---|---|---|
| Year of publication | 0.226*** | 0.0196 |
| Modelling technique potential yield = 0 (actual yield = 1) | 17.16*** | 2.652 |
| Method statistical model = 0 (process = 1) | 4.795 | 3.912 |
| Climate model single model = 0 (ensemble = 1) | 3.115* | 1.852 |
| Crop model DSSAT = 0 (non-DSSAT model = 1) | 1.002** | 0.314 |
| Spatial scale site/national = 0 (regional/global = 1) | 3.647*** | 0.817 |
| Crops maize = 0 rice | 1.895** | 0.414 |
| Wheat | 4.642* | 1.490 |
| Other crops | 1.418 | 1.391 |
| Timeslice (2020s = 1) | ||
| 2050s | −1.671* | 0.268 |
| 2080s | −3.316*** | 0.268 |
| Carbon fertilization yes CO2 = 0 (No CO2 = 1) | −5.6137 | 4.8562 |
| Constant | −450.59*** | 40.367 |
| R-squared = 0.198, N = 25 641 |
Global studies provided average impact values for all countries across the globe for multiple scenarios, sometimes also for countries with limited cropping area. Impact values from such studies were used in our analysis, after baseline adjustment. The major global studies used in this review [1, 2, 16, 17] included different adaptation strategies (changes in planting dates, dynamic irrigation, nutrient management or their combination) and also included carbon fertilization effects. For regional studies, if specific-country level estimates were not available, the regional mean impact was applied to every country within the region.
National studies focused on a particular country and either gave an average impact for the entire country (which was used in the analysis) or a series of site/sub-region specific impact values covering the major cropped area for the crop under investigation. Selected studies which fell into the latter category were scrutinized for representation of geographical expanse of the selected crop in that country, and their area-weighted mean was used as impact estimate for the country.
Average impacts for every country were then plotted against latitude in figure 2. Only countries with crop area more than 10 000 ha were shown. Since latitude is the centroid for every country, it may not correctly represent the agriculturally important regions, specifically for crops like rice which is majorly grown in tropics and wheat, which is grown in high latitudes. Centroid latitude of large countries like China, India, and Brazil was adjusted based on global gridded cropping area maps for rice, wheat and maize [18]. These country-level impacts derived from the meta-analysis were used in figures 2, 3, 5 and supplementary figures 2 and 4.

Figure 2. Average impacts of climate change with adaptation (blue) on yields of wheat, rice, and maize for different timeslices across latitudes. Average impacts without adaptation (orange bands) are also shown for reference. Results are derived from multiple data points across different timeslices and are relative to a baseline of 1960–90 (see SI for details). Each dot represents centroid of a single country (see SI for details). Solid lines show best fits of impacts with latitude. Shaded bands indicate a 95% confidence interval of bootstrapped regressions of impacts with 1000 replications.
Download figure:
Standard image High-resolution image
Figure 3. Average impacts of climate change with adaptation for different geopolitical, economic and climatic groups. The results are average of all crops and timeslices. Panel 1: NA- North America, EAP- East Asia & Pacific, ECA- Europe & Central Asia, SA- South Asia, LAC- Latin America & Caribbean, SSA- Sub-Saharan Africa and MENA- Middle East & North Africa. P values show significance level based on Kruskal-Wallis Test. Post-hoc Dunn's test shows Sub-Saharan Africa and Middle East and North Africa to be significantly different from other regional groups as denoted by letters. Panel 2 shows average impacts after adaptation for temperate and tropical countries. Panel 3 shows different country income groups (1 = high income, 2 = upper middle income; 3 = lower middle income, 4 = low income).
Download figure:
Standard image High-resolution imageRegression analysis
To understand the importance of various modelling approach in influencing climate change impacts, a general linear model was fitted to the data to understand the effects of publication time, region, spatial scale, climate, and crop models, methodology and modelling approach on the results (table 1). The model was run for average impacts with adaptation as a dependent variable, to capture responses from a larger set of data. Site-based studies were included in the analysis, as it did not require analysis of country-level average impacts. Even when the number of data points was large, bootstrapping with thousand replications was used to improve the accuracy of the estimates [19]. Coefficients for independent variables in the regression should be interpreted with caution as advancements in assessment methodology (use of ensembles, regional downscaling, global coverage of studies and newer emission scenarios and crop-climate models) are correlated with research time. Therefore, statistically significant time trends are a function of these research advancements (supplementary figure 1). Regression diagnostics confirmed normally distributed residuals and homogeneity with fitted values. All statistical analysis was conducted using STATA software (StataCorp. 2011. Stata Statistical Software: Release 12. College Station, TX: StataCorp LP) and graphs were made in OriginLab.
Food production gap analysis
Several countries have a considerable gap between food demand and supply. This gap could become larger with climate change increasing food security concerns. To identify such hotspots, we first quantified food production gap where current food production growth rate is lagging behind the needed growth rate for food in 2050 (figure 5). Future demand projections for 2050 were taken from IFPRI [20] (http://casemaps.ifpri.info/files/climatechange/casemaps.html). Although multiple studies were reviewed for demand projections (supplementary table 3), IFPRI data was chosen for comprehensiveness of the model, data availability for major countries and crops, and dynamic price consideration (compared to constant price scenarios in many other studies). The demand calculation considers future population and income, land-use and crop area changes, market forces and price assumptions, dietary patterns, and future demand for biofuels. Country-level (crop specific) current yield growth rates were collated from Ray et al 2013 [21]. Baseline corrections were made to keep the timeline same for the variables as described in the meta-Analysis section. Figure 5 in the main text was derived from categorizing countries according to food production gap and impact of climate change. Average impacts after adaptation estimated from the meta-analysis were used to calculate impacts as a percentage of food gap, to identify how climate change will intensify or alleviate food security for the 2050s globally. Countries where food gap is already high (projected demand is lagging behind current supply rates) and climate change will further increase the gap by more than 10% (>10% loss on food gap) were grouped in the first category shown as red in figure 5. Some countries which were on the boundary (marginally food secure with projected demand slightly lower than current supply rates) but showed very high impacts of climate change (>10% loss on gap) were also included in this category to account for any uncertainty in demand projections. Next group in yellow consisted of countries where there is high food gap, but climate change will not adversely widen the gap in future (average impact <10% loss on food gap). A unique case of countries with high food gap but positive impact of climate change was shown by the color purple in the map. Relatively food secure countries with no production gap and low or positive impacts of climate change were shown by green and blue colors, respectively.
Results and discussion
Scatterplots in figure 2 show country-level climate change impacts with adaptation in relation to latitude (country centroids) and across different timeslices for the three cereals. We also show impacts without adaptation, for reference. Losses in crop yields due to climate change and without adaptation are high and increase with time. Wheat and rice yield losses increase from 6% mean area-weighted global loss in the 2020s to 12%–15% by 2080s. Similarly, for maize, our meta-analysis shows an increase from 9% losses in the 2020s to 20% in the 2080s without adaptation. Values higher than these are also reported for different crops in individual countries and in a few global studies, which had different baselines and modelling approach [22–24]. Low latitudes generally show higher yield losses except for wheat, which shows only a small reduction until the 2050s. Combined area-weighted cereal loss without adaptation was 6% in the 2020s, 9% in the 2050s and 15% in the 2080s. Analysis from paired studies (impacts and adaptation are studied together) shows a similar regional pattern with tropics showing more adaptation potential, although the number of countries are fewer because of limited data points (supplementary figure 3).
After considering farmers' adaptation, especially wheat and rice show relatively small residual impacts across all timeslices (figure 2). The area-weighted mean global impact (yield loss) varied from 1 ± 0.03% in the 2020s to 4 ± 0.16% in 2080s for wheat, 3 ± 0.08% in the 2020s to 6 ± 0.23% in the 2080s for rice, and 6 ± 0.24 in the 2020s to 13 ± 0.6% in the 2080s for maize. These values are different than many previous estimates [1, 2, 9, 16, 25]. It must also be noted that almost all simulation and statistical models have high uncertainty [26], and such small net residual impacts (as above), could be within the error band (generally 5%–15%) of the method.
Several previous studies have shown that temperate, high-income countries are less vulnerable than tropical, low-income countries of Asia, Africa and Latin America [24, 27]. Figure 2, however, shows that the response curves of impacts with adaptation are more uniform and flat compared to those without adaptation, indicating overall reductions in both magnitude and inter-regional differences. Paired impact and adaptation studies also show similar patterns (supplementary figure 3). Our results thus show that such differences may not necessarily be large or significant across political, economic and climatic regions after adaptation (figure 3). Impacts in the tropics were greater (3%–4%, but statistically insignificant) than in temperate regions. Crop yields in the Middle East and Africa were significantly most impacted compared to other regions. There was no significant difference in impacts across other regions. Similarly, country income groups showed no significant difference between them although higher-income countries showed reduced impacts. Adaptation can thus help to reduce inter-regional differences even though it is understood that such regional aggregation may hide very substantial local variation.
The projected impact results with adaptation were further disaggregated into different adaptation types modelled in the literature reviewed. This was done to identify the adaptation potential of different sets of technologies and practices globally. Dynamic nutrient and irrigation application resulted in large reduction of climate change impacts. (figure 4). The dynamic application of nutrients and water showed high yield gains in almost all countries (barring some tropical countries in Sub-Saharan Africa), albeit raising not only implementation challenges but also serious concerns regarding resource availability and environmental footprint of food production vis-a-vis sustainability of the planet. Dynamic irrigation application alone, showed similar pattern but smaller benefits of adaptation. Planting date and cultivar changes showed fewer inter-country differences than observed in the previous set of adaptations and were unable to reverse the impacts of climate change. In terms of feasibility, this set of adaptation is the easiest to implement than other options. In fact, many farmers all over the world already adjust their planting dates to escape extreme climatic risks, especially in rainfed regions. This, in addition with the use of improved cultivars (mainly short duration varieties), can help in coping with changes in future climate; however, there will still be a decline in productivity, especially for maize in long term. The fourth set of adaptation was a combination of planting date, and cultivars supplemented with additional irrigations. This option also helped in increasing productivity, especially along the tropics and sub-tropics, but did not alter the overall impacts significantly than adaptation from planting date and cultivars.

Figure 4. Scatterplot of the average impacts of climate change with different adaptation types along latitude, for maize crop in 2080. For other crops, refer to the SI. Results are derived from multiple data points across different timeslices and are relative to a baseline of 1960–90 (see SI for details). Each dot represents centroid of a single country (see SI for details). Solid lines show best fits of with latitude. Shaded bands indicate a 95% confidence interval.
Download figure:
Standard image High-resolution imageA similar analysis was repeated for rice and wheat in the 2080s. Again, dynamic nutrient and irrigation application showed the highest productivity gains in both crops followed by planting date, cultivar and irrigation, and least gains were observed in planting date and cultivars only. Rice showed lesser impacts than maize for the 2080s, and average impacts after adaptation for wheat were close to zero, with very high productivity gains in temperate countries. However, it is to be noted that many other types of adaptation practices such as crop diversification, different combinations of cropping systems (agroforestry etc) have not been covered in the reviewed studies, and these can act as potential strategies to manage impacts of climate change in many countries. It is also difficult to isolate individual and additive effects of all the adaptation options (see SI table S7) as the reviewed studies did not model them separately, nor cover all the countries.
A general linear model was fitted to the entire data set (table 1) to understand the influence of modelling approach on climate change impacts. Studies carried out in recent years exhibit a significantly reduced net impact on crop yields compared with earlier studies. To illustrate, assessments carried out in 1980 showed a 7% higher yield loss across all crops due to climate change as compared to studies done in 2015. The results also showed that assessments using a potential yield modeling approach (in which the effects of agronomic management and different soils are controlled) project significantly larger impacts on crop yields as compared with assessments using actual yield approach (water and nutrient-limited). Since a larger number of studies done pre-2000 used potential yield models, it can be inferred that the time trend observed with the year of publication is to some extent related to changes in the modelling approach over time. Recent use of ensembles was also found to moderate impacts of climate change compared to the use of single models [28]. Similarly, global and regional studies, more common in recent times, show less impact compared with national and local studies. We did not find any significant effect of statistical versus process-based modelling methods [29]. Improvements in methods in terms of greater use of spatially distributed weather and soil data, new and multiple crop models, observed agronomic management in simulations, as well as ensemble approaches and the inclusion of global studies [28, 30], have all led to reduced estimates of projected yield effects, compared with earlier studies.
There is considerable focus on estimating fertilization effects of CO2 in literature [31], along with mean temperature change [32, 33]. Studies which do not include carbon fertilization show a larger decrease in crop yields in some regions [22]. Our linear model also shows that impacts without CO2 fertilization were 5% higher as compared to studies where CO2 effects were included (table 1; supplementary figure 6). This is, however, unlikely to cause any significant bias in our meta-analysis since 99% data used in the review considered CO2 effects.
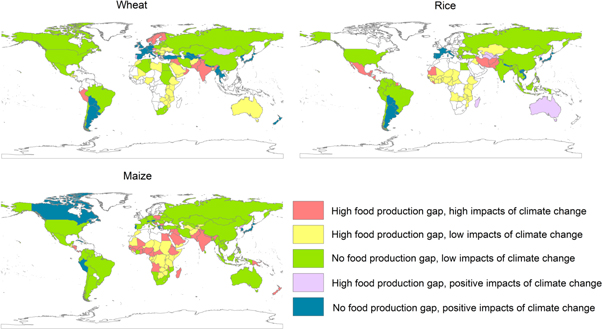
Although our results show smaller country-level impacts of climate change after adoption of improved agricultural practices and technologies, even these could be critical for food security of many countries [34], especially where the current crop yield growth rate is low or already lagging behind future crop demand and for smallholders [35]. Of course, trade can fill many food production gaps, but many countries, especially in the developing world, aim to be food self-sufficient and to reduce food imports. Figure 5 shows that after the adoption of such technologies, neither the food production gap nor climate change impacts are major issues for wheat, rice and maize insecurity for many countries until the 2050s. This includes large producers such as USA, China, Canada, Russia, Brazil, and Argentina. Such countries need to ensure that the current growth rates of food supply are maintained and the potential effects of climatic variability are addressed. For wheat, many top-producing countries in Europe and Asia (Russia and China, for example), Sub-Saharan Africa (Ethiopia and South Africa), and North America (USA) show moderate production gaps but climate change at the national level is likely to have only a small additional impact on their production gaps, after adaptation. These countries might then focus more on strengthening their food supply, while also remaining aware of climate change effects at local and sub-national scales. This could be through trade, incremental adaptation and developing new higher-yielding varieties for countries which are already near their potential yields. On the other hand, countries such as India, Pakistan, Iraq and Syria in Asia and Peru in Latin America have large wheat-consuming populations and have to address both problems of likely high production gaps due to increasing demand and high climate change impacts, which will further widen this gap. These countries may need to combine technology growth with transformative actions in terms of land use and high-yielding, stress-tolerant varieties to remain wheat secure, from a self-sufficiency perspective.
Figure 5. Hotspots of climate change based on assessments of impacts after adaptation on crop yield at country scale for the 2050s and the food production gap (the difference between 2050 food demand and current food supply). Countries with high food gap and high impacts of climate change are most vulnerable. Countries with cropped area more than 10 000 hectares only are shown, resulting in relatively minor countries in the map (e.g. Middle-Eastern countries for rice).
Download figure:
Standard image High-resolution image
For rice, China, India, all Southeast Asian countries and USA, comprising two-thirds of the total rice growing area, show no production gap and also exhibit small impacts of climate change, after adaptation. Only a few Central Asian countries have rice production gaps (due to low current supply rates and high projected demand for rice in future) and climate change will further intensify them. These countries would also need transformative adaptation to remain rice secure. In Australia, the projected rice demand is higher than the current growth but climate change may help in reducing the gap. Most rice growing African countries such as Guinea and Nigeria are also rice insecure but with limited likely effects of climate change after adaptation; they may need to prioritize action on addressing food gaps and focusing on scaling out the adaptation. Interestingly, countries such as North Korea are also significantly rice insecure but climate change may provide them some opportunity to alleviate this, thereby calling for different actions than most other countries.
In the case of maize, many countries of Sub-Saharan Africa and South Asia, are the primary hotspots where the production gap may increase due to climate change. Other countries like Kenya, Tanzania, Uganda and Zambia in Africa and Guatemala and Haiti in Latin America and the Caribbean also have big maize production gaps but with relatively small climate change impacts, after adaptation.
Our approach of linking climate change impacts with food supply and demand provides a new way of identifying the vulnerability of regions and crops to climate change and helps in prioritizing actions, with the proviso that trade will be one option of filling many gaps that develop. The analysis also avoids highlighting countries where generic simulations would show large impacts but the crop has limited acreage (of less than 10 000 hectares). It has helped in identifying several new hotspots of climate change impacts and has removed several others from the list. For example, previous global studies [2] showed Central Africa and Latin America as particularly vulnerable from projected productivity losses in wheat, whereas our results show fewer impacts; in Latin America due to moderate yield growth rates, and in central Africa due to limited wheat growing area. Earlier studies also missed the vulnerability of several central European countries in wheat and maize, especially w.r.t their currently stagnant yield growth rates and projected crop demand for future.
We are aware that the country assessments could be underestimating impacts due to many uncertainties and gaps in data and methods, such as impacts of pests, weeds, and diseases; climate variability effects; and impacts could be substantially larger at local scale due to limitation of current models in including key mechanisms [12, 36–38]. The inadequate ability of current crop models to handle climatic variability could be relatively more important in tropics [27]. Some studies have even found the limited scope of adaptation in eliminating the impacts [39], although most of their underlying data came from few countries. In this paper, we carefully examine the role of adaptation at a global scale, by drawing sufficient data points for every country.
Two key implications of this work are highlighted. First, improvements in assessment methods show that adaptation has considerable potential to mitigate the impacts of climate change on the major cereals. Pathways for these are largely known [40, 41], but the economic costs and institutional support for these adaptation strategies could be a constraint for many lower-income countries. Second, adaptation has the potential to significantly reduce inter-regional differences in national level climate change impacts. This is partly due to the existence of large yield gaps and low levels of intensification in vulnerable low-latitude countries that allows considerable scope for increasing yields. By comparison, countries in which crop yields are already close to their biophysical limits have only limited scope to change. More transformative adaptations may be needed in high-yielding countries, as well as in particular production environments in low-yielding countries. Thus, there is a need for a phased implementation of different adaptation types based on a more comprehensive understanding of geography, crop production efficiencies, likely future changes in agricultural technology and trade.
Acknowledgments
This work was implemented as part of the CGIAR Research Program on Climate Change, Agriculture and Food Security (CCAFS), which is carried out with support from the CGIAR Trust Fund and through bilateral funding agreements. For details, please visit https://ccafs.cgiar.org/donors. The views expressed in this document cannot be taken to reflect the official opinions of these organizations. We greatly appreciate comments on an early draft by Gerald Nelson, formerly with International Food Policy Research Institute, Washington DC and Julian Ramirez of CIAT, Colombia, and the comments by several colleagues during internal presentations and two anonymous reviewers, which have helped greatly in improving this paper.