
Abstract
Global change is expected to lead to range shifts of plant species. The ecological mechanisms underpinning these shifts are currently not well understood. Here, we compared ecological responses possibly underlying southern range contraction and northern range expansion of Empetrum nigrum, a key species in northern heathlands, which may be related to global change. We hypothesized a negative response to warming in the 'south' (i.e. the Netherlands) and a positive response at the northern range margin (the tundra on Svalbard). Open top chambers (OTCs) were used to simulate global warming. In the 'south', OTC warming caused enhanced shoot growth and growth rate, biomass increment, advanced phenology, larger and heavier berries of Empetrum, while its growing season was extended by 75 days. Under OTC warming co-occurring Calluna vulgaris also showed an increased growing season length (by 98 days) as well as increased shoot growth rate and biomass growth, plant cover and height. Still, we found no evidence for increased competitiveness relative to Empetrum. In the 'north', Empetrum responded with increased shoot and biomass growth, enhanced berry development and ripening to warming. These responses exceeded those of co-occurring Cassiope tetragona with the exception of its biomass response. The direct and indirect ecological responses found do not readily explain the observed northward retreat of Empetrum at the southern range margin. The direct ecological responses found at its northern range margin are, on the other hand, in line with the increased occurrences of this species on Svalbard.
Export citation and abstract BibTeX RIS
1. Introduction
Current contraction and expansion of the geographical distribution range of plant species has often been attributed to global change (e.g. Walther et al 2002, Root et al 2003) and our study focuses more specifically on artificial warming by open top chambers (referred to as OTCs). Range margins of 1598 Northern Hemisphere species moved on average 6.1 km northward per decade or 6.1 m upward per decade (Parmesan 2006) and rapid northern shifts in plant distribution are likely the result of climate warming (Aerts et al 2006). Especially plants that grow at their natural range margins are expected to be vulnerable or responsive to climate change (Aerts et al 2006, Crawford 2008, Fosaa et al 2004, Menzel et al 2006, Neilson et al 2005, Walther 2004, Walther et al 2002, Wilson and Nilsson 2009, Root et al 2003). Additional evidence for the susceptibility of plant species to global warming comes from modelling studies (Fosaa et al 2004, Harrison et al 2006, Trivedi et al 2008, Neilson et al 2005).
Both Sturm et al (2001) and Myers-Smith et al (2011) discuss observations of rapidly circumarctic increase of shrub abundance. Global warming is considered to be the primary driver of similar changes in Alpine vegetation where ongoing range contraction of subnival and nival species at the lower altitudinal limit and a concurrent expansion of Alpine pioneer species at the upper limit are observed (Pauli et al 2007). This increased (Arctic) shrub expansion may not solely be due to warming during the summer growing season, but also to warming during winter (Chapin et al 1995, Sturm et al 2005).
Empetrum nigrum (referred to as Empetrum) is a key species in northern heathlands and has been linked to (sub-) Arctic shrub encroachment (Wilson and Nilsson 2009). Empetrum mainly consists of diploid dioecious plants in boreal-Arctic Europe and of tetraploid monoecious plants at high altitudes and latitudes (Elven 2011). Both subspecies vary considerably with overlapping morphological characters and both are known to co-occur and hybridize (Li et al 2002, Suda 2002). Differences between diploids and tetraploids are not regarded relevant for the present study (cf Nilsson et al 2000). Overall these long-lived evergreen prostrate dwarf-shrubs are considered to be morphologically and physiologically adapted to ecological conditions in a similar way. Therefore we justify a comparison of responses of Empetrum to increased temperature at the southern and northern range margin is liable.
The European distribution of Empetrum is limited to (sub-) Alpine and (sub-) Arctic biomes and the species is essentially boreal-Arctic in its climatic preferences (Bell and Tallis 1973). In the Netherlands, Empetrum is at its southern European range margin (Rozema et al 1985, Van der Meijden 2005). During the past decades, Empetrum occurrences in Great Britain, Ireland (BSBI 2011, NBN 2011), Germany (Floraweb 2011) and the Netherlands (Van der Meijden et al 1989) decreased. Simultaneous declines in Arctic–Alpine and boreo-montane lichen species have been found (van Herk et al 2002), while the number of thermophilic plant species increased significantly recently (Tamis et al 2005). Both northward retreat and reduced occurrences at lowland sites of Empetrum in Britain have been attributed to increasing winter temperatures (Bell and Tallis 1973, Van der Meijden et al 1989). Simultaneously, Empetrum invaded Scandinavian mountains (Kullman 2010, Wilson and Nilsson 2009). On Svalbard, it was until recently observed in a few localities only (Elvebakk and Spjelkavik 1995, Rønning 1996), but the number of observations is increasing markedly (Alsos et al 2007, 2011). Also changes at its northern margin may be related to global warming, as temperatures at both margins have been rising in recent decades (table 1; DNMI 2011). If so, a further northward retreat at the southern range margin and increased occurrences in Svalbard are to be expected as a further increase of the annual global average air temperature by 1.4 °C to 4.0–5.8 °C is predicted for high latitudes in the northern hemisphere for this century (IPCC 2007)4.
Table 1. (A) Climate characteristics at the southern range margin of Empetrum nigrum at 52°N, Bergen aan Zee, the Netherlands and at the northern range margin at 78°N, Endalen, Svalbard, Norway. ∗ = significant at 0.05; ns = not significant. Ambient south: www.knmi.nl. Ambient north: www.dnmi.no. ΔT °C represents the temperature difference between OTC and control plots. For south average ΔT °C values for the period 2005–10 and for north average values for the period 2008–10 are given. (B) Growing degree days (GDD), representing accumulated heat (°C), with thresholds of 1 and 5 °C; growing season length (GSL), representing the number of days exceeding thresholds of 1 °C or 5 °C. Ambient south: www.knmi.nl. Ambient north: www.dnmi.no.
| (A) | ||||||||
|---|---|---|---|---|---|---|---|---|
| Ambient south | OTC | Ambient north | OTC | |||||
| Temp (°C) | 1961–90 | 1991–2010 | Change | ΔT °C 2005–10 | 1961–90 | 1991–2010 | Change | ΔT °C 2008–10 |
| Annual | 9.3 | 10.2 | + 0.9∗ | + 1.2∗ | − 6.0 | − 4.6 | + 1.4∗ | |
| Summer | 14.3 | 15.1 | + 0.8∗ | + 2.0∗ | 4.9 | 5.2 | + 0.3∗ | + 1.7∗ |
| Winter | 3.2 | 3.9 | + 0.7∗ | 0.0 ns | − 14.2 | − 11.7 | + 2.5∗ | 0.0ns |
| (B) | ||||||||
| 1961–90 | 1991–2010 | Change | 1981–90 | 1991–2000 | 2001–10 | Change | ||
| GDD1 | 362.7 | 401.9 | 503.7 | + 141.0∗ | ||||
| GDD5 | 1716 | 1915 | + 199∗ | 7.6 | 85.9 | 131.2 | + 56.6∗ | |
| GSL1 | 91.3 | 97.6 | 110.8 | + 19.5∗ | ||||
| GSL5 | 270 | 291 | + 21∗ | 91.3 | 43.4 | 60.9 | + 21.7∗ | |
Global warming may affect the geographical distribution of Empetrum through its impacts on the growing season length (referred to as GSL) and the number of growing degree days (a measure for the growing season intensity, referred to as GDD) which in turn is expected to result in phenological advances of leafing, flowering and fruiting (Parmesan and Yohe 2003, Parmesan 2006, Root et al 2003, Førland et al 2004, Linderholm 2006). The phenological based GSLp increased with 10.8 days since 1993 (EPG 2011) and by 1.1–4.9 days on average per decade since 1951 (Menzel et al 2006). At its southern margin, meteorological GSL has increased with 29 days since 1901 (KNMI 2011) and with 21 days since days 1990. This lengthening is particularly attributed to higher temperatures in early spring and late autumn (Visser 2002). At the northern margin, the onset of the growing season associated ecologically with the flowering of Salix polaris (unlike the end, associated with the yellowing of leaves of Salix polaris) showed large year-to-year variation. Despite this variation, during the period 2000–9, the area with a growing season exceeding 60 days clearly extended (Karlsen et al 2010).
Despite the ecological relevance of Empetrum, its documented range shifts and co-occurring warming, the ecological mechanisms through which its geographical distribution is affected, are currently not well understood. Here, we present evidence, based on experimental warming, on the extent to which warming influences phenology and growth parameters of Empetrum, both at its southern and northern range margin. We hypothesized experimental warming to differently affect growth and flowering phenology of Empetrum at its respective natural margins. At the southern range margin, we expect a reduction in plant growth parameters including shoot growth rate, biomass increment, berry weight and diameter, area covered and plant height. We expect advanced flowering phenology as Empetrum is a 'cool' boreal-Arctic species and, since vegetative growth of Empetrum starts only after flowering, also an earlier onset and end of the vegetative growth is expected. The growing season length is expected to reduce at the southern margin. At the northern margin, we expect shoot growth rate, biomass increment, berry weight and diameter, area covered and plant height to increase, flowering phenology to advance and an extended vegetative growing season. For leaf life span (referred to as LLS) we expect a reduced time needed to develop new leaves in a warming climate and thus LLS to reduce with OTC warming at the southern and north range margins. Also we expect LLS to be less in the warmer 'south' than in the colder 'north'. These expected direct ecological responses may help to explain the observed range contraction 'south' and the increased occurrences 'north'. Given that the northward retreat might additionally be related to decreased competitiveness of Empetrum relative to co-occurring Atlantic-continental Calluna vulgaris (L.) Hull (referred to as Calluna), while the increased occurrences of Empetrum might also be linked with increased competitiveness of boreal-Arctic Empetrum relative to the co-occurring species Cassiope tetragona (L.) D. Don (referred to as Cassiope), we also determined the concomitant changes in growth and phenology parameters for these species.
2. Materials and methods
2.1. Site description
At its southern range margin, Empetrum was studied in a coastal dune valley near Bergen aan Zee, the Netherlands (52°40'N, 4°38'E; 4–5 m above sea level), together with co-occurring Calluna. At its northern range margin Empetrum was studied at Endalen (78°11°N 15°44°E) with its co-occurring Cassiope.
2.2. Experimental warming (OTC)
In March 2005, OTCs (diameter 2.20 m; height 0.6 m) were installed in Bergen aan Zee (Henry and Molau 1997, Marion et al 1997); OTC (n = 10) and control plots (n = 10) were randomly chosen with Empetrum and Calluna present in each plot. From the end of May 2008, a paired setup, due to the limited presence of Empetrum, was chosen for OTCs (n = 10) and control plots (n = 10) at Endalen. At both range margins, OTCs stayed in the field year-round.
2.3. Growing degree days
GDD value is a measure for the growing season intensity and is defined as the annually accumulated degree sum above a chosen threshold temperature (Førland et al 2004) and is calculated as
where Ti is the daily mean temperature (°C) for day i and x the selected threshold temperature. We used the evidence based threshold temperature of 1 °C, as in Svalbard flowering of Empetrum starts immediately after snowmelt. We retrieved data from the Dutch (ECAD 2011) and Norwegian meteorological databases (DNMI 2011).
2.4. Growing season length
GSL is meteorologically expressed as the number of days with average temperatures above the threshold temperature of 5 °C (GSL5). We calculated GSL5 for 'south' (ECAD 2011) and GSL1 (with a threshold temperature of 1 °C.) and GSL5 for 'north' (DNMI 2011). In addition a phenological based growing season length (GSLp) was assessed by determining the onset of vegetative growth, indicated by a bright green colour of the apex of shoots, senescence (brown colouring) of the leaves indicated the end of vegetative growth.
2.5. Temperature and plant parameter measurements
Temperature and plant parameter measurements, randomly labelling of shoots (n = 5 per species per plot) and positioning of temperature loggers were performed in a central section of 50 cm × 50 cm inside each OTC and control plot. Temperature was measured synchronously in OTCs and control plots at hourly intervals with Gemini Tinytag loggers (TG-0050, Chichester, UK) that were installed 10 cm above soil level. The loggers were protected from direct sun radiation and precipitation by a plastic screen, ø = 10 cm. Average temperatures over 24 h, 12 h (06.00–18.00) and 4 h intervals (10.00–14.00) were calculated to assess differences between OTCs and controls.
Shoot length increase (millimetre) was determined from the year boundaries on stems to the shoot apex. Measurement was abandoned when no growth was observed during two weeks at the end of August (at the northern margin) or September (at the southern margin).
Shoot growth rate (mm day−1) was calculated as 1/2Lmax/t75 − t25 where Lmax is the maximum shoot length and t75 − t25 the number of days between the date when 75% respectively 25% of the final shoot enhancement was attained (Bannister 1978). Plant cover (m2) and height (cm; n = 10 per plot) of Empetrum and Calluna were measured in OTCs and control plots, to determine the possible effect of OTC warming on the competition between these species. Empetrum and Calluna plants were mapped per plot (scale 1:15 cm) and plant cover was determined in Adobe Photoshop CS4. In Bergen aan Zee, the accumulated annual biomass increment (2005–10) was determined after destructive final harvest in February 2011. At Endalen, we determined the mean annual biomass increment (2008–10) of harvested individual shoots of Empetrum and Cassiope. Immediately next to the OTC experiment, annual shoot growth (n = 5) in plots (10 cm × 10 cm, n = 5) with equal cover (50%) of both species ('mixed') and in plots (10 cm × 10 cm, n = 5) with either Empetrum or Cassiope ('monospecific') was determined. LLS was determined as the ratio between the number of green leaves and total number of leaves or leaf scar positions developed per year (Karlsson 1992).
Flowering phenology was assessed, with intervals of 3–4 days, as the percentage of phenological stages P1–P6 (the gradual description for male flowering development from P1: bud visible, to P6: male parts diminish and dry out) and P1–P6 (the gradual description for female flowering from P1: petals and stigmas visible, to P6: black berries, ø = 5–10 mm; Molau 1996). At Bergen aan Zee, the measurement of flowering phenology started the first week of February and lasted until after full senescence of anthers was reached by March and berries had coloured completely black by May and June. At Endalen, measurements started immediately after snowmelt in early June and assessment was finished at the end of August, when some ripe (black) berries were present. Berries (n = 30 per plot) were randomly collected ('south': July, 'north': August) and their diameter and weight determined. Simultaneously with phenological observations, the onset of vegetative growth, indicated by a bright green colour of the apex of Empetrum shoots was determined as well as the end of the vegetative growth period indicated by senescing (brown colouring) of leaves; growth parameters of Cassiope (2008–10) were determined on 14 June 2011.
2.6. Statistics
Differences between average air temperature in control plots and OTCs were analysed using a paired samples t-tests for three different time intervals (24, 12 and 4 h). Differences between shoot growth, leaf life span and berry weight and diameter in OTCs and control plots were assessed by one-way ANOVAs. To test whether OTC warming affected growth parameters across all consecutive years, a one-way ANOVA with repeated measurements was used, with temperature as the between-subject factor and time as within-subject factor. The OTC-effect on timing of the different phenological stages was analysed through chi-square tests of homogeneity with warming treatment and phenological stage as factors. Chi-square tests were essential to explicitly account for the dependences among the proportions of plants attributed to a particular phenological stage. All assessment dates and male and female data were analysed separately. Upon rejection of the overall null hypothesis for a particular chi-square test for homogeneity, a subset chi-square analysis was run to determine which phenological stage contributed most to the observed significant effect of warming treatment. Subset analysis was based on the progressive deletion of the stage-treatment combination with the highest contribution to the calculated chi-square value. Statistical data analysis was performed in SPSS 16.0.
3. Results
3.1. Temperatures
OTC placement significantly increased the mean annual and mean summer temperature at Bergen aan Zee (p < 0.001) and the mean summer temperature at Endalen (p < 0.004; table 1). Between 1961 and 1990 ambient average summer temperature has increased with 0.8 °C in the Netherlands. Here, placement of OTCs led to an increase in average summer temperature by 2.0 °C. At Svalbard, ambient average summer temperature has increased with 0.3 °C between 1961 and 1990. Here, temperatures were on average 1.7 °C higher in OTCs than in control plots. Mean annual values of both GDD5 (p < 0.001) and GSL5 (p < 0.001), in the Netherlands, as well as GDD1 (p < 0.001) GDD5 (p < 0.001), GSL1 (p = 0.008) and GSL5 (p < 0.001) at Svalbard have significantly increased since 1981 (table 1). The warming effect of OTCs for both north and south is shown in figure 1.
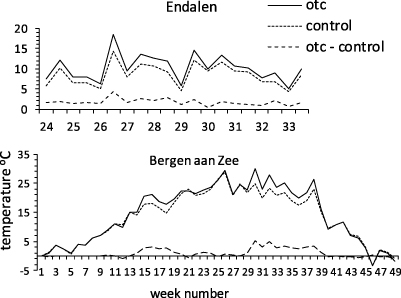
Figure 1. Average air temperature inside open top chambers (OTCs) and control plots south (Bergen aan Zee) and north (Endalen) for the year 2009. Average temperature values of 12 h (daytime: 06.00–18.00 h) intervals. The temperature difference between OTCs and control sites is at the bottom of the graph. Average temperature data of 2005–10 (south) and of 2008–10 (north) have been summarized in table 1.
Download figure:
Standard image3.2. Plant responses at the southern range margin
OTCs resulted in an increase of the vegetative growing season length (GSLp) of Empetrum by 75 days, starting 21 March and ending 5 September. The vegetative growing season length (GSLp) of Calluna increased by 98 days after OTC placement (table 2: 1, 2). Also the annual mean shoot growth of both Empetrum (p = 0.001) and Calluna (p = 0.001) enhanced significantly, while daily growth rate of Empetrum increased by 1.25 mm day−1 and of Calluna by 1.96 mm day−1 (p < 0.001). The flowering season length of Empetrum with ambient temperatures (137 days) decreased by 15 days, while phenology was affected in OTCs as follows (table 2: 8–12): initial bud burst (P1) was advanced (5–8 days; p = 0.004), and full development of anthers (P5) advanced (14–20 days; p = 0.005). Full development of ripe black berries (P5, P6) advanced (15–20 days; p = 0.004) too. In addition, berries achieved higher weight (p < 0.001) and larger diameter (p < 0.001; table 2: 13, 14). In OTCs, biomass had significantly increased both for Calluna (p = 0.009) and Empetrum (p < 0.001) and plant cover of Calluna significantly increased (p < 0.001), but not for Empetrum (p = 0.139; table 2: 15–18). Mean plant height of both species increased significantly in OTCs (p < 0.001 table 2: 19, 20). After five seasons in OTCs (2009), LLS of Empetrum had decreased approximately by two months (p < 0.001) and in the sixth season (2010) LLS had decreased up to 4 months (p < 0.001; table 2).
Table 2. Phenological and growth responses (mean values) of Empetrum nigrum, including shoot growth, biomass, area covered and plant height of co-occurring Calluna vulgaris and Cassiope tetragona to experimental warming with OTCs at its southern (Atlantic) and northern (High Arctic) geographic range margin. ∗ = significant at 0.05; ns = not significant. R = expected response direction: + response according to expectation; − response opposite to expectation; 0 no significant response.
| 52°: southern margin | 78°: northern margin | ||||||||||
|---|---|---|---|---|---|---|---|---|---|---|---|
| Parameter | Control | OTC | Change | % | R | Parameter | Control | OTC | Change | % | R |
| 1. Length of vegetative growing season (GSLp) of Empetrum (date; days) | 11/4–15/7; 91 | 21/3–5/9; 161 | + 75∗ | 82 | − | 1. Vegetative growing season length (GSLp) Empetrum (date; days) | 1/6–25/8; 70 | 1/6–25/8; 70 | 0 ns | 0 | 0 |
| 2. Length of vegetative growing season (GSLp) of Calluna (date; days) | 25/4–11/7; 78 | 4/4–29/9; 176 | + 98∗ | 126 | + | 2. Growing season length (GSLp) Cassiope (days) | 70 | 70 | 0 ns | 0 | 0 |
| 3. Annual shoot length growth (mm) Empetrum | 30 | 84 | + 54∗ | 180 | − | 3. Annual shoot length growth (mm) Empetrum | 16.1 | 23.3 | + 7.2∗ | 45 | + |
| 4. Annual shoot length growth (mm) Calluna | 56 | 96 | + 40∗ | 71 | + | 4. Annual shoot length growth (mm) Cassiope | 7.4 | 10.1 | + 2.7∗ | 36 | + |
| 5. Shoot growth rate (mm day−1) Empetrum | 0.4 | 1.25 | + 0.85∗ | 212 | − | 5. Shoot growth rate (mm day−1) Empetrum | 0.28 | 0.42 | + 0.14∗ | 50 | + |
| 6. Shoot growth rate (mm day−1) Calluna | 0.9 | 1.96 | + 1.06∗ | 118 | + | 6. Shoot growth rate (mm day−1) Cassiope | 0.13 | 0.18 | 0.05∗ | 38 | + |
| 7. Flowering season length Empetrum (date/days + / − ) | 16/2–30/6; 137 | 11/2–10/6; 122 | − 15∗ | − 11 | + | 7. Flowering season length Empetrum date/days advance | 31/5–12/7; 43 | 31/5–12/7; 43 | 0 ns | 0 | 0 |
| 8. Phenology: bud burst date/days advance (P1–P2) | 16–21/2 | 11–14/2 | − 5–8∗ | + | 8. Phenology: bud burst date/days advance (P1–P2) | 31/5–2/6 | 31/5–2/6 | 0 ns | 0 | ||
| 9. Phenology: fully developed anthers; date/days advance (P5) | 27–29/3 | 8–15/3 | − 14–20∗ | + | 9. Phenology: fully developed anthers; date/days advance (P5) | 21–30/6 | 18–27/6 | 3 ns | 0 | ||
| 10. Phenology: berries; date/days advance (P2) ø 1–2 mm | 22–29/3 | 15–22/3 | − 7∗ | + | 10. Phenology: berries; date/ days advance (P2) ø 1–2 mm | 6–16/6 | 6–16/6 | 0 ns | 0 | ||
| 11. Phenology: berries colouring black; date/days advance (P5) ø 4–6 mm | 24–4/2–5 | 4–12/4 | − 20∗ | + | 11. Phenology: berries colouring black; date/days advance (P5) ø 4–6 mm | 21–30/6 | 18–27/6 | 3 ns | 0 | ||
| 12. Phenology: berries black; date/days advance (P6) ø 5–10 mm | 3–30/6 | 15/5–15/6 | − 20∗ | + | 12. Phenology: berries black; date/days advance (P6) ø 5–10 mm | 27/6–12/7 | 27/6–12/7 | 0 ns | 0 | ||
| 13. Berry size (ø mm) | 6.8 | 8.2 | + 1.4∗ | 21 | − | 13. Berry size (ø mm) | 6.0 | 7.3 | + 1.3∗ | 22 | + |
| 14. Berry weight (mg) | 164 | 287 | + 123∗ | 75 | − | 14. Berry weight (mg) | 108 | 181 | + 73∗ | 68 | + |
| 15. Total biomass 2005–2010 (mg) Empetrum | 904 | 1909 | + 1005∗ | 111 | − | 15. Biomass of branches 2008–2010 (mg) Empetrum | 48.2 | 64.2 | + 16.0∗ | 33 | + |
| 16. Total biomass 2005–2010 (mg) Calluna | 2067 | 2321 | + 254∗ | 12 | + | 16. Biomass of branches 2008–2010 (mg) Cassiope | 28.4 | 43 | + 14.6∗ | 51 | + |
| 17. Area covered (m2) Empetrum | 2.13 | 1.75 | − 0.38 ns | − 18 | + | 17. Area covered (m2) Empetrum | 1.5 | 1.5 | 0 | 0 | 0 |
| 18. Area covered (m2) Calluna | 0.72 | 1.60 | + 0.88∗ | 122 | + | 18. Area covered (m2) Cassiope | 0.5 | 0.5 | 0 | 0 | 0 |
| 19. Plant height (cm) Empetrum | 22 | 38 | + 16∗ | 73 | − | 19. Plant height (cm) Empetrum | 5 | 5 | 0 | 0 | 0 |
| 20. Plant height (cm) Calluna | 34 | 56 | + 22∗ | 65 | + | 20. Plant height (cm) Cassiope | 5 | 5 | 0 | 0 | 0 |
| 21. Leaf Life Span (year) Empetrum | 1.6 | 1.3 | + 0.3∗ | − 19 | + | 21. Leaf Life Span (year) Empetrum | 2.5 | 2.5 | 0 ns | 0 | 0 |
3.3. Plant responses at the northern range margin
GSLp of Empetrum lasted from 1 June until 25 August and was similar for both OTCs and control plots (table 2: 1). Usually snow does not melt before the end of May or the beginning of June, and low temperatures occur at the end of August and/or the beginning of September (1.4 °C average September temperature; 1991–2010; DNMI 2011). Tundra soil in Endalen is frozen and snow covered from September until the end of May (DNMI 2011). Ecologically, this implies that extension of GSL through warming by OTCs is limited to some days only due to the prolonged presence of snow (table 1). In OTCs, annual mean shoot growth of Empetrum (p < 0.005) and of co-occurring Cassiope significantly increased (p < 0.001). No change in LLS (p = 0.898) was observed after three seasons of experimental warming (2008–10; table 2: 21). In OTCs, the phenological stages (P1–P6) showed no advance (table 2: 8–12). However, in June 2011, immediately after snowmelt, we found many more berries (formed in 2010) in OTCs than in control plots. Also, by the end of August 2011, berries inside OTCs were all in stage P6 and were coloured black. These berries had also achieved higher weights (p < 0.001) and larger diameters (p < 0.001; table 2: 13, 14) than berries from control plots. Mean annual shoot length growth under ambient temperatures of Empetrum in monospecific stands (23.2 mm) showed no significant difference (p = 0.840) compared to mixed stands (24.8 mm) with Cassiope, while mean annual shoot length growth of Cassiope was significantly lower (p = 0.03) in mixed stands (13 mm) compared to monospecific stands (18.1 mm).
In table 2, column 'R' summarizes if the results are according to or opposite to the expected response direction. At the southern margin, responses 1, 3, 5, 13–15 and 19 of Empetrum are opposite to the expected response direction, while the responses 2, 4, 6–12, 16–18 and 20–21 are according to the expected response direction. Almost all responses were significant. In contrast, at the northern margin, most responses were insignificant. Those responses that were significant (i.e. responses 3–6 and 13–16) were all according to expectations.
4. Discussion
4.1. Temperature enhancement
At both range margins, the open top chambers (OTCs), significantly increased temperatures (table 1), but they may have had additional effects on soil moisture, relative humidity, photosynthetic active radiation and may have had other microclimatological impacts, possibly influencing biological and ecological responses. Bokhorst et al (2011b) discusses intended as well as unintended climatological changes in OTCs relative to control plots. With reduced windspeed, temperature beneath the OTCs panels may strongly increase while soil temperature and relative humidity may decrease. In our setup, we assume these impacts to be limited since we used wide (2.20 m diameter) OTCs and monitored and sampled only the central parts of 50 cm × 50 cm in the OTCs. In the Antarctic OTCs delay soil thaw by 3–13 days and experience extreme temperatures, potentially exceeding the physiological threshold of tolerance of species in summer (Bokhorst et al 2011b). Also, warming outside the main growing season can have strong negative impacts on Empetrum in the sub-Arctic (Bokhorst et al 2011a). In our experiments at the southern margin, OTCs did not experience temperatures exceeding 25 °C longer than for 4 h during summer and never exceeding an increase of 4 °C or higher compared to ambient temperature. Frozen soil only occurred once during 2005–10 for two weeks, winter 2011. Likewise, at the northern margin, summer temperature rarely exceeded 20 °C. In the 'south' and 'north', neither warming outside the main growing season nor any damage to the vegetation in OTC and controls has been observed. Of course we cannot rule out that the ecological responses we obtained with the OTC treatment are not due to warming impacts only, but for logistic reasons, it was not feasible to study the potential impacts of these artefacts in the current study. However, based on the above, we assume these artefacts to be limited.
4.2. Ecological responses to OTC warming at the southern margin
OTCs significantly decreased LLS (table 2: 21), according to the expected response direction. This supports the hypothesis that leaf longevity tends to decrease with warmer climates with reduced time needed to develop new leaves (Aerts 1995, Chabot and Hicks 1982, Karlsson 1992, Suzuki and Kudo 2000). OTCs also significantly advanced the onset and completion of the phenological stages P1–P6 of Empetrum by 5–20 days (table 2: 8–12) and thereby facilitated an earlier onset of vegetative growth, since the latter starts only after the end of flowering. The observed advanced onset and termination of flowering (table 2: 7) confirms our hypothesis, reflecting the cool boreal-Arctic distribution range of Empetrum and is also consistent with other plant responses to climate warming in the Northern Hemisphere (Ahas et al 2002, Arft et al 1999, Fitter and Fitter 2002, Menzel et al 2006, Schwartz et al 2006). This is consistent with advanced flowering season of Empetrum from April to May towards February to March (Van der Meijden 2005) under influence of ambient temperature increase in the Netherlands during the last few decades (EPG 2011; table 1).
In addition to the earlier onset, we also expected earlier termination of the vegetative growing season, but we found the opposite, i.e. a delayed end of the growing season (table 2: 1). Most of the direct ecological responses (annual shoot growth, shoot growth rate, berry weight and berry diameter, biomass; table 2: 3, 5, 13–15) showed a consistent and significant increase, opposite to our expectations of response direction. These results do neither support the susceptibility (expecting reduced growth and reproduction) of Empetrum to global warming (Fosaa et al 2004, Harrison et al 2006, Trivedi et al 2008, Neilson et al 2005) nor the northward retreat of Empetrum in Britain that has been attributed to increasing winter temperatures (Bell and Tallis 1973). It is thus not possible to explain northward retreats of Empetrum by these direct ecological mechanisms.
In addition to direct effects of warming, we also hypothesized that an indirect competitive effect of co-occurring Calluna could possibly be related to the northward shift of Empetrum at its southern range margin. The direct ecological responses of Calluna (table 2: 4, 6, 16, 18, 20) with an Atlantic-continental distribution range are indeed according to our expectations. Also the reduced ground area covered by Empetrum (table 2: 17) is according to our expected response direction. However, annual shoot growth, growth rate and biomass of Empetrum (table 2: 3, 5, 15) in response to increased temperatures in OTCs (table 1) exceed that of Calluna. Therefore there is no evidence of increased competitiveness of Calluna relative to Empetrum with OTC increased temperature. In summary, neither direct nor indirect ecological responses of Empetrum (and neighbouring Calluna) provide conclusive evidence explaining the northward retreat of Empetrum at its southern range margin in the Netherlands.
4.3. Ecological responses to OTC warming at the northern margin
OTCs significantly enhanced temperatures during the Arctic summer (table 1). However, neither GSLp nor any of the flowering phenological stages (table 2: 1, 8–12) altered. Yet, in OTCs, massive ripening of berries with significantly increased diameter and weight compared to control plots was found (table 2: 13, 14). Small temperature differences, not captured by GSL, may influence biological processes (Körner and Basler 2010, EPG 2011, Suzuki and Kudo 1997) and may cause differences in phenology and extension of the growing season (Parmesan 2006, Suzuki and Kudo 1997). Instead, meteorologically obtained GDD-increases (using a 5 °C threshold) with global warming have been related to advanced timing and increased length of the growing season (Førland et al 2004, Linderholm 2006). A GDD, with a 1 °C threshold may even be more relevant for tundra plant species than a meteorological defined GDD, since many early spring flowering Alpine and Arctic species have a low temperature threshold (Körner 1999). Indeed, at the northern margin, the ambient mean annual GDD1 significantly increased (p < 0.001) since 1981 (table 1). Therefore, the significant increase of direct ecological responses (table 2: 3, 5, 13–15) of Empetrum to the OTC treatment may be attributed to the increased GDD value, representing accumulated heat, despite the irresponsiveness of the growing season length.
In addition to the phenological responses, also the direct ecological responses, i.e. annual shoot growth, shoot growth rate and biomass (table 2: 3, 5, 15), were according to our expected response direction, based on the boreal-Arctic geographical range of Empetrum. Our findings do support increased shoot length reported from the Finnish sub-Arctic (Shevtsova et al 1997) and Alpine vegetation in Japan (Kudo and Suzuki 2003, Suzuki and Kudo 1997, 2000, Wada et al 2002) and increased berry diameter and weight (Suzuki and Kudo 1997). LLS of Empetrum did not change upon warming. However, consistent with expectations, LLS at the northern margin (2.5 years; table 2: 21) was much higher than in the temperate south (1.6 years), representing the increased time needed to develop new leaves at the northern margin. Since experimental warming at the northern margin only lasted for three years until now, LLS may not have changed yet, but may do with prolonged duration of the OTC treatment. If so, then we expect LLS to reduce with OTC warming, as we found at the southern margin. Altogether, at the northern margin, growth and reproduction increased while phenology of Empetrum remained unaltered, thereby supporting increased occurrences of Empetrum on Svalbard.
We had also hypothesized that, in addition to direct ecological responses to OTC warming, an indirect competitive advantage relative to co-occurring Cassiope may facilitate the expansion of Empetrum at its northern range margin. Indeed, OTC warming caused increased shoot length and growth rate of Empetrum, exceeding that of Cassiope (table 2: 4, 6). Also, outside the OTCs, annual shoot growth of Empetrum did not differ in monospecific and mixed stands while the annual shoot growth of Cassiope was significantly reduced in mixed stands with Empetrum. This may indicate increased competitiveness of Empetrum relative to Cassiope at the northern margin, as was found previously for increased competitiveness of E. nigrum spp. japonicum relative to the Arctic and sub-Arctic Loiseleura procumbens (Wada et al 2002). However, despite the enhanced growth rates inside the OTCs, it is Cassiope which showed a larger increase in biomass compared to Empetrum (table 2: 15, 16), opposite to the expected response direction. There is thus no conclusive evidence for increased competitiveness of Empetrum relative to co-occurring Cassiope with OTC warming. More and continued research on seed dispersal, germination and establishment in response to global warming is thus needed to unravel range expansion of Empetrum in the high Arctic (Graae et al 2008). A longer research period could provide a more robust picture as shown by Chapin et al (1995) studying Arctic tundra vegetation during nine years.
4.4. Conclusions
In conclusion, this study sought to understand the ecological mechanisms involved with the northward retreat of Empetrum at its southern range margin and increased occurrences at high Arctic Svalbard, as attributed to current global warming. By analysing various growth and phenological responses to OTC warming at its range margins, we obtained partial evidence for an ecological explanation of range shifts of Empetrum. Contrary to our expected response direction, Empetrum growth and biomass parameters increased with OTC warming at the southern margin, leaving its observed northward retreat unexplained. Neither have we found an indication of increased competitiveness of neighbouring Calluna vulgaris relative to Empetrum in response to OTC warming. This leaves the question if warming is causing the contraction of the southern range margin of boreal-(sub) Arctic Empetrum unanswered.
Increased occurrences on Svalbard may be explained by direct ecological responses of shoot and biomass growth, as well as berry production and size, while no conclusive evidence was found of increased competitiveness of Empetrum relative to co-occurring Cassiope upon warming.
Acknowledgments
We greatly acknowledge Drs Rienk Slings, ir Hubert Kivit, Egbert van Diepen and Luuk Knijnsberg (nv PWN–North Holland Dune Nature Reserve, the Netherlands) for facilitating the fieldwork since 2005. We are indebted to Sysselmannen på Svalbard for permission to install plots at Endalen. The research of Stef Weijers presented forms part of the project 851.40.051 'long-lived evergreen shrubs from polar ecosystems as monitors of present and past climate change', funded by IPY-NWO. The research of Jelte Rozema was funded by NWO-ALW-NPP project NAP 'tundra plants' project 851.30.013. We acknowledge MSc student Jerome Drvosnek for his valuable contribution to the growth measurements and flowering phenology. We also greatly acknowledge the guest editor and two anonymous reviewers for their comments which helped to improve the paper.
Footnotes
- 4
World Meteorological Organisation: www.wmo.int.