
Abstract
Green roofs can be an attractive strategy for adding perviousness in dense urban environments where rooftops are a high fraction of the impervious land area. As a result, green roofs are being increasingly implemented as part of urban stormwater management plans in cities around the world. In this study, three full-scale green roofs in New York City (NYC) were monitored, representing the three extensive green roof types most commonly constructed: (1) a vegetated mat system installed on a Columbia University residential building, referred to as W118; (2) a built-in-place system installed on the United States Postal Service (USPS) Morgan general mail facility; and (3) a modular tray system installed on the ConEdison (ConEd) Learning Center. Continuous rainfall and runoff data were collected from each green roof between June 2011 and June 2012, resulting in 243 storm events suitable for analysis ranging from 0.25 to 180 mm in depth. Over the monitoring period the W118, USPS, and ConEd roofs retained 36%, 47%, and 61% of the total rainfall respectively. Rainfall attenuation of individual storm events ranged from 3 to 100% for W118, 9 to 100% for USPS, and 20 to 100% for ConEd, where, generally, as total rainfall increased the per cent of rainfall attenuation decreased. Seasonal retention behavior also displayed event size dependence. For events of 10–40 mm rainfall depth, median retention was highest in the summer and lowest in the winter, whereas median retention for events of 0–10 mm and 40 +mm rainfall depth did not conform to this expectation. Given the significant influence of event size on attenuation, the total per cent retention during a given monitoring period might not be indicative of annual rooftop retention if the distribution of observed event sizes varies from characteristic annual rainfall. To account for this, the 12 months of monitoring data were used to develop a characteristic runoff equation (CRE), relating runoff depth and event size, for each green roof. When applied to Central Park, NYC precipitation records from 1971 to 2010, the CRE models estimated total rainfall retention over the 40 year period to be 45%, 53%, and 58% for the W118, USPS, and ConEd green roofs respectively. Differences between the observed and modeled rainfall retention for W118 and USPS were primarily due to an abnormally high frequency of large events, 50 mm of rainfall or more, during the monitoring period compared to historic precipitation patterns. The multi-year retention rates are a more reliable estimate of annual rainfall capture and highlight the importance of long-term evaluations when reporting green roof performance.
Export citation and abstract BibTeX RIS

Content from this work may be used under the terms of the Creative Commons Attribution 3.0 licence. Any further distribution of this work must maintain attribution to the author(s) and the title of the work, journal citation and DOI.
1. Introduction
Stormwater runoff has become a major environmental issue for many dense urban areas in North America due to its contribution to flooding and pollution of nearby surface waters. In cities that utilize combined sewer systems (CSSs) to manage both stormwater and sewage, these problems are compounded because even relatively small rainfall events, as little as 3 mm in 1 h (Montalto et al 2007), can trigger combined sewer overflows (CSOs). CSO events release sediments, nutrients, gasoline and other chemicals from urban surfaces into local waterways, as well as pathogens and organic matter from human waste. This pollution undermines the productivity of urban water bodies by impairing local residents' ability to swim, fish, and conduct other water-based recreational and commercial activities.
In the United States (US), CSOs are reported to impact 746 communities in 32 states and cause 850 billion gallons of pollution each year (US EPA 2004). In New York City (NYC) alone, 433 outfalls release over 20 billion gallons of CSO per year (Mayor's Office of Long-Term Planning and Sustainability 2008). In accordance with the Clean Water Act of 1972, NYC has adopted a stormwater management plan aimed toward reducing runoff volume and peak flow rates to help mitigate local CSO pollution. In NYC's latest plan, an increased effort is being made to implement decentralized, low-impact development techniques, also called 'green' stormwater infrastructure, as an alternative to traditional methods such as underground detention basins. A major goal of NYC's plan is to capture ten per cent of the first 25 mm of runoff from the impervious surfaces in every NYC sewershed using green strategies, which includes the use of vegetated rooftops (NYC DEP 2010).
Vegetated rooftops, known as green roofs, eco-roofs, or living roofs, have become an increasingly popular alternative to impervious roof types. A typical green roof is constructed by placing a drainage course, growing substrate, and vegetation on top of a roof's waterproof membrane. In some installations, green roofs may also have additional geosynthetic layers for preventing plant root penetration damage, limiting sediment intrusion into the drainage course, and/or water storage. At present, the US does not have national green roof standards and, as a result, the materials, configuration, and installation methods for green roofs can vary widely from site to site.
It is common for green roofs to be classified as either extensive or intensive based on the thickness of the growing substrate layer. Extensive roof substrates are typically 15 cm thick or less and feature short rooting, drought resistant plants, whereas intensive roof substrates are greater than 15 cm thick and may be sowed with deeper rooting plants including shrubs and trees. Generally, extensive green roofs are cheaper, require less maintenance and are lighter than intensive systems. Therefore, extensive systems are implemented more frequently than intensive systems, most especially on existing building stock where rooftop weight limitations come into play. Due to their wider applicability, extensive green roofs are the focus of this study.
Within the extensive green roof classification three major construction types have emerged: vegetated mat, built-in-place, and modular tray systems (Oberndorfer et al 2007). Typically, both the vegetated mat and built-in-place systems require a specialized drainage course to prevent ponding and surface flow that would otherwise cause substrate erosion. The two systems differ, however, in how the substrate is installed. In mat construction the growing substrate is bound within a geo-composite used for off-site pre-planting, whereas the growing substrate for a built-in-place system is placed within bordered rooftop regions and landscaped on site. In contrast, the walls of the modular trays already restrict surface runoff, while the base provides corrugated air space for drainage, therefore these systems may be placed directly on a roof's waterproof membrane. Each construction type imposes a unique set of boundary conditions on the growing substrate layer that affects the drainage behavior of runoff. For example, the mat and built-in-place systems promote lateral runoff movement to varying degrees, whereas the unconnected modular trays generally facilitate vertical percolation. The type of construction may also determine the non-vegetated area required for maintenance and the feasibility of different vegetation types. As a result, the installation method might be a significant factor in overall green roof performance.
While green roofs have been shown to provide a range of environmental benefits compared to typical impervious roofs (Berndtsson et al 2009, Getter et al 2009, Sailor and Hagos 2011, Yang et al 2008), their ability to attenuate stormwater runoff is typically the main target of existing incentive programs for their construction. Recently, a number of studies have helped to better understand the role green roofs might play in mitigating CSO pollution and minimizing problems associated with urban runoff in general (Berndtsson 2010). These studies report a wide range of hydrologic behavior due to differences in, among other parameters, green roof construction type, growing substrate depth, vegetation type, and areal coverage. Even similar systems may have significant performance variation since the water retention ability of green roofs is heavily influenced by local climate; where the distribution, size, and intensity of rainfall events (Stovin 2010), as well as seasonal evapotranspiration rates (Bengtsson et al 2005), are thought to play a key role. The role of local climate in green roof water retention ability is important for two reasons: first, since green roof hydrologic performance is impacted by regional conditions, green roof studies are needed across a range of climate zones to fully understand the feasibility of using this technology in an effective stormwater management strategy. Second, the period in which green roof monitoring studies are conducted impacts the reported overall green roof performance. For instance, a study during a period in which large storms were prevalent will result in lower reported green roof rainfall retention rates than a study during which smaller storms were recorded. Consequently, there is a need to develop methods for estimating green roof retention rates over multiple years or rainfall patterns to reduce any bias caused by rainfall distribution within the monitoring period itself.
In the following sections hydrological monitoring data from three full-scale, extensive green roofs in NYC, one of each major construction category, are reported with the intent of: (1) filling a gap in knowledge of the stormwater retention performance of full-scale green roofs in NYC's climate region; (2) providing a comparative analysis of the performance of the vegetated mat, built-in-place and modular tray roof systems; and (3) presenting a method for estimating green roof retention performance that can account for variations in rainfall distribution patterns not experienced during rooftop monitoring periods.
2. Summary of previous green roof hydrologic monitoring studies
To date, the potential for reduction of runoff volume is the most cited hydrologic performance metric of green roofs. Generally, volume reduction is reported as the per cent of total rainfall captured during a given study period and is usually obtained using a mass balance approach by comparing continuous rainfall and runoff data. Pilot scale studies indicate that rainfall retention between 30 and 86% is possible for extensive systems (Berghage et al 2009, DeCuyper et al 2004, VanWoert et al 2005, Getter et al 2007, DiGiovanni et al 2010, Morgan et al 2012, Nardini et al 2011, Schroll et al 2011, Stovin et al 2012). These studies show that green roof retention increases with: thicker growing substrate depths (DeCuyper et al 2004, VanWoert et al 2005), lower roof slopes (Getter et al 2007, VanWoert et al 2005), and higher evapotranspiration rates (DiGiovanni et al 2010). Evapotranspiration rates were found to increase due to a variety of factors, including: greater areal plant coverage (Berghage et al 2009, Morgan et al 2012), higher transpiring plants (Nardini et al 2011), and warmer weather (Schroll et al 2011). In addition, Mentens et al (2003) used 32 lysimeter test boxes at 20° and 40° slopes to determine the impact of green roof orientation on evapotranspiration. The results indicate that, in the Northern Hemisphere, south facing sloped roofs have the highest evapotranspiration rates among the four orientations, while north facing have the lowest rates (Mentens et al 2003). Finally, Villarreal (2007) demonstrated that rainfall retention is also a function of precipitation characteristics, such as intensity and duration. For example, rainfall retention from a 1.5 m2 extensive green roof test box was lowest when exposed to constant rainfall intensity (20–29%), and higher for variable intensity (34–52%) (Villarreal 2007).
All studies referenced in the above paragraph were conducted on a pilot scale, using elevated test boxes or similar modules, with watershed areas between 0.37 and 12 m2. While these studies, and many others at the pilot scale, have been instrumental in helping to identify and quantify relationships associated with runoff reduction, it is uncertain how accurately they forecast full-scale performance. Typically, the main difference between pilot and full-scale testing is the inclusion of non-vegetated regions in the latter case, which are generally required on most full-scale green roof installations for egress, maintenance, rooftop equipment, or to manage load restrictions. These regions, along with larger drainage watersheds in general (e.g. 300 m2 or more in this study), significantly alter the behavior of runoff and, consequently, green roof stormwater volume retention capability.
Hydrologic studies on full-scale green roof systems, those conducted on an entire watershed or partitioned sections of an occupiable building's rooftop, are summarized in table 1. The range of rainfall retention in these studies is 12–74%, generally lower than those reported in pilot tests. This is likely due to non-vegetated sections and irrigation requirements for many full-scale systems. For instance, in Spolek (2008) the monitored green roofs were irrigated during the summer months, significantly reducing retention capability. With the exception of Gregoire and Clausen (2011), which evaluated a modular tray green roof, all other studies in table 1 were conducted on built-in-place systems; highlighting the need for additional research using different construction types. Further, full-scale studies with monitored drainage areas of 300 m2 or more, as presented in this study, are limited. The literature summary provided in table 1 does not include studies reported in the German language, for which the authors were unable to identify key parameters specified in table 1. For a detailed review of studies reported in German see Mentens et al (2006).
Table 1. Summary of studies on the hydrologic performance of full-scale green roofs. Columns from left to right identify the author(s) and year of publication, geographic location, dated range of data collection, size of monitored (M.) drainage area, number of individual events observed, depth of the growing substrate, and reported per cent of rainfall captured during the monitoring period for each study. 'N' is used for fields where information was unavailable.
| Publication | Study location | Study period | M. drainage area (m2) | # Events reported | Substrate depth (mm) | Overall retention (%) |
|---|---|---|---|---|---|---|
| Berghage et al (2010) | Chicago, IL | 8/07–7/09 | 7000 | 106 | 76 | 74.0 |
| Berkompas et al (2008) | Seattle, WA | 2/07–12/07 | 743 | N | 150 | 30.5 |
| Seattle, WA | 4/07–6/07 | 1860 | N | 100–125 | 33.0 | |
| Seattle, WA | 10/07–12/07 | 80 | 9 | 150 | 17.1 | |
| Bliss et al (2009) | Pittsburg, PA | 8/06–1/07 | 330 | 13 | 140 | 21.8 |
| Connelly et al (2006) | Vancouver, Canada | 1/05–12/05 | 33 | N | 75 | 29.0 |
| Vancouver, Canada | 1/05–12/05 | 33 | N | 150 | 26.0 | |
| Gregoire and Clausen (2011) | Storrs, CT | 12/09–2/10 | 307 | N | 102 | 51.4 |
| Hathaway et al (2008) | Goldsboro, NC | 4/03–6/04 | 35 | N | 75 | 64.0 |
| Kinston, NC | 4/03–6/04 | 27 | N | 100 | 64.0 | |
| Hutchinson et al (2003) | Portland, OR | 1/02–4/03 | 240 | N | 100–125 | 69.0 |
| Kurtz (2008) | Portland, OR | 5/02–6/08 | 246 | N | 125 | 56.0 |
| Portland, OR | 3/07–6/08 | 465 | N | 75 | 64.0 | |
| Liu and Minor (2005) | Toronto, Canada | 3/03–11/04 | 200 | N | 75 | 57.0 |
| Toronto, Canada | 3/03–11/04 | 200 | N | 100 | 57.0 | |
| Moran et al (2005) | Goldsboro, NC | 4/03–9/04 | 35 | 67 | 75 | 63.0 |
| Raleigh, NC | 7/04–9/04 | 65 | 13 | 100 | 55.0 | |
| Palla et al (2011) | Genova, Italy | 5/07–6/08 | 170 | 19 | 200 | 51.8 |
| Genova, Italy | 9/08–12/08 | 170 | 10 | 200 | 14.9 | |
| Spolek (2008) | Portland, OR | 10/04–4/07 | 290 | N | 100–150 | 12.0 |
| Portland, OR | 10/04–4/07 | 280 | N | 100–150 | 17.0 | |
| Portland, OR | 1/05–10/07 | 500 | N | 150 | 25.0 | |
| Teemusk and Mander (2007) | Tartu, Estonia | 8/04–9/04 | 120 | 3 | 100 | 19.6 |
| TRCA (2006) | Toronto, Canada | 5/03–8/04 | 240 | 163 | 140 | 65.3 |
| Voyde et al (2010) | Auckland, NZ | 10/08–10/09 | 41 | 91 | 50 | 66.0 |
| Auckland, NZ | 10/08–10/09 | 13 | 91 | 50 | 66.0 | |
| Auckland, NZ | 10/08–10/09 | 46 | 91 | 70 | 66.0 | |
| Auckland, NZ | 10/08–10/09 | 45 | 91 | 70 | 66.0 | |
| Auckland, NZ | 10/08–10/09 | 12 | 91 | 70 | 66.0 | |
| Auckland, NZ | 10/08–10/09 | 38 | 91 | 50 | 66.0 |
For full-scale studies, it is common to report overall retention during the study period, along with several green roof characteristics including: vegetation type, areal vegetation coverage, monitored drainage area, average slope, installation type and growing substrate properties such as depth, maximum water holding capacity and saturated hydraulic conductivity. However, other important factors that influence rainfall retention are often not reported. For example, a number of studies do not indicate the total number of rainfall events as well as the seasonal and size distribution of those events, which have been shown to be influential on rainfall retention (Stovin et al 2012). Further, even fewer studies attempt to compare the rainfall distribution during the study period to historic patterns to check for abnormalities during the monitoring period. Given the significance of rainfall characteristics on runoff retention, this has made it difficult to compare studies, even those in similar climates, in order to evaluate the influence of the other reported green roof properties. As a result, there is a need for a method to account for rainfall distribution. In this paper, one such method that uses widely available precipitation data is presented.
3. Monitoring sites and systems
3.1. Site descriptions
A summary of information for the three green roofs that are part of this study is presented in table 2. The 423 West 118th Street building (W118) is a graduate student residence on Columbia University's Morningside campus. In 2007 a vegetated mat green roof, Xero Flor America's XF301 + 2FL system, was installed on this building, figures 1(a) and (d). This system includes a 32 mm thick pre-planted substrate mat that is underlain by two 6 mm thick water retention fleeces made of recycled synthetic fibers, a 19 mm non-woven polymer drainage mat, and a 0.5 mm polyethylene root barrier. The growing substrate on the W118 green roof has a water-saturated density of 1.37 g cm−3, water storage capacity of 37.1%, and a saturated hydraulic conductivity of 0.021 cm s−1, as reported by Hummel and Co., Inc. in April 2007. The total W118 roof area is approximately 600 m2 and has two drainage areas, both of which drain to exterior parapet downspouts. Monitoring was conducted on the 310 m2 South-East drainage area, where 53% of the surface is covered by the mat system. The non-vegetated areas are gravel ballast walkways, sloped parapet walls, and a raised rooftop above the building's elevator shaft. Vegetation at this site is exclusively sedum species including: Saxifraga granulata, Sedum acre, Sedum album, Sedum ellacombianum, Sedum hybridum 'Czars Gold', Sedum oregonum, Sedum pulchellum, Sedum reflexum, Sedum sexangulare, Sedum spurium var. coccineum, and Sedum stenopetalum.
Table 2. Site characterization information for the three full-scale green roofs being monitored in NYC.
| Abbreviated name | W118 | USPS | ConEd |
|---|---|---|---|
| Construction type | Vegetated mat | Built-in-place | Modular tray |
| Manufacturer | Xero Flor America | Tecta Green | GreenGrid Roofs |
| Year built | 2007 | 2009 | 2008 |
| Substrate depth (mm) | 32 | 100 (200 in select locations) | 100 |
| Potential substrate storage depth (mm)a | 12 | 35–65 | 32 |
| Vegetation type | Sedum mix | Sedum mix & natives | Sedum mix |
| Drainage type | Geo-composite drainage course | Geo-composite drainage course | Corrugated air space |
| Monitored drainage area (m2) | 310 | 390 | 940 |
| Per cent of drainage area vegetated (%) | 53 | 67 | 52 |
aPotential rainfall storage depth of the substrate was calculated as the total substrate depth multiplied by the reported maximum per cent of water holding capacity. The potential storage depth listed here, derived from laboratory test information, is likely different than in situ substrate storage depth, for reasons discussed in Fassman and Simcock (2012) and section 5.1, but is identified for general comparisons.
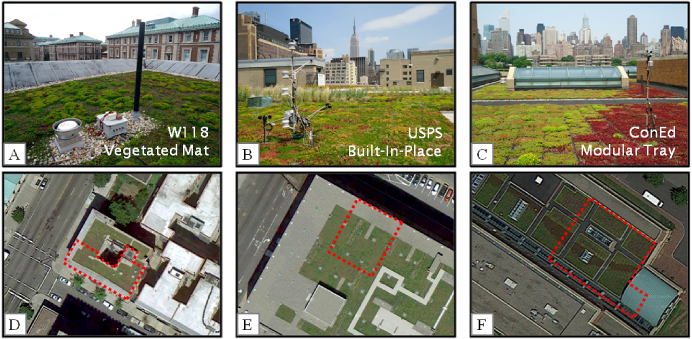
Figure 1. (a)–(c) Rooftop view of the W118, USPS, and ConEd green roofs, respectively. (d)–(f) Areal view of the W118, USPS, and ConEd green roofs, respectively (scale: 1 cm= 20 m). The monitored drainage area for each roof is indicated by the dotted line. Panels (d) and (f) © Bluesky, DigitalGlobe, Sanborn, USDA Farm Service Agency, Map data © 2013 Google. Panel (e) © Bluesky, DigitalGlobe, Sanborn, Map data © 2013 Google, Sanborn.
Download figure:
Standard image High-resolution imageConstruction of the green roof at the US Post Office's Morgan Processing and Distribution Center, referred to as USPS, was completed in 2009 by Tecta Green, figures 1(b) and (e). At roughly 10 000 m2 the USPS green roof is currently the largest installed green roof in NYC. It was constructed using a built-in-place strategy where borders were set, in this case with 100 mm tall metal brackets, and an expanded shale based growing substrate was added within the bounded region. The growing substrate on the USPS green roof has a water-saturated density between 1.15 and 1.35 g cm−3, water storage capacity between 35 and 65%, and a saturated hydraulic conductivity between 0.001 and 0.120 cm s−1 as reported by Skyland USA LLC in March 2011. For built-in-place systems the growing substrate can be landscaped as desired to create varying soil profiles. At USPS, a majority of the green roof has a growing substrate depth of 100 mm and is planted with sedum species which include: Sedum acre, Sedum album 'Coral Carpet', Sedum album murale, Sedum reflexum, Sedum sexangulare, Sedum reflexum 'Blue Spruce', Sedum grisebachii, Sedum kamtschaticum, Sedum 'Matrona', Sedum pluricaule 'Rosenteppich', Sedum spurium 'Roseum', and Sedum telephium 'Autumn Joy'. However, in select locations there are 200 mm thick berms, usually about 2 m wide of varying lengths, which have been sowed with the following plant species: Achilea filipendula 'Moonshine', Aliumschoenoprasum, Coreopsis vert 'Moonbeam', Silene caroliniana ssp. wherryi, Talinum calycinum, and Tradescantia ohiensis. A 390 m2 drainage area on the North-West corner of the roof was selected for monitoring. This drainage area contains one 2 m × 6 m berm and drains to a single internal downspout. Green roof coverage on the drainage area is 67% and the remaining area is gravel ballast.
The green roof located at the ConEdison Learning Center (ConEd) was built in 2008 using GreenGrid-G2 modular trays (61 cm × 122 cm × 10 cm) provided by GreenGrid Roofs, figures 1(c) and (f). The roof was installed by filling the trays with a proprietary expanded shale based growing substrate and arranging the trays in adjacent rows on the roughly 2700 m2 roof. The growing substrate on the ConEd green roof has a water-saturated density of 1.18 g cm−3, water storage capacity of 31.8%, and a saturated hydraulic conductivity of 0.326 cm s−1 as reported by Penn State University's Agricultural Analytical Services Laboratory in July 2008. Pre-grown plugs and cuttings were planted using 15 varieties of sedum species as follows: Sedum oreganum, Sedum kamtschaticum 'Weihenstephaner Gold', Sedum kamtschaticum, Sedum ternatum, Sedum 'John Creech', Sedum spurium 'Album Superbum', Sedum spurium 'Fulda Glow', Sedum spurium 'Dragons Blood', Sedum spurium 'Bronze Carpet', Sedum angelina, Sedum sexangulare, Sedum 'Ruby Glow', Sedum 'pachyclados', Sedum 'Bertram Anderson', and Sedum 'Vera Jameson'. ConEd's green roof has three drainage areas, of which the 940 m2 Eastern drainage area was monitored for this study. Due to its larger size, the selected drainage area has two internal downspouts, requiring both to be outfitted with monitoring devices. Vegetation covers 52% of this drainage area where the non-vegetated regions include rubber mat walkways, gravel ballast transitions, raised glass windows, and a quarter of the adjacent semicircular rooftop.
All vegetated surfaces of the monitored rooftop drainage areas are predominately horizontal (see figure 1), with base slopes of <2% toward the rooftop drains.
3.2. Instrumentation
An Onset Hobo U30 (Hobo) weather station was installed on each of the three green roofs described above. The Hobo logger recorded rainfall with a tipping bucket rain gauge and roof runoff with a custom designed weir device. The Onset tipping bucket is accurate to ± 1.0% at up to 20 mm h−1 and temperatures between 0 and 50 ° C. Additional sensors were connected to the logger to record measured environmental conditions such as soil (i.e., growing substrate) moisture content, soil and air temperature, solar radiation, wind speed, and relative humidity. The data logger, weir device, and environmental sensors were all installed within the drainage area selected for monitoring for each green roof.
The custom designed weir device for continuous measurement of green roof runoff consists of a runoff chamber with an outlet weir and a Senix TSPC-30S1 ultrasonic sensor, figure 2(a). The ultrasonic distance sensor measures the depth of water behind the weir face with a resolution of 0.086 mm. As flow increases, the water level behind the weir's face rises. The ultrasonic sensor detects the rise in water height and adjusts its output voltage accordingly. The weir devices were sized to fit into existing rooftop downspouts and accommodate roughly 50 mm h−1 of rainfall in saturated substrate conditions based on the drainage area. Above this flow rate, water overflows the weir into the roof drain to prevent backup and ponding of water on the roofs. Each weir device was constructed by cutting acrylic parts and joining them with Scotch-Weld DP-810NS acrylic epoxy. A baffle was installed at the top of the device and rubber based sealant was applied on all edges to minimize turbulence and eliminate leaks without restricting water flow.
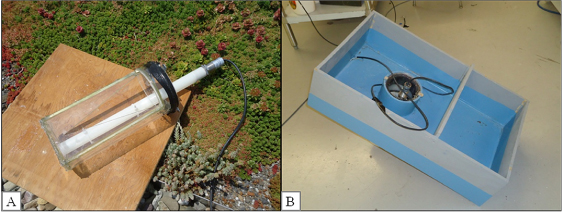
Figure 2. (a) Runoff monitoring weir device, built with V-notch weir and Senix ultrasonic distance measure, prior to downspout installation. (b) Calibration chamber used to simulate rooftop runoff.
Download figure:
Standard image High-resolution imageThe weir devices function between 0° and 70 ° C and were calibrated for flow rates between 0.005–2.5 l s−1, 0.01–3 l s−1, and 0.01–4 l s−1 for the W118, USPS, and ConEd systems, respectively. To calibrate each weir device, a box was built that effectively simulates water flow conditions into roof drains, figure 2(b). Weirs were sealed into the simulation box, as they would be under field conditions, and calibrated up to their designated maximum capacity. Water was pumped into the simulation box, flowed under the baffle, then rose up to enter the weir from all directions. Repeat measurements were taken at incrementally increasing flow rates using an Armfield F1-10 hydraulic bench, which was supplemented with a 6 l s−1 pump at high flow rates. The corresponding voltage output was recorded from the Senix ultrasonic sensor. The resulting data points were used to derive a calibration curve that related sensor output voltage and flow rate. This calibration method significantly reduces errors compared to other techniques that rely on, for example, a combination of measurements at low flow rates and reported weir equations. Once calibrated, weir devices were sealed into the rooftop drains to prevent water loss prior to measurement. Finally, the voltage output of the Senix ultrasonic sensor was connected to Hobo data logger for recording.
The Hobo data logger was configured to take sample readings every second, record 5 min averages, and wirelessly upload the data every hour to the Onset Hobolink data service. Once the data were downloaded, the unique calibration equation for each weir was applied to its voltage readings and normalized by the monitored drainage area to determine runoff depth over each 5 min interval.
4. Results
4.1. Storm event determination
Data were collected from June 2011 to June 2012 for each of the green roofs with the exception of ConEd, where data collection ended in mid April 2012 due to equipment failure. The resulting data were separated into discrete storm events using a modified version of the National Oceanic and Atmospheric Administration (NOAA) standard 6 h dry weather period between individual storms. In this study, a storm event begins when rainfall is first recorded and ends when no precipitation or runoff has been recorded for 6 h. Once individual storms were separated in this manner, storm events considered unsuitable for analyses were discarded. The four criteria used to identify unsuitable events, and the number of such events removed from the dataset for each criteria, are as follows: (1) The recorded peak runoff rate caused the depth of water behind the weir device face to exceed 90% of the notch height (16 events). Flow rates in excess of this amount resulted in unreliable readings due to turbulence within the runoff chamber. (2) Precipitation was in the form of snow (2 events). The processes and time scale of snowmelt runoff differ from that of rainfall and requires analysis beyond the scope of this study for comparison with rainfall data. (3) The cumulative runoff exceeded total rainfall (4 events). This occurred on a limited basis when leaves and other debris clogged the lower portions of the V-notch weir causing unreasonably elevated runoff measurements. Lastly, (4) the ultrasonic sensor lost power over the course of the storm event (5 events). During the study period there were a few cases of building power outages and shortages due to water contact with electrical connections. Following the elimination of data based on the above criteria, the study resulted in 243 storm events, from the original 270 recorded events, which were considered suitable for the purpose of analyses. From this point forward, when discussing observed storms from the monitoring period, the terms 'event' and 'suitable event' are used to describe the subset of all recorded events deemed fit for evaluation. An overview of the storm event data is provided in table 3.
Table 3. Summary of storm events considered suitable for analysis from field monitoring program. The number of events in winter (Dec–Feb), spring (Mar–May), summer (Jun–Aug), and fall (Sep–Nov) is provided to identify seasonal distribution.
| Abbreviated name | W118 | USPS | ConEd |
|---|---|---|---|
| Data start | 6/11 | 6/11 | 6/11 |
| Data end | 6/12 | 6/12 | 4/12 |
| # Total events | 83 | 113 | 74 |
| # Reliable events | 74 | 108 | 61 |
| # Events (0–10 mm) | 43 | 69 | 43 |
| # Events (10–20 mm) | 8 | 18 | 8 |
| # Events (20–30 mm) | 11 | 9 | 5 |
| # Events (30–40 mm) | 2 | 3 | 1 |
| # Events (40–50 mm) | 3 | 1 | 3 |
| # Events (50+ mm) | 7 | 8 | 1 |
| # Winter events | 21 | 24 | 23 |
| # Spring events | 18 | 30 | 6 |
| # Summer events | 19 | 29 | 11 |
| # Fall events | 16 | 25 | 21 |
| Total retention (%) | 36 | 47 | 61 |
4.2. Hydrologic observations
Rainfall depth of the recorded storm events ranged from 0.25 to 180 mm, while the normalized runoff depth varied between 0 and 159 mm. The W118, USPS, and ConEd green roofs retained 36%, 47%, and 61% of the total rainfall from suitable events during the monitoring period, respectively. Rainfall attenuation of individual events ranged widely from 3 to 100% for W118, 9–100% for USPS, and 20–100% for ConEd. The total number of storm events that generated zero runoff was 29, 49, and 15 for the W118, USPS, and ConEd roofs, respectively; where the largest event with 100% retention was 7.6 mm, 5.6 mm, and 2.0 mm, respectively.
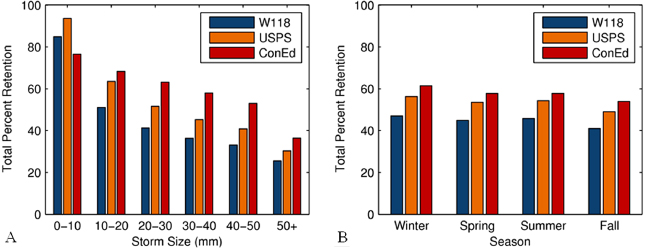
The data show that, generally, as event precipitation increases the per cent of rainfall retained by the green roof decreases, figure 3(a). These results agree with the reported findings of others (Berghage et al 2009, Stovin 2010, Getter et al 2007). Total per cent retention of storms 10 mm or less was 85%, 93%, and 88% for the W118, USPS, and ConEd green roofs, respectively. Surprisingly, the ConEd modular tray system attenuated less rainfall than USPS in the 0–10 mm category and less rainfall than both other roofs in the 10–20 mm category, but retained the most rainfall over the entire monitoring period due to significantly better performance in comparison to the other roofs during larger events. For instance, during storms with 50 mm or more rainfall the average retention for W118, USPS, and ConEd was 21%, 26%, and 34%, respectively. Since substrate depth is thought to be the primary factor influencing water retention for horizontal, sedum roofs, marked changes in the comparative retention performance between the three roofs with rainfall depth were unanticipated. Therefore, these observed variations indicate that factors other than substrate depth might have greater influence on green roof retention performance than is currently reported.

Figure 3. Observed rainfall retention performance during the monitoring period for the W118, USPS, and ConEd green roofs by (a) event size and (b) season. Performance is calculated as the total retention (i.e. (∑(rain) − ∑(runoff))/∑(rain)) for all events within each storm size or season category.
Download figure:
Standard image High-resolution imageAmong the three green roofs, the observations for W118 presented the highest degree of seasonal variability, indicating 70% of rainfall retention during summer months and only 28% rainfall retention during winter months, figure 3(b). Overall trends in seasonal performance for USPS and ConEd were less obvious, as these data did not display higher retention in summer compared to fall and winter—as might be expected due to temperature differences between the seasons, for example. However, given the impact of event size on green roof rainfall retention, figure 3(a), it is possible that actual seasonal trends within the data sets shown in figure 3(b) are masked by the influence of event size distribution within each season. To explore whether this could be the case, green roof seasonal retention for event categories of 0–10 mm, 10–20 mm, 20–40 mm, and 40+ mm rainfall depth were evaluated, figure 4. Note, for the purpose of this analysis it was necessary to combine the retention data for the W118, USPS, and ConEd green roofs, as well as several event categories, in order to provide a reasonable number of events (five or more) within each season for each event category. The only exception to this was summer retention for events of 40+ mm, where only two suitable events in total were available.
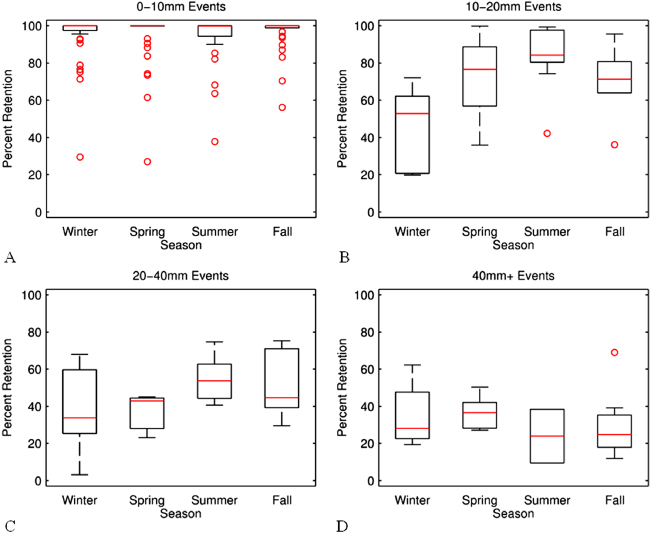
Figure 4. Boxplots indicating the observed green roof seasonal performance during the monitoring period for events of (a) 0–10 mm, (b) 10–20 mm, (c) 20–40 mm, and (d) 40+ mm rainfall depth. Here, performance is defined as per cent retention, on an event-by-event basis, for all combined events on the W118, USPS, and ConEd green roofs.
Download figure:
Standard image High-resolution imageFor events of 10–20 and 20–40 mm rainfall depth, the median rainfall retention was highest in the summer and lowest in the winter; whereas median retention in the fall and spring were similar to one another and lay between the median summer and winter values, figures 4(b) and (c). Therefore, green roof retention performance for events within the range of 10–40 mm rainfall depth support the expectation of higher retention rates during seasons with higher evapotranspiration potential, as described by Liu and Minor (2005), Mentens et al (2006), Schroll et al (2011). Conversely, retention rates for events of 0–10 and 40+ mm rainfall depth did not support this expectation. For instance, the median retention value for 0–10 mm events was 100% for all four seasons, indicating that storm events within this category are often fully retained despite seasonal climate changes, figure 4(a). In addition, events of 40+ mm rainfall had the lowest median retention in the summer, which is the antithesis of expected seasonal behavior, figure 4(d). With the exception of the 0–10 mm events, the data in figure 4 also shows a decrease in seasonal retention variability as event size increases; where median retention rates between seasons range from 53 to 84%, 34–54%, and 24–37% for events of 10–20 mm, 20–40 mm, and 40+ mm, respectively. Overall, the data displayed in figure 4 indicate that there might be limited influence of seasonal climate on the overall retention performance of the three monitored roofs for both small (0–10 mm) and large (40+ mm) storm events.
4.3. Historical context of observed events
Historic climate data, recorded by the Belvedere Castle weather station in Central Park, NYC, were downloaded from the NOAA National Climatic Data Center website (www.ncdc.noaa.gov) for the years 1971–2010. During this time, NYC had an average annual rainfall of 1.29 m and an average daily temperature of 12.87 ° C. Hourly precipitation records from 1971 to 2010 were used to identify storm events based on the NOAA standard of 6 h dry weather period between individual events. These records were continuous with the exception of November 1983 and December 1983, when hourly data were not available. This analysis of hourly precipitation records resulted in the identification of 4291 historic precipitation events.
Figure 5 compares the historic distribution of precipitation by event size in NYC during the last 40 years to the distribution of storms recorded during the monitoring period at each of the three green roofs. During the 40 year historic period, 66% of all events were 10 mm or less, figure 5(a). While these events were the most frequent, they accounted for only 16% of the total rainfall depth, figure 5(b). Alternatively, events of 50 mm or more were only 4% of all historic events, but generated 26% of all rainfall. Given the influence of event size on green roof hydrologic performance, figure 3(a), the distribution of observed events must be similar to that of historic precipitation for reported green roof stormwater retention values to be indicative of 'typical' annual performance. The most notable difference between the historic rainfall distribution in NYC and rainfall during this study, is the increased frequency of events with 50 mm or more rainfall at W118 and USPS compared to Central Park records. As a result, the reported total retention of W118 and USPS during the monitoring period is likely to be lower than typical annual performance over multiple years.
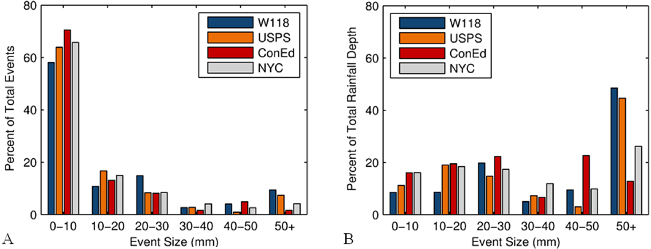
Figure 5. Comparing the distribution of rainfall by event size between the 40 year historic data period (Central Park, NYC 1971–2010) and observations during the monitoring period. (a) Per cent of total events within each category. (b) Per cent of total rainfall within each category.
Download figure:
Standard image High-resolution image4.4. Event-based empirical model
Observed hydrologic performance data display a quadratic relationship between rainfall and runoff for each green roof, figure 6. To model this, a polynomial equation was created for each roof from regression analysis of all storms with non-zero runoff. Removal of the zero-runoff storms was necessary to prevent lower-bound overestimation of runoff. This method for quantifying event-based retention performance of green roofs was developed in Marasco and Carson (2012) based on the concept of quadratic annual relationships identified by Mentens et al (2006) and has since been shown to characterize green roof performance observed by others (Fassman-Beck et al 2013). The resulting regression equations, referred to as characteristic runoff equations (CREs), had r-squared values of 0.98, 0.98, and 0.91 for W118, USPS, and ConEd, respectively. Residuals had random distribution where error is likely due to differences in environmental conditions that would require more data to properly account for using this method. In particular, antecedent moisture conditions, which are dependent on antecedent dry weather days, seasonal evapotranspiration rates and other phenomena, are expected to impact event-based retention.
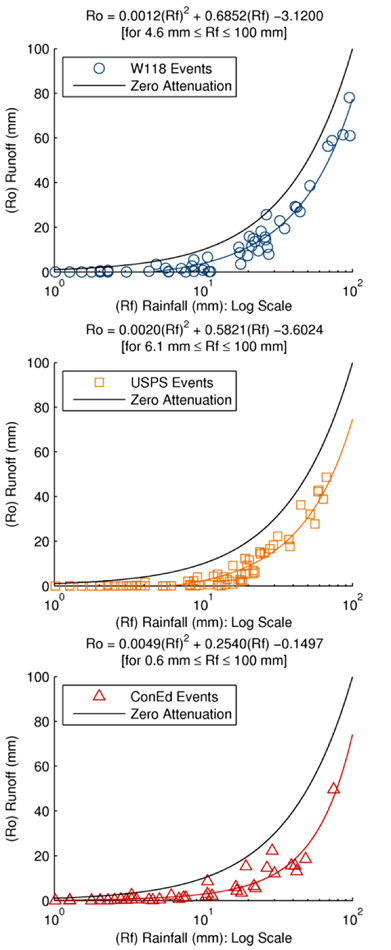
Figure 6. Storm events recorded during the monitoring period for all three green roofs. Characteristic runoff equations (CREs) shown for W118, USPS, and ConEd were created from regression analysis of events with non-zero runoff. The zero attenuation line represents a hypothetical roof where all precipitation becomes runoff.
Download figure:
Standard image High-resolution imageThe characteristic runoff equation (CRE) of each green roof is applicable for rainfall depths up to 100 mm. Most of the suitable storms during the monitoring period were below 100 mm and predictions beyond this value might not accurately represent rooftop performance. For the purpose of the analysis that follows, when rainfall exceeds 100 mm it is assumed that rooftop capacity has been reached and a fixed rooftop retention (mm) is applied based on the value of the relevant CRE at 100 mm of rainfall. The fixed maximum retention depth for storms above 100 mm for W118, USPS, and ConEd was found to be 23 mm, 25 mm, and 26 mm, respectively. When rainfall is less than the x-intercept value of the characteristic runoff equation, runoff is set to zero. This is reflective of the small event performance for each roof. Based on the CREs, models for W118, USPS, and ConEd do not generate runoff until 4.52 mm, 6.06 mm, and 0.58 mm of rainfall has fallen, respectively.
In order to estimate multi-year green roof performance, the 4291 precipitation events identified for the 40 year historic period discussed above were applied to the CREs. Since the CREs are based only on rainfall, not snowfall, all precipitation during the 40 year period was considered rainfall for the purpose of this evaluation. The modeled rainfall retention during the entire 40 year analysis period for W118, USPS, and ConEd was 45%, 53%, and 58%, respectively. As expected, annual performance varied from year to year due to differences in rainfall distribution, with the annual retention rates for W118, USPS, and ConEd ranging between 37 and 52%, 45–62%, and 49–65%, respectively. Figure 7 is analogous to figure 3, but now shows the rainfall retention performance for the modeled 40 years. Unlike the observed performance data in figure 3(a), the multi-year modeling results show a decrease in runoff retention with each increasing storm size in all instances, figure 7(a). Additionally, the differences between the performance of the USPS and ConEd roofs is less marked for the modeled events of 40–50 mm, although the ConEd green roof still retains the least runoff for rainfall depths of 0–10 mm and the most for depths of 50 mm or more. Because the CREs did not account for seasonal factors, the predicted multi-year rooftop performance with season is simply a reflection of the range of events within each season. For NYC, there is little variation in total rainfall depth between seasons. Hence, figure 7(b) shows little inter-seasonal variation in total stormwater retention for each roof. The same holds true when different ranges of event size, such as those presented in figure 4 for example, are considered (data not shown here).
Figure 7. Modeled rainfall retention performance over the 40 year NYC historic precipitation period using the W118, USPS, and ConEd CREs. Performance by (a) event size and (b) season are calculated as the total retention (i.e. (∑(rain) − ∑(runoff))/∑(rain)) for all events within each size or season category.
Download figure:
Standard image High-resolution image
5. Discussion and concluding remarks
5.1. Hydrologic behavior of green roofs
The rainfall retention percentages observed for the three green roofs in this study fall within the range of performance documented by others, see table 1. In addition, the data also agree with the general expectation that the per cent of rainfall retained by a green roof will decrease as event precipitation increases. However, perhaps the most significant finding from observed behavior is that while the ConEd green roof retained less rainfall than USPS in the 0–10 and 10–20 mm categories, it retained more rainfall in the larger event categories. As noted above, since water retention in horizontal sedum roofs is thought to be primarily controlled by substrate depth, it was expected that the best (or worst) performing roof would be the same no matter what the rainfall depth. It is hypothesized that this counter-intuitive finding is due to differences in event-based runoff behavior caused by two main factors: (1) the configuration of non-vegetated regions on the different green roofs; and (2) flow paths through the roof substrate and drainage layers, which differs by construction method.
During small events, runoff from the green roofs is dominated by precipitation on non-vegetated surfaces since the green roof substrate typically remains unsaturated. Compared to W118 and USPS, a significant portion of the non-vegetated area on ConEd is located adjacent to the roof's downspout and, as a result, runoff from these sections flow directly to the instrumented roof drains. In contrast, flow paths from non-vegetated areas to the rooftop drains on W118 and USPS are longer, providing increased opportunities for depression storage and evaporation prior to discharge. As a result, W118 and USPS have higher rainfall retention rates for small storms compared to ConEd.
As rainfall increases and the green roof systems reach their maximum water holding capacity, the total volume of water storage capacity begins to play a greater role in determining runoff volume. The total volume of water storage is thought to be influenced by depression storage, potential substrate storage depth, and the per cent of vegetated area, as well as the availability and hydraulic conductivity of preferential flow paths. In all systems, preferential flow paths likely develop within discontinuities of the substrate, through areas where vegetation is absent, and/or along geo-composite planes, hindering the ability of green roof substrates to retain water. Among the three roofs studied, W118 has the lowest water storage capacity, and therefore the lowest retention rate during large events due to this system's relatively shallow (32 mm) substrate depth. Between USPS and ConEd, which were constructed with the same substrate depth (100 mm), it is hypothesized that ConEd has the highest water storage capacity because drainage through the ConEd system is regulated by several outlets at the base of each modular tray. Conversely, the drainage course beneath the USPS substrate is continuous, so water can vertically exit the substrate at almost any point. During the study period, there was no evidence that the drainage holes at the base of the ConEd tray system were constraining flow enough to cause stormwater ponding in the trays. Nonetheless, in comparison to USPS, drainage restrictions at the base of each tray will lessen the impact of preferential flow paths through the substrate, which in turn will increase the roof's ability to retain water during larger storms.
The above hypotheses are supported by a recently proposed idea that green roofs might have shape and/or installation factors associated with their runoff attenuation behavior (Miller 2012). It also highlights the importance of considering the non-vegetated regions, common for many full-scale installations, as well as substrate drainage conditions, during the interpretation of results from full-scale green roof studies and the development of generalized models for green roof behavior.
5.2. Seasonality of observed performance
Although more data are needed to make conclusive statements about the seasonality of green roof rainfall retention in NYC, the initial analysis presented in this study provides evidence that the influence of seasonal climate on green roof retention rates might be event size dependent. For rainfall depths between 10 and 40 mm, the observed retention performance supported the expectation that retention was highest during summer months and lowest during the winter, whereas this was not the case for events of 0–10 and 40+ mm. It is therefore possible that there are ranges of event sizes over which seasonal climate factors have limited impact on green roof rainfall retention. For instance, there were no seasonal differences in the observed median retention of 0–10 mm events, likely because retention of small events is primarily controlled by the size and location of non-vegetated rooftop areas. For higher rainfall depths, however, seasonal differences in median retention were noted, although the range of median retention values across all seasons decreased as event size increased. The greatest inter-seasonal variability in rainfall retention was observed for events of 10–40 mm, which encompasses the range of potential substrate storage depths for the study sites, table 2. For rainfall events within this range, antecedent substrate moisture conditions will be important in determining the fraction of rainfall depth stored in the substrate. The factors controlling antecedent substrate moisture conditions include local evapotranspiration rates, which will be affected by seasonal climate, and the number of dry days between storms. Thus, seasonal variability in rooftop evapotranspiration rates is thought to explain the trends displayed in figures 4((b) and (c)). For events 40+ mm, the rainfall depth exceeds potential storage depth for all roofs, and aspects such as depression storage, the presence of preferential flow pathways and water drainage restrictions, which are believed to have low seasonal variability, will exert a greater influence on rooftop rainfall retention during a storm. As a result, inter-seasonal variability in retention performance reduces for larger storms.
With respect to the seasonality of retention performance for the individual roofs: figure 3(b) does show notable seasonal trends in total per cent retention for W118 in comparison to USPS and ConEd. It is, however, believed that these observations are skewed by the event size distribution within each season for this roof. Specifically, 95% of the events observed on W118 during the summer months were 30 mm or less, while there were no events larger than 40 mm. Thus, W118's high summer retention values are thought to be explained by a preponderance of smaller storms on this roof during the summer months for the study period. Conversely, in the fall only 69% of events observed on W118 were below 30 mm, while there were three events over 50 mm in depth. As a result, low fall W118 retention values are influenced by a preponderance of larger storms on this roof during this season over the study period. For spring and winter, about 85% of W118 events were 30 mm or less while two events were larger than 50 mm, so observed retention values for these seasons fell between those of summer and fall. For USPS, the months with the highest fraction of events below 30 mm occurred during spring, leading to the highest observed retention during this season. Interpretations of the ConEd trends are more complex due to the patterns of retention with storm size for this roof, figure 3(a). It is considered likely that seasonal variability in retention performance will differ between the W118, USPS, and ConEd systems. However, a full understanding of how seasonal climate affects the hydrologic behavior of individual roofs will probably require multiple years of seasonal observations.
5.3. Green roofs for stormwater management
The goals and available resources of governing entities, owners, and other stakeholders will ultimately determine what, if any, green roof system is preferred for managing stormwater. This study shows that for NYC's climate the installation method, configuration of non-vegetated areas, and total volume of water storage capacity impact overall performance. Given that these conditions typically vary between sites, no two green roofs, even those of the same installation type, will perform identically. Among the three monitored roofs in this study, the modular tray system on ConEd had the highest average rainfall retention rate during 40 year model period (58%) and therefore was most effective at reducing total runoff volume. However, as noted above, rainfall events as little as 3 mm in 1 h can cause CSOs in NYC (Montalto et al 2007). Therefore, if limiting the number of small storm CSO events, rather than reducing total stormwater volume, were the goal, the built-in-place system on USPS might be preferred since it had the highest attenuation of 0–10 mm storm events and fully captured 45% of all storms. Finally, it is important to note that while USPS and ConEd had better rainfall attenuation performance than W118 due to thicker growing substrate depths, the vegetated mat system on W118 was the least costly per m2 of the three systems, and might also be the most constructible on a wider range of existing NYC building stock due to its significantly lower weight.
5.4. Modeled green roof performance
An important observation from the multi-year event-based modeling approach introduced here, is the impact that the distribution of rainfall has on the reported value of overall green roof rainfall retention. As noted above, during the monitoring period, the per cent rainfall retention was 36%, 47%, and 61% for W118, USPS, and ConEd, respectively, while the event-based empirical model using 40 years of historic data estimated retentions of 45%, 53%, and 58%, respectively. The improvement in modeled performance for W118 and USPS is likely due to the higher frequency of storm events with 50 mm or more precipitation in the monitoring period compared to most years, figure 5(b). While the frequency of 50 mm or more events observed at ConEd was lower than the historic period, this was mitigated by an increased frequency of events 40–50 mm, resulting in more similar performance values. In general, the extension of observations to multi-year models, as presented in section 4.4, is a more robust way of forecasting green roof retention performance than other approaches that generalize performance based on a limited number of storm events.
5.5. Advantages and limitations of the multi-year model
The CRE method for estimating multi-year green roof retention is advantaged by being straightforward. Specifically, the multi-year model estimates are based on observed data and historical meteorological records alone, where the latter is publically available via NOAA, or other similar agencies abroad. Furthermore, the embedded relationships between storm size and roof runoff are empirical and do not rely on hydrological models, which have varying degrees of predictive success to begin with Hilten et al (2008), Palla et al (2012), She and Pang (2010), Roehr and Kong (2010). In cases where green roof runoff is also influenced by parameters other than storm size, such as air temperature, solar radiation and antecedent dry weather period, among others, inclusion of some of these factors might improve model accuracy. Nonetheless, the approach presented here is a step forward in enabling better comparisons between full-scale studies, and is considered a sufficient tool to enable a first-order estimation of the impact of wide-spread green roof installation on stormwater management goals in NYC, especially when coupled with other information including sewershed traits.
Finally, an investigation of the accuracy of the W118, USPS, and ConEd CREs when applied to daily rainfall data for the period 1971–2010, instead of individual rainfall events defined by the NOAA standard, returned estimated average rainfall retentions of 48%, 57%, 61%, respectively, for each roof. These retention rates are higher than those projected by the event-based approach, since larger rainfall events, which often take place over multiple days, are represented as a series of smaller 'daily' events when using a daily record approach. Nonetheless, the coupling of the CREs and multi-year, daily rainfall data still affords a reasonable scoping tool for estimating green roof hydrologic performance in the NYC climate zone.
Acknowledgments
This work was supported, in part, by the National Science Foundation (NSF) grant CMMI-0928604 and the Environmental Protection Agency grant AE-83481601-1. Tyler Carson and Daniel Marasco gratefully acknowledge the support of the NSF Integrative Graduate Education and Research Training (IGERT) Fellowship #DGE-0903597. The authors also wish to thank ConEdison, Tecta America, and the Columbia University Office of Environmental Stewardship for their support of this research. Any opinions, findings, and conclusions expressed in this letter are those of the authors and do not necessarily reflect the views of any supporting institution.