
Abstract
Low variability of crop production from year to year is desirable for many reasons, including reduced income risk and stability of supplies. Therefore, it is important to understand the nature of yield variability, whether it is changing through time, and how it varies between crops and regions. Previous studies have shown that national crop yield variability has changed in the past, with the direction and magnitude dependent on crop type and location. Whilst such studies acknowledge the importance of climate variability in determining yield variability, it has been assumed that its magnitude and its effect on crop production have not changed through time and, hence, that changes to yield variability have been due to non-climatic factors. We address this assumption by jointly examining yield and climate variability for three major crops (rice, wheat and maize) over the past 50 years. National yield time series and growing season temperature and precipitation were de-trended and related using multiple linear regression. Yield variability changed significantly in half of the crop–country combinations examined. For several crop–country combinations, changes in yield variability were related to changes in climate variability.
Export citation and abstract BibTeX RIS

Content from this work may be used under the terms of the Creative Commons Attribution 3.0 licence. Any further distribution of this work must maintain attribution to the author(s) and the title of the work, journal citation and DOI.
1. Introduction
Low variability of crop production from year to year is desirable for many reasons including reduced income risk and stability of supplies potentially leading to less volatile food prices [1]. Variations in crop yield from one year to the next are caused by numerous factors, including fluctuations in weather, pest and diseases incidence, use of inputs, and the uptake of technology. Chief amongst these is weather and its importance for crop production is well recognized and reflected in the increasing number of studies examining the impact of climate variability, over seasonal to decadal timescales, on crop yield [2–8].
The green revolution led to increased average yield levels for many crops in most parts of the world over the past 50 years [9], but its impact on the variability of crop production is less clear. It is possible that yield variability may have decreased due to the adoption of crop cultivars less susceptible to environmental stress and the increase in levels of agricultural technology and management. Alternatively, the trend towards monoculture cultivation has narrowed the genetic diversity potentially creating a widespread susceptibility to a single stress leading to greater yield variability from year to year.
Despite its importance only a handful of studies have examined large-area yield time series for changes in variability [10–12]. There is some evidence that the yield of maize has become more variable [10, 11], the yield of wheat less variable [11, 12], and the variability of rice yields unchanged [11]. Each analysis uses a different measure of yield variability and data at different geographical and time domains, making comparison difficult. Also they did not extend their analysis to include climate. All studies assumed that the environmental drivers of yield variability (e.g. climate) are random and stationary. Recently observed changes to climate [13] means that this assumption should be reassessed, especially given that such changes have been attributed to increases in greenhouse gas concentrations [14] indicating that they may persist and are not only due to internal variability of the climate system. It is clear that such changes in climate, in the mean, variability, or both, have the potential to impact upon yield variability and the apparent sensitivity of yield to climate.
This study examines two questions. Firstly, whether the variability of yield of the three most important crops globally (wheat, maize, and rice) has changed during the past 50 years, and secondly whether any such changes can be attributed to changes in the corresponding climate (growing season temperature and precipitation).
2. Methods
Country-level crop yield data for the period 1961–2010 were obtained from the UN Food and Agriculture Organisation [15]. The analysis focused on three of the most widely cultivated crops during the time period: wheat, maize and rice. For each crop, the ten largest producing countries in the 2000s, with the exception of the Soviet Union due to its dissolution during the time period, were examined, thereby focusing attention on the most important producers at the global scale with the most reliable yield data (see supplementary table S1 available at stacks.iop.org/ERL/8/024001/mmedia).
Climate data were obtained from the Climate Research Unit (CRU) at the University of East Anglia [16] and consisted of monthly mean surface temperature and precipitation at 0.5° spatial resolution over land for the years 1901–2009. Therefore, the common period from 1961 to 2009 was used in this study. The CRU dataset has been widely used in crop impacts research and so was regarded as suitable for the purposes of this study. However, it should be noted that it likely contains unknown errors which may bias subsequent analysis particularly the identification of relationships between crop yield and climate [17]. To derive climate indices associated with each crop grown in each country, the climate datasets were averaged over both growing area and growing season months. The set of 0.5° grid cells contributing to the crop growing area was derived from published maps on growing area for the year 2000 [18]. Growing season months were defined for each crop–country combination using crop-calendar information of the USDA [19] and are shown in supplementary table S1. Therefore, it is assumed that the relative distribution of each crop both in space and time has remained relatively constant over the time period. It is likely that for some crop–country combinations this may not be valid due to shifts in growing areas or seasons made possible by advances in crop technology or climate. For example, it has been reported that average planting date for maize in Central USA has advanced by two weeks between 1979 and 2005 most likely due to the adoption of new crop genotypes and changes in management practices [20], while in the North China Plain the sowing time of wheat and the harvest time of maize have been intentionally delayed as a response to regional warming [21]. Unfortunately, at the global scale detailed crop-specific data over the historical period is not available to permit a comprehensive analysis of the sensitivity to the choice of growing areas and months.
National yield time series over the past 50 years commonly exhibit an increase over time due to improvements in crop production technologies. Two approaches are widely used for removing this technology trend: fitting a trend and examining the residuals, or deriving first differences (i.e. the difference from one year to the next). In this study, three polynomials (linear, quadratic, and cubic) were fitted to the yield time series, as well as the first-difference method. The original yield time series and the polynomial approximations are shown in figure 1. In a few crop–country combinations the cubic approximation appears unsuitable (see wheat in Australia and maize in South Africa) and in others is indistinguishable from the quadratic. The linear trend approximation appears a suitable assumption for most combinations, however, there were several crop–country combinations, in particular the rice growing countries, for which it was clearly unsuitable. Therefore, only the residuals from the quadratic trend approximation were retained with the first-differenced yields.
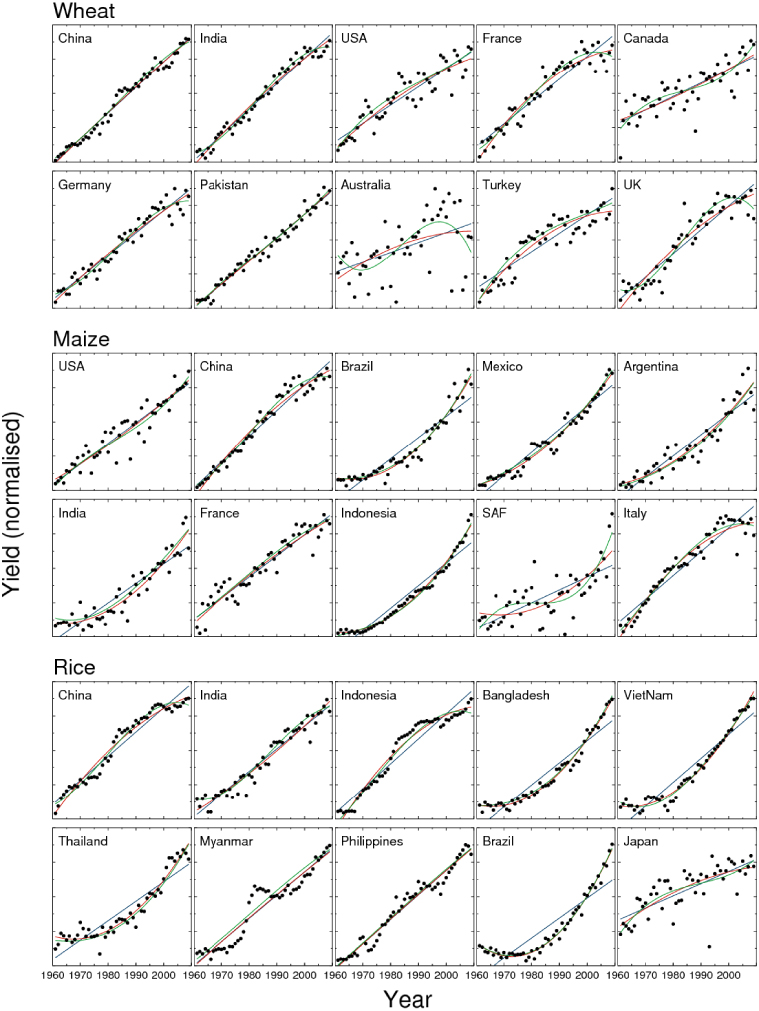
Figure 1. Normalized time series of national-average yield for the main producers of wheat, maize and rice, including linear (blue), quadratic (red) and cubic (green) polynomial fits to the time series.
Download figure:
Standard imageTo determine changes in yield variability through time running variances were calculated for both the yield residuals from the quadratic trend and the first differences using a window of 23 years. The choice of length for the running window was a compromise between a large enough sample size for the calculation of robust statistics, and providing enough data points to detect changes through time. To examine the sensitivity of the results to the choice of 23 years the analysis was repeated with two shorter window lengths (see supplementary figure S2 available at stacks.iop.org/ERL/8/024001/mmedia). To test for significant changes in variability during the time period the change in variance between the first and last window  was compared to the F-distribution with degrees of freedom (n1 − 2 and n2 − 2 where n1 = n2 = 23).
To examine whether variations in crop yield were related to variations in climate, a multiple linear regression was performed for each crop–country combination with first-differenced yield as the dependent variable and first-differenced precipitation and temperature as independent variables. First differences of yield and precipitation were calculated as percentage changes from one year to the next, while differences in temperature were absolute. Regression using first-difference time series assumes that only changes in climate can influence changes in yield. Because the absolute temperature or precipitation can be important for crop growth (i.e. their effects might be non-linear) an alternative regression including the original time series of yield and climate was considered. However, the coincidence of strong increasing trends in yield (due to technology) and temperature (due to global warming) led to spurious associations, even if time was included as an explanatory variable. Therefore, only the regression using first-differenced time series was retained. To attribute changes in yield variance to climate the variance analysis was repeated on the predicted yield, but only for crop–country combinations for which a significant (P < 0.1) model between yield and climate was found. Finally, the analysis was repeated at the global level by aggregating the national data of yield and climate weighting by each country's relative contribution to production.
3. Results and discussion
Yield variability significantly changed between 1961 and 2009 in the majority of the world's major crop producing countries (figure 2). Analysis of the first-differenced yield time series identified 19 crop–country combinations (out of a possible 30) with a significant (p < 0.1) change in variance between the start and the end of the time period, compared to 16 when the residuals from a quadratic fit were used. For wheat, both methods identified significant declines in yield variability in China, India, France and the UK. The first-differenced yields exhibited an increase in variability in the USA and a decrease in Canada, whilst the yield residuals for Pakistan and Turkey declined significantly. The trends in variability are not always even throughout the time period. For example, in China wheat yield variability declined over a number of years following a period of relatively constant variability, in France it declined and then levelled off, whereas in the UK yield variability declined during the most recent 20 years.
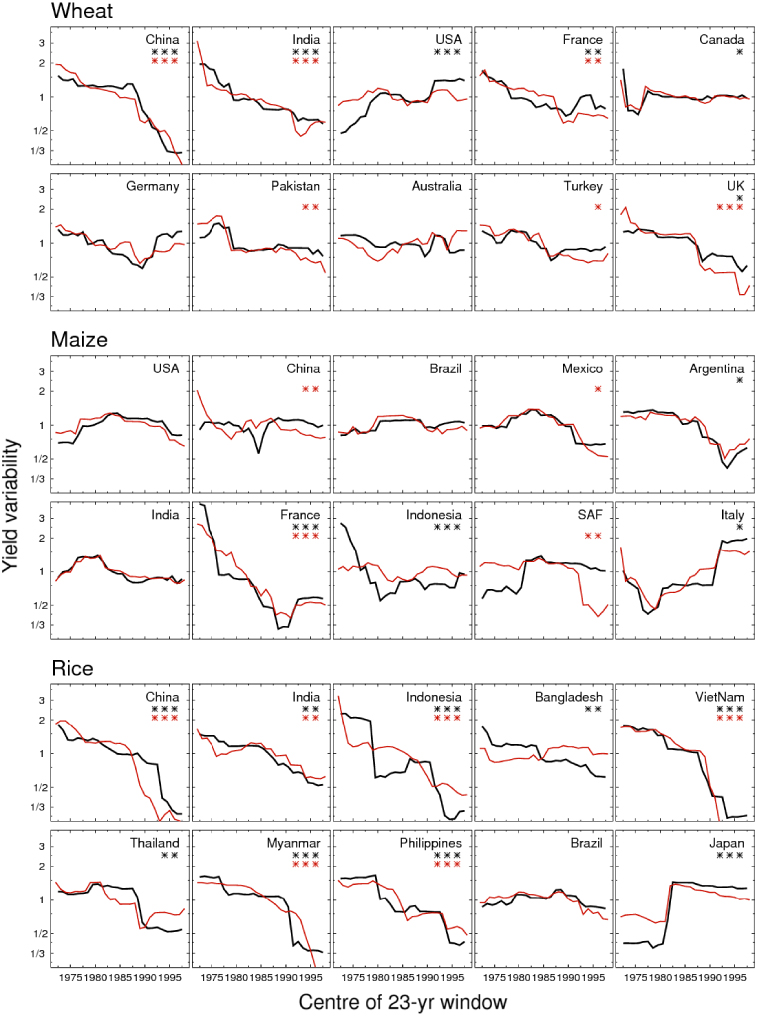
Figure 2. Variability in national-average yield for the main producers of wheat, maize and rice. Twenty three year running variance of first-differenced yields (black) and residuals from a quadratic fit (red) normalized by the mean variance over the whole time series. Significant changes in variance at the 90, 95, and 99th level between the first and final 23 year window are annotated *,∗∗,∗∗∗, respectively.
Download figure:
Standard imageFor maize greater inconsistency between the two yield de-trending methodologies is apparent. Only in France did the two methods agree on a significant decline. Analysis of the first-differenced yield time series identified significant declines in Argentina and Indonesia, and an increase in Italy, whilst the variability of residuals decreased in China, Mexico and South Africa. Disagreement between the two methods in determining significant changes does not necessarily mean that the two methods have widely different evolution in the variance of yield. For instance, there is strong visual agreement between the methods in the USA, Brazil, Mexico, Argentina, India and Italy. However, there are important exceptions, namely Indonesia and South Africa, where there is considerable disagreement on the evolution of yield variability.
Agreement between the two yield de-trending methods was greatest for rice. Yield variability declined in six of the ten countries examined. Additionally, the first-differenced time series exhibited significant declines in variability in Bangladesh and Thailand, and an increase in Japan. A substantial fraction of rice production is supported by some form of irrigation [22]. Recent estimates of harvested areas under rain-fed and irrigated cultivation [23], when aggregated to national level, show that for the top ten producing countries irrigated fraction ranges from around a third for Myanmar and Brazil, up to the entire cultivated area in Japan (supplementary table S2 available at stacks.iop.org/ERL/8/024001/mmedia). Increased use of irrigation to ameliorate the impact of water shortage on yield would potentially lead to a decrease in yield variability. To examine this available data on national irrigation was compared to the changes in yield variability of all three crops (supplementary figure S3 available at stacks.iop.org/ERL/8/024001/mmedia). Whilst the overall area of irrigation has increased markedly for many countries (not shown) the fraction of cultivated area equipped for irrigation has not increased drastically for most crops. For example, irrigated fraction has increased most for Bangladesh (∼5–60%), India (20–40%) and Viet Nam (∼20–50%).
Significant changes in climate variability occurred for several of the crop–country combinations (figure 3). Yet there is no general association between changes in yield variability (figure 2) and changes in climate variability across all crop–country combinations. However, by examining the variance of the predicted yield differences from a yield–climate regression, the importance of climate, or otherwise, in determining the observed changes in yield variability can be evaluated (figure 4). A relationship between climate (temperature, precipitation, or both) and yield residuals was established for 22 out of the 30 crop–country combinations. These can be split in to a group of 9 for which yield variability did not change significantly during the time period (figure 2), and a group of 13 for which significant change was detected. For this latter group, the strictest criterion for attributing the observed change in yield variability to changes in climate is for the predictions from the yield–climate regression to exhibit the same significant change in variability. This occurred in two instances: maize in Indonesia and rice in India where significant declines in rainfall variability have occurred (figure 3). Additionally, a role for climate can be inferred where there is good agreement between the observed and predicted yield residuals. This was the case for seven combinations: wheat in India, maize in Argentina and France, and rice in Vietnam, Thailand, Myanmar and Japan. In the four remaining combinations for which there was no relationship between observed and predicted yield differences (wheat in China and France, maize in Italy, rice in Bangladesh) climate had no impact on yield variability. For six of the 9 crop–country combinations where observed yield variability was constant the predicted yield differences also did not exhibit any significant change. For the remaining three combinations (wheat in Pakistan and Australia, maize in India) yield variability remained unchanged despite changes in climate variability. Finally, there were six combinations (wheat in USA, Canada and UK, rice in China, Indonesia and Philippines) for which, in the absence of a yield–climate relationships, it was not possible to attribute the observed changes in yield variability to climate.

Figure 3. Variability in crop growing season precipitation and temperature. Twenty three year running variance of first-differenced precipitation (blue) and temperature (red) time series normalized by the mean variance over the whole time series. Significant changes in variance at the 90, 95, and 99th level between the first and final 23 year window are annotated *,∗∗,∗∗∗, respectively.
Download figure:
Standard image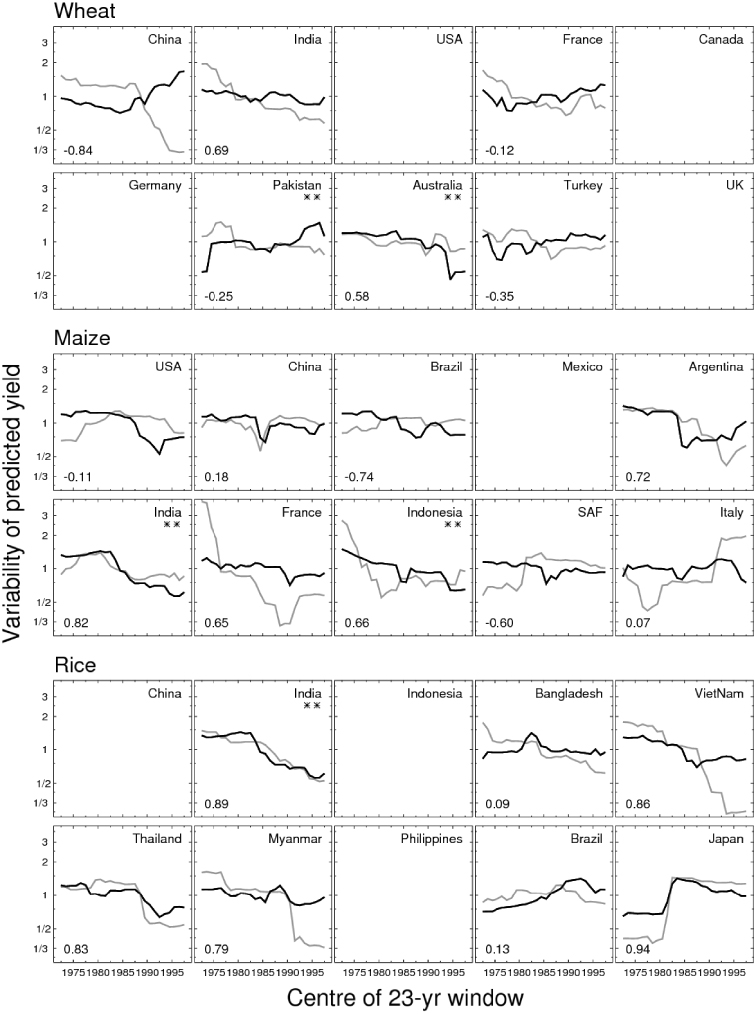
Figure 4. Variance of predicted (black) and observed (grey, repeated from figure 2) first-differenced yields. Results shown only for crop–country combinations for which at least one climate variable was significantly related to yield at the 90% confidence level. Significant changes in variance of predicted yield differences at the 90, 95, and 99th level between the first and final 23 year window are annotated *,∗∗,∗∗∗, respectively. Correlation coefficient between the variance of predicted and observed yield residuals shown in bottom left-hand corner of each panel.
Download figure:
Standard image
Figure 5. Variance of predicted (black) and observed (grey) first-differenced yields at the global level. Variance of predicted yields shown only for crops for which a significant (P < 0.1) multiple linear regression was found. Significant changes in variance of yield differences at the 90, 95, and 99th level between the first and final 23 year window are annotated *,∗∗,∗∗∗, respectively.
Download figure:
Standard imageAt the global scale the variability of wheat and rice yields have declined significantly between 1960 and 2009, whilst the variability of maize peaked during the middle of the time period (figure 5). Consideration of the observed relationship between yield and climate suggests that a significant reduction in the variability of rainfall may have contributed to the reduction in rice yield variability, but that wheat yield variability declined despite an increase in the variability of associated climate.
A major caveat to the approach of attribution via the coincidence of trends is the possible existence of external factors not considered which might have also changed during the past 50 years and impacted upon both crop yield and climate. One candidate for such a confounding variable is the atmospheric concentration of CO2 which has risen in the past 50 years, has impacted on climate as a greenhouse gas, and affects crop growth via photosynthesis. However, it is unclear how rising CO2 concentrations might have significantly impacted the variability of yield. As previously discussed, the increased adoption of irrigation will have contributed to the decline in yield variability by mitigating the impacts of drought, but it may also have contributed to the observed changes in rainfall variability via changes to the local hydrological cycle. Studies examining the role of irrigation in altering local climate have largely focused on the effects on temperature [24] and/or climate averages [25]. Therefore, in order to discount its role as a confounding factor greater understanding is needed of how rainfall variability has responded to expanding irrigation.
Finally, the use of national level monthly climate information raises the possibility that the relationship between yield and climate has not been fully captured. For instance, the use of growing season average measures of climate may not capture the important effects of short-term climate extremes on crop yield (e.g. [6, 26]). Certainly, the inability to establish significant relationships in eight crop–country combinations implies that the methodology was not suitable in all locations. Therefore, more regionalized studies might improve the specifications of the yield–climate relationships and corroborate or refute these findings.
4. Conclusions
This study has taken a broad-scale view of crop yield variability and its relationship with climate. Whilst general conclusions are difficult to draw when considering diverse crop production systems across the globe it appears that, for the majority of crop–country combinations examined, crop yield variability has not increased. Indeed, in half of the cases yield variability has decreased. Direct attribution of the drivers of change in variability, as in previous studies, was not attempted. However, for the first time, the potential role of climate variability was elucidated. The variation of several growing season climates was shown to have changed significantly during the past 50 years. The use of empirical relationships between crop yield and climate identified several countries, in particular maize in Indonesia and rice in India, where significant changes in climate variability have led to the observed reductions in yield variability. In the remainder of cases it was found that climate has not contributed.
Further research is needed to corroborate these claims. Specific crop–country studies would likely better specify the crop–climate relationships and there appears to be an opportunity to use mechanistic crop models, driven with detailed information on past and current climate and management factors such as genotypes and irrigation, to disentangle the potential drivers of changes in crop yield variability. Finally, the identification of irrigation as a potential confounding factor affecting both crop and climate variability independently suggests that greater understanding of crops and climate might be achieved by consideration them as a fully coupled system (e.g. [27]).
Acknowledgments
Crop yield data was obtained from the UN Food and Agriculture Organisation database FAOSTAT. Irrigation statistics were obtained from AQUASTAT. Climate data were provided by Climate Research Unit at the University of East Anglia. Tom Osborne acknowledges funding from the Natural Environment Research Council via the National Centre for Atmospheric Science—Climate directorate. The authors would also like to thank Ed Hawkins and the reviewers for their helpful comments and suggestions in preparing this manuscript.