
Abstract
Exposure to ambient fine particular matter (PM2.5) was responsible for 3.2 million premature deaths in 2010 and is among the top ten leading risk factors for early death. Surface transportation is a significant global source of PM2.5 emissions and a target for new actions. The objective of this study is to estimate the global and national health burden of ambient PM2.5 exposure attributable to surface transportation emissions. This share of health burden is called the transportation attributable fraction (TAF), and is assumed equal to the proportional decrease in modeled ambient particulate matter concentrations when surface transportation emissions are removed. National population-weighted TAFs for 190 countries are modeled for 2005 using the MOZART-4 global chemical transport model. Changes in annual average concentration of PM2.5 at 0.5 × 0.67 degree horizontal resolution are based on a global emissions inventory and removal of all surface transportation emissions. Global population-weighted average TAF was 8.5 percent or 1.75 μg m−3 in 2005. Approximately 242 000 annual premature deaths were attributable to surface transportation emissions, dominated by China, the United States, the European Union and India. This application of TAF allows future Global Burden of Disease studies to estimate the sector-specific burden of ambient PM2.5 exposure. Additional research is needed to capture intraurban variations in emissions and exposure, and to broaden the range of health effects considered, including the effects of other pollutants.
Export citation and abstract BibTeX RIS

Content from this work may be used under the terms of the Creative Commons Attribution 3.0 licence. Any further distribution of this work must maintain attribution to the author(s) and the title of the work, journal citation and DOI.
1. Introduction
Long-term exposure to outdoor air pollution is a major risk factor for some of the most common causes of death, including cardiopulmonary disease, stroke and lung cancer (Krewski et al 2009, Brook et al 2010, Pope et al 2011, Wellenius et al 2012). An estimated 3.2 million annual premature deaths were attributable to ambient PM2.5 exposure in 2010, the ninth leading risk factor for early death (Lim et al 2012).
To address air pollution, countries have established air quality management programs in which national standards for individual pollutants reflect air quality goals, coordinated sector-specific actions reduce emissions to achieve air quality goals, and air quality monitoring measures progress towards meeting these goals (NRC 2005). Pollution reductions achieved through this approach applied in the United States have resulted in an average life expectancy increase of 0.35 years (Correia et al 2013). The US EPA estimates that national air quality management will save 240 000 lives by 2020 and offer $30 of benefits for every dollar spent in control efforts. Eighty-five percent of the benefits will derive from reductions in exposure to ambient PM2.5 (US EPA 2011).
The WHO complements national efforts with a regular evaluation of the impact of outdoor air pollution on global public health. Since 1990, the WHO has sponsored or been involved in the collaborative Global Burden of Disease Study, which provides semi-regular assessments of global disease risk, including the health burden attributable to outdoor air pollution. Independent academic institutions have conducted separate but related air pollution burden assessments (Anenberg et al 2010, Fang et al 2013, Evans et al 2013, Silva et al 2013). These assessments guide policy makers by showing where the air pollution burden is high or worsening, and where more effective air quality management is needed.
Cost-effective air quality management requires an understanding of the primary sources of air pollution and their relative burden. Surface transportation is one global emission sector where sector-specific analysis may better inform national efforts, particularly in low- and middle-income countries with fewer resources. This sector is a significant global source of particulate matter emissions and has been regulated for decades (Yan et al 2011, Sausen 2010). Exposure to vehicle exhaust is associated with a range of acute and chronic health effects including exacerbation of asthma, cardiovascular mortality, and lung cancer (HEI 2010, IARC 2012). Because it is not practical to measure all of the pollutants in vehicle exhaust, the Health Effects Institute has evaluated single markers (e.g. carbon monoxide, nitrogen dioxide, benzene, particulate matter including ultrafine particles, and elemental carbon) and found none of these to be ideal surrogates (HEI 2010). This study considers only the pollutant PM2.5.
Previous studies have evaluated the global health impacts attributable to transportation sub-sectors. Exposure to international shipping emissions resulted in approximately 60 000 annual premature deaths in 2001 (Corbett et al 2007). Future growth in international shipping in the absence of emission controls was estimated to increase global health impacts in the year 2012 by 45 percent above these levels, although a global fuel standard would cause a 30 percent decline (Winebrake et al 2009). Annual exposure to aviation emissions, primarily from secondary particles formed via reactions of nitrogen oxides and sulfur oxides, resulted in an estimated 24 600 annual premature deaths in the year 2006 (Koo et al 2013), while global implementation of a 15 ppm sulfur standard in jet fuel would reduce between 900 to 4000 premature deaths globally (Barrett et al 2012). In the on-road sector, Shindell et al (2011) estimated that stringent emission controls would reduce between 120 000 and 280 000 annual premature deaths.
Two recent studies have estimated source-specific impacts within the United States: Caiazzo et al (2013) estimated that on-road sources caused 52 000 premature mortalities in 2005, while Fann et al (2013) projected 17 000 to 43 000 premature mortalities from the mobile source sector in 2016. In related work published by the World Bank and the Institute for Health Metrics and Evaluation, researchers attributed 184 000 premature deaths worldwide to PM2.5 pollution from road transport in 2010 (Global Road Safety Facility, The World Bank, Institute for Health Metrics and Evaluation 2014). A similar study by the International Council on Clean Transportation estimated 190 000 premature deaths in 2010 exclusively from primary urban PM2.5 emissions from on-road vehicles (ICCT 2013). Both studies use coarse-resolution air quality modeling that does not capture near-roadway exposure; the ICCT excludes the burden of rural and secondary particulate exposures, so these estimates are likely conservative.
These studies reflect different approaches to estimating sector-specific health burden. For example, sensitivity of ambient PM2.5 to a single emission source is estimated by two methods that represent nonlinear chemical dynamics differently (Koo et al 2009). Five studies use a zero-out sensitivity method, which compares two or more model runs with perturbations to the underlying emissions data (Koch et al 2007, Unger et al 2008, Unger et al 2010, Righi et al 2013). In contrast, Fann et al (2013) utilized the capabilities of CAMx to track source-specific PM precursors, a method that provides several advantages over zero-out sensitivity (Arunachalam 2009, Koo et al 2009). Among nine studies, authors use five different exposure-response relationships that take three different forms (Ostro 2004, Krewski et al 2009, Laden et al 2000, Barrett et al 2012, Burnett et al 2014). Furthermore, burden estimates reflect different years based on different demographic inputs (see supplemental table 1, available at stacks.iop.org/ERL/9/104009/mmedia). A common approach to comparing health impacts across emission sectors and transportation modes can provide policymakers greater confidence when evaluating the need for emission controls.
This study moves beyond previous analyses by extending methods developed for the ongoing IHME Global Burden of Disease assessments to estimate the sector-specific air pollution burden attributable to transportation sources. This work applies a global chemical transport model to estimate the fraction of ambient PM2.5 exposure attributable to surface transportation emissions over all land areas at relatively high spatial resolution. These data coupled with IHME estimates of ambient PM2.5 burden give an approach to estimate the sector-specific burden for transportation sources. Going forward, this approach applied to all sectors can facilitate public health surveillance through the ongoing and systematic collection, analysis and interpretation of sector-specific disease burden. These estimates can inform country-level decision making where local technical capacity is weak, support coordinated international action, and inform the regular monitoring and evaluation necessary to respond to changes in risk over time.
2. Methods
2.1. Global health burden attributable to ambient particulate matter
The global health burden attributable to ambient particulate matter in 190 countries is taken from the Global Burden of Disease Study 2010, which estimated 3.1 million premature deaths in 2005 and 3.2 million premature deaths in 2010 (IHME 2013). In that work, exposure to ambient PM2.5 was based on a global dataset of annual average PM2.5 concentrations at a 0.1 × 0.1 degree scale (Brauer et al 2012). These data were derived from satellite retrievals of aerosol optical depth, global chemical transport modeling of spatially resolved global emissions inventories, and ground-level air quality monitoring data. Mortality estimates were based on exposure-response (E-R) functions for ischemic heart disease, cerebrovascular disease, chronic obstructive pulmonary disease, lung cancer, and acute respiratory infection (Burnett et al 2014). E-R functions are nonlinear, where the marginal change in health risk declines as ambient exposure to PM2.5 increases.
2.2. Transportation attributable fraction (TAF) of ambient PM2.5
This study introduces the concept of the TAF, the fraction of ambient particulate matter concentrations attributable to surface transportation at any point in space and time. To estimate annual TAF for ambient PM2.5, this study modeled the change in annual average concentration with and without surface transportation emissions over all land areas in 2005.
Emissions were given by a global emissions dataset of reactive gases and aerosol precursor species, by source sector, prepared for the IPCC's Fifth Assessment Report (Van Vuuren et al 2011). This study uses emissions from the RCP 8.5 scenario, although variation between RCP scenarios is minor for year 2005 emissions. Surface transportation sources include all mobile equipment powered by gasoline and diesel engines such as on-road passenger vehicles and commercial trucks, as well as rail transportation and off-road agricultural and construction equipment.
A base simulation was run with emissions from all 12 sectors included in the global dataset, and the impact of removing individual source sectors on ambient PM2.5 concentrations was quantified using a zero-out sensitivity simulation in which we ran the model with the surface transportation sector removed. The change in modeled concentrations of annual average PM2.5 was considered equal to the contribution of surface transportation emissions.
Chemical transport modeling was performed using the Model for Ozone and Related Chemical Tracers (MOZART-4), which captures dispersion and secondary particle formation (Emmons et al 2010). MOZART-4 was operated at 0.67° longitude by 0.5° latitude horizontal resolution with 72 vertical hybrid (sigma and pressure) levels. The simulation was run for six months as spinup, with annual average surface PM2.5 concentrations for the year 2005 used for analysis. Surface concentrations were considered to be concentrations in the first nominal vertical level (992.5 mb). This high resolution was defined by the resolution of the meteorological input data, and required adjustments to the original source code and run scripts. The resulting TAF estimates provide global coverage, including exposures in rural areas as well as urban areas, and they reflect changes in both primary and secondary forms of ambient PM2.5.
2.2.1. Health burden attributable to surface transportation
Annual premature deaths in 2005 attributable to surface transportation emissions of PM2.5 were estimated for 190 countries. National health burden was taken as the product of total ambient PM2.5 burden given by the Global Burden of Disease 2010 in each country for the year 2005, and a national population-weighted TAF estimated from this study (see supplemental figure 1). Global health burden was taken as the sum of national health burden estimates. To estimate national population-weighted TAF, a 0.1° × 0.1° global lattice of population was taken from Brauer et al (2012) with each point assigned a country identification and TAF value using a point-in-polygon spatial join in ArcGIS 10.2 (ESRI 2013). This approach assumes that the fractional contribution of surface transportation emissions to ambient particulate matter concentrations equals the fraction of the total health burden of PM2.5 attributable to this sector. This application of TAF assumes equal exposure within each grid cell for which a TAF value was estimated and equal toxicity of ambient particulate matter irrespective of source or location; although PM2.5 composition varies across sources and may vary in toxicity, current evidence cannot clearly isolate the effects of any specific source or component (Bell 2012, Lippmann et al 2013).
2.3. Uncertainty in mortality and TAF
The Global Burden of Disease Study 2010 provides 95% confidence intervals for mortality associated with exposure to ambient PM2.5, and these are used to express uncertainty in the transportation-attributable mortality results (table 2). These confidence intervals integrate the uncertainty in the parameters of the E-R function, estimates of PM2.5 exposure, and the counterfactual concentration (Burnett et al 2014, Brauer et al 2012). Uncertainty of TAF estimates is not quantified, but is expected to be high given the compounded uncertainty in anthropogenic emission inventories (Pouliot et al 2012), uncertainty in the modeling of aerosol concentrations (Lamarque et al 2013, Shindell et al 2013), and uncertainty in the accuracy of the zero-out sensitivity method to estimate source-specific impacts given nonlinear chemical dynamics (Koo et al 2009).
Modeled estimates of the TAF are evaluated relative to estimates from receptor-based source apportionment studies. Receptor-based TAF estimates (rTAF) are derived by applying mass balance equations for individual species to match the observed chemical profile of PM2.5 samples (Watson 1984, Pattero and Tapper 1994). Comparison values are restricted to apportionment of PM2.5 and data collected between 2002 and 2008, which limited the pool to 50 rTAF estimates (28 studies covering 45 locations, see supplemental table 2). These estimates are predominantly from urban areas, and studies vary in analysis techniques. Receptor-based modeling is sensitive to sampling and analytical technique, so rTAF values themselves are uncertain, particularly in cases where only a single analytical technique is applied (Rizzo and Scheff 2007, Lee et al 2008, Viana et al 2008, Pant and Harrison 2012).
3. Results
3.1. Global and regional TAF
Figure 1 shows the spatial distribution of TAF globally in 2005. The data show positive spatial autocorrelation—points nearer to each other are much more likely to have similar values; high-value peaks vary little from values in nearby surrounding areas and decrease very gradually into areas with low values. A small number of global peaks are present, particularly in Germany, Japan, northern US and Mexico, but the spatial scale of the dataset is not sensitive to more numerous hotspots expected at the smaller scale of cities or urban agglomerations. TAF itself does not directly indicate the magnitude of health impact, since this value does not reveal the volume of emissions or magnitude of exposure. Areas with low TAF may still have equal or greater total impacts compared to areas with high TAF.
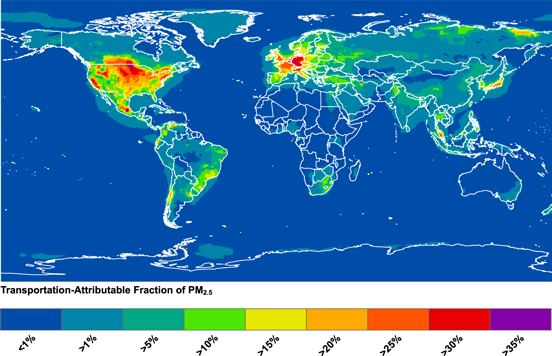
Figure 1. Surface transportation share of annual average PM2.5 concentrations in 2005.
Download figure:
Standard image High-resolution imageAs shown in table 1, the global population-weighted TAF in 2005 was 8.5%, and regional TAF averages varied by over a factor of 50. The top three regions—high-income North America, Western Europe, high-income Asia Pacific—have a TAF more than double the global average and the highest population-weighted modeled PM2.5 concentrations. These results may be explained by high per-capita vehicle ownership and a high degree of commercial vehicle activity in these regions (ICCT 2013), as well as by lesser contributions from other emission sources. The lowest TAF values are found in most of sub-Saharan Africa with the exception of southern sub-Saharan Africa, whose value is nearly equal to the global average. The unweighted global TAF is 5.1% and across all regions the unweighted TAF is lower than the population-weighted TAF, reflecting a propensity for exposure to vehicle emissions to occur in densely populated areas.
Table 1. 2005 Population-weighted PM2.5 concentrations attributable to surface transportation, based on MOZART-4 simulations, and the transportation-attributable fraction (TAF) of PM2.5 for surface transportation. Countries are aggregated into 21 geographic regions following the grouping used in the Global Burden of Disease 2010.
| Region | Modeled concentration (μg m−3) | TAF (Percentage) |
|---|---|---|
| High-income North America | 2.51 | 23.5% |
| Western Europe | 3.34 | 22.8% |
| High-income Asia Pacific | 3.96 | 20.6% |
| Central Latin America | 1.54 | 17.7% |
| Southern Latin America | 1.29 | 13.2% |
| Central Europe | 2.32 | 12.6% |
| Tropical Latin America | 1.17 | 12.0% |
| Southern sub-Saharan Africa | 1.05 | 8.7% |
| Global | 1.75 | 8.5% |
| Eastern Europe | 1.10 | 8.1% |
| Southeast Asia | 0.93 | 7.2% |
| North Africa and Middle East | 1.85 | 7.0% |
| Andean Latin America | 0.29 | 6.9% |
| South Asia | 2.05 | 5.9% |
| Caribbean | 0.38 | 5.5% |
| Australasia | 0.30 | 5.1% |
| East Asia | 1.97 | 4.9% |
| Central Asia | 0.56 | 3.7% |
| Western sub-Saharan Africa | 0.34 | 1.5% |
| Oceania | 0.02 | 1.3% |
| Eastern sub-Saharan Africa | 0.08 | 1.0% |
| Central sub-Saharan Africa | 0.05 | 0.4% |
Three regions—South Asia, East Asia, and North Africa and Middle East—have lower than average population-weighted TAF, and yet they have greater than average population-weighted annual average PM2.5 concentrations from surface transportation. This reflects the high emissions of other sectors in those areas, and it reflects the co-location of industry and energy production emissions with surface transportation emissions in areas of high population density.
At the national level, population-weighted TAF varied widely from a minimum value of <1% in Micronesia to a maximum of 32% in Luxembourg, closely followed by Germany, the Netherlands, and Belgium with 31% (supplemental table 3).
3.2. Comparison of MOZART-4 and receptor-based TAF estimates
A comparison reveals a low degree of agreement between modeled and receptor-based TAF (rTAF) estimates (see supplemental figure 2), but with little indication of overall model bias. In high-income regions where receptor-based measurements are more extensive, the average standard deviation among points at the same location is lower than for low- or middle-income regions. TAF tends to be overestimated compared to rTAF in high-income regions, while the opposite is true in low- or middle-income regions. This suggests that the transportation-attributable mortality reported in this paper may underestimate the total burden in low- or middle-income countries. The limited pool of rTAF values did not provide enough evidence to adjust TAF estimates nor to derive rigorous error estimates. The poor agreement reflects uncertainty in available methods for estimating TAF.
3.3. Annual premature mortality attributable to surface transportation emissions
In 2005, approximately 242 000 annual premature deaths were attributable to exposure to ambient particulate matter from surface transportation. This number is equal to approximately 8.0 percent of all premature deaths attributable to ambient particulate matter. Because baseline mortality rates vary by country, the share of mortality does not scale directly with global population-weighted TAF. Table 2 shows the total mortality and the crude per-capita mortality rate attributable to these surface transportation emissions.
Table 2. 2005 Annual premature mortality attributable to particulate matter from surface transportation and the transportation-attributable mortality per 100 000 population. 95% confidence intervals in parentheses are based on uncertainty in total mortality from ambient PM2.5 exposure (IHME 2013) but do not include uncertainty in TAF. The mortality rate reflects the number of transportation-attributable deaths divided by the total regional population.
| Region | Absolute mortality | Mortality rate (deaths per year per 100 000 population ) |
|---|---|---|
| East Asia | 58 100 (49 100–66 500) | 4.3 (3.7–5) |
| Western Europe | 43 500 (35 700–51 700) | 10.6 (8.7–12.7) |
| South Asia | 35 300 (30 300–40 300) | 2.4 (2–2.7) |
| High-income North America | 26 100 (21 500–30 800) | 7.9 (6.5–9.3) |
| High-income Asia Pacific | 17000 (13 600–20 500) | 9.5 (7.6–11.4) |
| Eastern Europe | 15 700 (13 300–18 200) | 7.4 (6.3–8.6) |
| Central Europe | 13 600 (11 700–15 700) | 11.4 (9.7–13.1) |
| North Africa and Middle East | 12 300 (10 900–13 800) | 3.1 (2.7–3.5) |
| Southeast Asia | 10 000 (8300–11 900) | 1.7 (1.4–2.1) |
| Central Latin America | 4500 (3800–5300) | 2.1 (1.7–2.4) |
| Central Asia | 1900 (1700–2200) | 2.5 (2.2–2.9) |
| Western Sub-Saharan Africa | 1000 (800–1200) | 0.3 (0.3–0.4) |
| Tropical Latin America | 900 (700–1300) | 0.5 (0.3–0.7) |
| Southern Latin America | 500 (300–700) | 0.8 (0.5–1.2) |
| Caribbean | 300 (300–400) | 1 (0.7–1.2) |
| Southern Sub-Saharan Africa | 300 (300–400) | 0.5 (0.4–0.6) |
| Eastern Sub-Saharan Africa | 200 ((200–300) | 0.1 (0.1–0.1) |
| Andean Latin America | 200 (100–200) | 0.3 (0.2–0.4) |
| Central Sub-Saharan Africa | 100 (0–100) | 0.1 (0.1–0.1) |
| Australasia | 100 (0–100) | 0.2 (0.1–0.4) |
| Oceania | 0 (0–0) | 0 (0–0) |
| Global total | 241 700 (202 400–281 600) | 3.7 (3.1–4.4) |
The greatest absolute burden of surface transportation emissions was experienced in East Asia followed by Western Europe, South Asia, high-income North America, and high-income Asia Pacific. Those five regions account for over three quarters of all transportation-attributable mortality in 2005, but account for 58% of the global population. The mortality rate from surface transportation was greatest in Central Europe followed by Western Europe, high-income Asia Pacific, and high-income North America—the value in these regions was more than double the global average.
A number of factors may explain high mortality rates in these industrialized regions. These populations experience higher concentrations of transportation-attributable PM2.5, which may be explained in-part by higher per-capita rates of vehicle ownership and advances in controlling point sources. High-income countries also tend to have older populations and higher baseline rates of chronic disease. Additionally, the nonlinear E-R model used in the Global Burden of Disease study to predict ambient particulate matter mortality penalizes wealthier countries, which have mature air quality management programs and cleaner air. This model predicts that the marginal impact of an incremental change in pollution from any given source is greater in regions with cleaner air than it would be in more polluted parts of the world (Smith and Peel 2010).
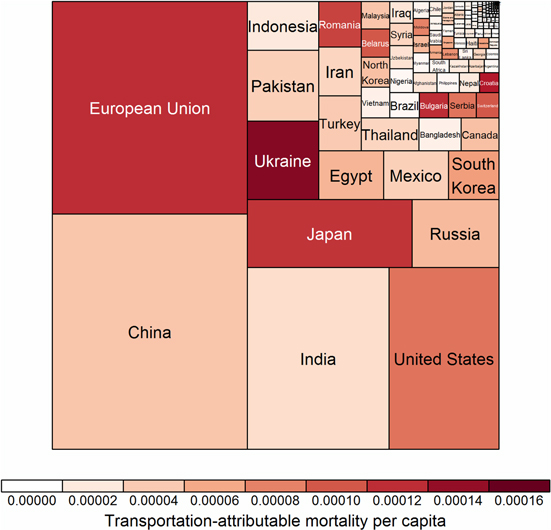
Figure 2 shows absolute premature mortality by country. China, India, the United States and the European Union accounted for the majority of the global burden from surface transportation emissions exposure in 2005. The highest national rates were in Germany, Belgium, and Hungary (see supplemental table 1). These national-level estimates give more targeted information to multilateral institutions and national-level stakeholders who are in a position to address vehicle emissions.
Figure 2. 2005 global premature mortality from surface transportation emissions of PM2.5, by country. The European Union reflects year 2005 membership. Area is proportional to the share of global health burden, and color represents the transportation-attributable mortality rate.
Download figure:
Standard image High-resolution image
4. Discussion
4.1. Examining the use of TAF
A key challenge for researchers in sector-specific burden estimates is presented by the nonlinearity of disease response to ambient particulate matter exposure (Burnett et al 2014). In nonlinear E-R models, the marginal change in risk is determined in part by the rate of change in exposure to sources other than transportation. Two possible assumptions are (a) non-transportation emissions are fixed or (b) non-transportation emissions are zero. For a given mass of PM2.5 reduced from transportation sources, the former would result in a lower absolute impact and the latter would result in a higher absolute impact. The absolute difference between the two grows considerably as the contribution to total PM2.5 from non-transportation sources increases.
Development and application of the TAF in this study adopts neither of these assumptions. This work assumes that the impact per unit mass emissions from the transportation sector is equal to the impact of all other sources at any given exposure level. While the impact per unit mass will still vary across levels of absolute exposure, this approach allows sectoral burden estimates to derive from the relative share of exposure and avoid re-estimates of dose-response. Absolute ambient PM2.5 burden estimates will account for nonlinear dose-response when comparing total PM2.5 against a counterfactual3 level. The TAF functions by allocating portions of this absolute burden, thereby avoiding the re-application of nonlinear dose response and any counterfactual assumptions of exposure to non-transportation emission sources.
The TAF allows researchers to extend the Global Burden of Disease, a well-established ongoing exercise that produces authoritative estimates of outdoor air pollution health burden. Enormous resources are mobilized in the creation of the GBD to collect and validate mortality data, review and synthesize epidemiological evidence, and calibrate results against other risk factors. Researchers who focus on TAF can work in parallel, contributing valuable new knowledge on methods to assign sector-specific burden in a way that provides clear sector-specific guidance for air quality management. This approach also ensures that health estimates are comparable across sectors. The TAF can become a policy tool for exploring the changing nature of health burden from transportation emissions exposure over time.
4.2. Limitations and additional sources of uncertainty
Uncertainty in TAF estimates was not quantified for this study, but a comparison of values against receptor-based estimates suggests a high degree of uncertainty in estimating the true transportation-attributable fraction from either measured or modeled approaches. Mobile source emission inventories are a major source of uncertainty in modeled TAF. Among several factors influencing uncertainty in mobile source emissions, the assumed share of fuel use across modes produces a range of uncertainty on the order of 30 percent (Borken et al 2007), and an inventory that does not account for older, poorly functioning vehicles with very high emissions (super-emitters) may produce PM2.5 estimates 40 percent lower than one that does (Yan et al 2011). Differences in emission factors determined by dynamometer testing compared with those measured under actual driving conditions may also lead to error in emission inventories (Lowell and Kamakate 2012, Weiss et al 2012). The different patterns of agreement between modeled versus measured TAF shown in low- or middle-income regions compared to high-income regions may result from several factors. The limited receptor-based data in low-income regions necessitates a comparison of values from a variety of measurement methods which may produce widely varying estimates of TAF (Pant and Harrison 2012). Mobile source emission inventories are also highly uncertain in low-income countries where data on emission factors, activity, and super-emitters is scarce (Bond et al 2013). Comparisons of health burden between low- and high-income countries should be made with appropriate consideration of the challenges validating emission inventories and modeled TAF in low-income regions. Continued efforts to combine ambient monitoring and receptor-based source apportionment with modeled estimates, including validation of activity data and vehicle emissions, particularly in low-income countries, as well as hybrid receptor/model approaches, can improve overall estimates of TAF and identify problems with underlying data (Bond et al 2013, Hu et al 2014).
Uncertainty in the E-R function and ambient PM2.5 exposure mortality estimates produces a range of 202 000–281 000 transportation-attributable mortalities within a 95% confidence interval. This reflects potential variation in the shape parameters and some variation in the counterfactual. As functions are based on observational data, they do not extend to the theoretical zero-exposure counterfactual, but the WHO has acknowledged that any threshold for the adverse effects of PM2.5 is likely to be zero or near zero (WHO 2013). The E-R function does not account for differences in effective dosage due to varying time spent outdoors, differences in travel and near-road activity, and differences in building ventilation, but these are known to vary across regions (Chen and Zhao 2011, Zuurbier et al 2010). There are also differences in vulnerability to PM2.5 across regions and in certain sub-populations due to underlying health status, genetic background, and co-exposures to other pollutants that may not be captured in our results.
In addition, the resolution of this TAF does not capture intraurban variations in exposure or urban hot-spots, and it is not sensitive to the high exposures to harmful pollutants experienced in on-road and near-road microenvironments. Thus, while the TAF in this study can indicate the contribution of land transportation to broad-scale national exposure, it does not reflect the contribution of transportation to city-scale air quality problems. It is estimated that up to 45 percent of urban populations in North America live near a major road, and in major cities like Beijing the share may be as high as 76 percent (HEI 2010). Because the transportation-attributable PM2.5 exposure of many urban dwellers includes both near-road peaks and ambient concentrations, the TAF of ambient PM2.5 concentrations in this study may underestimate the TAF of overall PM2.5 exposure. Urban-scale modeling that incorporates greater sensitivity to intraurban variation in emissions along with nested global models that capture higher spatial variation in exposure could improve upon TAF estimates across multiple spatial scales.
5. Conclusions
Based on an estimated 3.1 million premature deaths attributable to ambient particulate matter in 2005, this study attributes approximately 0.25 million to surface transportation emissions. TAF varied from <1 to 32 percent at the national level, and mortality rates ranged from 0 to 20 premature deaths per 100 000 population. The resolution of these results allows a comparison of total burden and mortality rates between nations, informing national policy makers and international aid organizations involved in transportation emissions control. TAF alone is not a direct indicator of burden, but is used here as a tool to estimate burden. Future research should improve methods to infer TAF based on measurements, and should include cross-method validation. Multi-pollutant assessments could further improve estimates of the contribution of single sources to the burden of all ambient pollution. Greater resolution of TAF in urban areas would also capture intraurban variation that more accurately reflects vehicle emissions exposure.
These estimates suggest the regions with the greatest transportation-attributable mortality in 2005 were East Asia, South Asia, Western Europe and North America. These regions would derive the greatest health benefit from actions to reduce transportation emissions. In the last decade the US, Canada, EU, Japan, and South Korea have implemented emission control measures that significantly reduce primary PM2.5 and other emissions from both light- and heavy-duty on-road vehicles. At the same time, vehicle activity growth in many developing countries, particularly in East and South Asia, has produced large increases in vehicle emissions. These countries are in a position to contribute the greatest absolute reduction in health burden from vehicle emissions exposure, both at a national scale and as a share of the global burden.
TAF-based analysis could support a variety of policy-oriented analyses not possible with the results from the Global Burden of Disease. Re-estimation of TAF for alternate years would facilitate comparison of health burden over time. This coarse-level surveillance could evaluate the effectiveness of adopted emission policies. Comparison against the abatement potential of new policy can directly inform new regulations. Given the role TAF could play in environmental and health policy, future exploration of this metric is an important avenue for research.
Acknowledgements
This work was made possible by grants from the ClimateWorks Foundation and the William and Flora Hewlett Foundation and a fellowship from the Portuguese Foundation for Science and Technology.
Footnotes
- 3
In a study considering the burden of anthropogenic PM2.5, the counterfactual should ideally represent the level of exposure absent any anthropogenic emissions. The counterfactual used in the GBD instead represents the lowest observed exposures among a body of epidemiological studies.