
Abstract
Possible future changes of clustering and return periods (RPs) of European storm series with high potential losses are quantified. Historical storm series are identified using 40 winters of reanalysis. Time series of top events (1, 2 or 5 year return levels (RLs)) are used to assess RPs of storm series both empirically and theoretically. Additionally, 800 winters of general circulation model simulations for present (1960–2000) and future (2060–2100) climate conditions are investigated. Clustering is identified for most countries, and estimated RPs are similar for reanalysis and present day simulations. Future changes of RPs are estimated for fixed RLs and fixed loss index thresholds. For the former, shorter RPs are found for Western Europe, but changes are small and spatially heterogeneous. For the latter, which combines the effects of clustering and event ranking shifts, shorter RPs are found everywhere except for Mediterranean countries. These changes are generally not statistically significant between recent and future climate. However, the RPs for the fixed loss index approach are mostly beyond the range of pre-industrial natural climate variability. This is not true for fixed RLs. The quantification of losses associated with storm series permits a more adequate windstorm risk assessment in a changing climate.
Export citation and abstract BibTeX RIS

Content from this work may be used under the terms of the Creative Commons Attribution 3.0 licence. Any further distribution of this work must maintain attribution to the author(s) and the title of the work, journal citation and DOI.
1. Introduction
Extreme windstorms are the most important natural hazards affecting Western Europe (Lamb 1991, Schwierz et al 2010). In situations when a recurrent extension of an intensified eddy driven jet towards Western Europe lasts for at least one week, multiple extreme cyclones may follow a similar path within a relatively short time period (e.g. early 1990). Such clustering of cyclones over the North Atlantic and Western Europe has been identified in reanalysis data (Mailier et al 2006, Pinto et al 2013). In particular, extreme cyclones cluster more than non-extreme cyclones (Vitolo et al 2009, Pinto et al 2013). Windstorm clusters often have large socio-economic impacts and may cause high cumulative losses, like in 1990 with about 8.5bn € (DeutscheRück 2005). Another recent example is the windstorm series in winter 2013/2014, which mainly affected the British Isles. Due to the Solvency II requirements (Solvency Capital Requirements, QIS5), insurance companies need to improve the assessment of frequencies and return periods (RPs) of storm series and their 'aggregate loss exceeding probability' under present and future climate conditions. Karremann et al (2014) evaluated different methods to estimate RPs of windstorm series for Germany and identified the negative binominal distribution as the best approach.
Estimates of loss potentials for both recent climate and future climate projections are mostly restricted to annual losses (e.g. Pinto et al 2007, Donat et al 2011), and seldomly deal with single extreme events (e.g. Haylock 2011, Pinto et al 2012). Possible future changes of losses strongly depend on the model and the analysed periods (see Feser et al 2014 for a review on storminess affecting Europe). However, some studies identified shorter RPs for windstorms affecting Western/Central Europe in future decades (e.g. Della-Marta and Pinto 2009, Pinto et al 2012). With respect to storm series, results by Pinto et al (2013) point to a possible decrease of cyclone clustering over parts of Western Europe during the current century. In this study, RPs for multiple event losses associated with storm series under present and future climate conditions are analysed for several European regions. Following Karremann et al (2014), RPs from NCEP reanalysis and general circulation model (GCM) data are estimated theoretically and empirically. Methods and datasets are described in section 2, followed by results in section 3. A summary and discussion is given in sections 4 and 5.
2. Data and methods
Reanalysis data from the National Centre for Environmental Prediction/National Centre for Atmospheric Research (hereafter NCEP) with a horizontal resolution of 1.875° (about 140 × 210 km grid spacing at mid-latitudes; Kistler et al 2001) are analysed. For each calendar winter day (October–March) from 1973/1974 to 2012/2013, the largest of the four instantaneous 6 hourly 10 m wind speed is taken as the daily maximum. Twenty transient simulations performed with the coupled ECHAM5/MPI-OM1 GCM (Jungclaus et al 2006), also with a horizontal resolution of 1.875°, are considered: three realizations of MPI (Roeckner et al 2006) and 17 from the ESSENCE project (Sterl et al 2008). Maximum winds for 6 h periods (wimax) are used to determine the daily maximum wind. Pinto et al (2007) showed that results of the storm loss model (see below) are equivalent when using instantaneous wind speeds or wimax as input variables. For recent and future climate conditions, the periods of 1960–2000 and 2060–2100 are used, corresponding to the 20C and A1B scenarios. We assume that all ensemble-members are equally probable. The choice of a large ensemble for a single GCM model is motivated by the focus on statistical robustness of the results rather than on inter-model dependency or sensitivity (Taylor et al 2012). To quantify natural inter-decadal climate variability, a 505 year long pre-industrial run (PRE) of ECHAM5 with constant forcing (year 1860) is also analysed.
A modified version of the storm loss model by Klawa and Ulbrich (2003) is used to estimate cumulative losses of storm series. The potential damage is proportional to the cube of the daily maximum (gust) wind speed (Palutikof and Skellern 1991, Klawa and Ulbrich 2003). Losses are primarily caused by wind gusts, when a certain local threshold is exceeded. For Western and Central Europe, the 98th percentile (supplementary H) is assumed to be a reasonable critical threshold, implying that buildings were constructed according to the local climatological wind conditions (Klawa and Ulbrich 2003). The 98th wind gust percentile over this area corresponds to about 20–21 m s−1 (8 Bft). Such wind gust values imply wind speeds between 8 m s−1 and 11 m s−1, depending on the given gust factor (relationship between wind gust and wind speed, e.g. Wieringa 1973, Born et al 2012). A careful analysis indicated that 9 m s−1 wind speed is an adequate minimum threshold for regions where the 98th percentile values are too low (parts of Scandinavia, the Mediterranean and South–Eastern Europe) and thus not reasonable for loss occurrence. The resulting potential damage is weighted with population density and aggregated to potential losses (LI). Further details can be found in Pinto et al (2012) and Karremann et al (2014). Population density of the year 2000 (0.25° × 0.25°) is used as proxy for insurance data, possible population density changes in Europe are neglected. The dataset is provided by the Centre for International Earth Science Information Network of the Columbia University and the 'Centro International de Agricultura Tropical'. LIs are estimated for single events for European countries/regions. Resulting event sets are ranked according to LI values, and 1, 2 and 5 year return levels (RLs) (abbreviated as 1yrl, 2yrl, and 5yrl) are generated (40, 20 and 8 events with highest LI in 40 winters, respectively). Time series are obtained by allocating the events corresponding to individual winters, enabling the estimation of empirical RPs for storm series with different RLs.
The probability for the incidence of multiple events per winter can be estimated theoretically with the negative binomial distribution, which is a standard distribution to analyse insurance risks. Estimated RPs using this theoretical distribution show the best agreement with empirically estimated RPs of windstorm series (see supplementary E, F, Karremann et al 2014). Theoretical RPs of multiple events per winter for given RLs are defined as the inverse of the probability of their occurrence. The clustering of events is determined by the dispersion statistics (ψ). More details can be found in supplementary B and in Karremann et al (2014) (see their section 3). The methodology is applied to 21 European countries/regions (supplementary A). Core Europe is defined as France, Belgium, Germany, The Netherlands, Denmark, Ireland and United Kingdom. Empirical RPs and theoretical RPs are estimated for both recent and future climate conditions.
3. Results
3.1. Clustering and related RPs for NCEP
Time series of windstorm related losses exceeding certain RLs are derived from NCEP data for 21 countries/regions of Europe (40 winters). For Core Europe, the most prominent storm series occurred in winter 1989/1990 (hereafter 1990), with four 1yrl/2yrl events, and two 5yrl events (figure 1(a)). This windstorm series affected almost all individual countries within Core Europe (except Denmark), with at least four 1yrl events (figures 1(b)–(h)), and a maximum of seven 1yrl events for Belgium (figure 1(h)). Other prominent winters are 1984, which mainly affected Denmark and Belgium (figures 1(e), (h)), and 2007, when four storms (2yrl) hit Ireland (figure 1(f)). These and other windstorm series also affected regions outside of Core Europe, e.g. Sweden was hit by four 1yrl events in 2007 and three 2yrl events in 2000, Finland by three 2yrl events in 2002, and Portugal by two 5yrl events in 2010 (cf supplementary C).

Figure 1. Identified number of events per winter for the NCEP data of the period 1973/1974–2012/2013. Colours denote the different return level: light grey 1yrl, dark grey 2yrl and black 5yrl. The indicated years correspond to the second year, for example 1990 indicates the winter 1989/1990. The regions are (a) Core Europe (b) France (c) Germany (d) United Kingdom (e) Denmark (f) Ireland (g) The Netherlands and (h) Belgium.
Download figure:
Standard image High-resolution imageConsidering the five most prominent windstorm series (winters 1984, 1990, 2000, 2002, 2007), the maximum event numbers are typically four 1yrl events, three 2yrl events and two 5yrl events (cf figure 1; supplementary C). Further, several Core Europe countries were hit by three 1yrl events and two 2yrl events. Therefore, focus is given hereafter to such windstorm series (3 or more (3+) 1yrl events, 2+ 2yrl events, 2+ 5yrl events). Time series per winter (figure 1, supplementary C) provide the basis for the estimation of empirical RPs at different RLs and for the assessment of clustering. The empirical RPs are compared to theoretical estimated RPs. The coherence between the top 40 event lists (1yrl) for Core Europe and individual countries/regions are analysed to verify whether the same events hit multiple countries and whether results for different regions are correlated (supplementary D). Many of the top events for individual Core Europe countries are included in the top 40 for Core Europe (figure 2, colours). Best agreement is found for Germany, where 26 of the 40 1yrl events (65%) agree with Core Europe (figure 2(a)). Good accordance is also found for The Netherlands (57.5%) and United Kingdom (55%), while less coherence is found for Belgium (47.5%), France (37.5%), Denmark and Ireland (both 30%, figure 2(a)). For higher RLs results are less tight: Germany and The Netherlands feature more than 50% accordance with Core Europe for all three RLs. For the United Kingdom, a decreasing concurrence with increasing RL is found (figures 2(a)–(c)). These results reflect the typical tracks of strong cyclones affecting Core Europe, which often first hit the United Kingdom and then cross the North Sea either towards Germany or Scandinavia (e.g. Hanley and Caballero 2012).
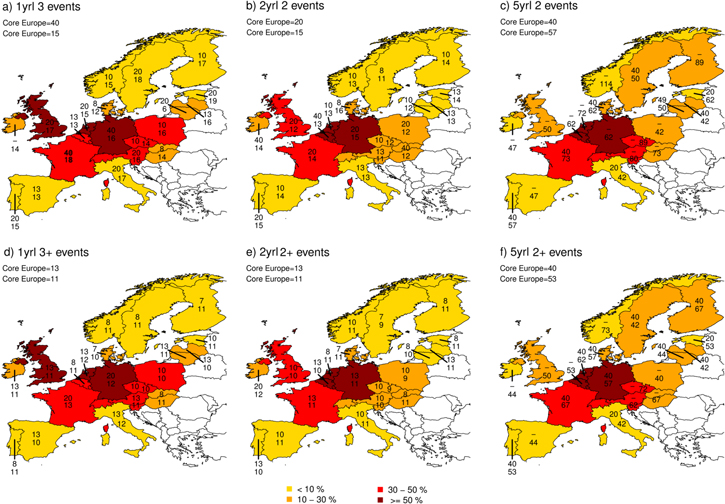
Figure 2. Analysed regions for different return levels and number of events. Colours denote the percentage of events with different return levels that hit Core Europe and the respective region (in %). Yellow: <10%; orange: 10–30%; red: 30–50%; dark red: >50%. Numbers denote the empirical RPs based on NCEP (upper number) and GCM (lower number). The return level and number of events are (a) for 1yrl with three events (b) for 2yrl considering two events (c) for 5yrl and two events (d) for 1yrl with three or more events (3+; accumulated) (e) 2yrl considering two or more events (2+; accumulated) (f) 5yrl considering two or more events (2+; accumulated).
Download figure:
Standard image High-resolution imageThe empirical RPs for Core Europe and individual countries based on NCEP are indicated as upper numbers in figure 2. Figures 2(a)–(c) includes the values for an exact number of events (e.g. 3 events per winter), and figures 2(d)–(f) values are for accumulated probabilities (e.g. 3+ events per winter). Differences of the estimates for the RPs between the two rows are as expected: RPs for accumulated events (e.g. 3+) are shorter than for an exact number of events, as the probability of the accumulated events is higher (cf also supplementary E for Core Europe).
A detailed overview for storm series affecting Core Europe as derived for NCEP is given in table 1 for accumulated likelihoods. For example, a storm series with 4+ 1yrl events occurred twice in 40 years (table 1; numN = 2), while four 2yrl events and two 5yrl events per winter appeared once (table 1; numN = 1). Positive ψ-values (table 1, tRPN column) of 0.19 (1yrl), 0.04 (2yrl), and 0.1 (5yrl) indicate statistically significant serial clustering at the 95% confidence level (Pearson's Chi-square test; cf details in supplementary I) for each RL. Independent from the RL, estimated RPs are similar for empirically (eRPN) and theoretically (tRPN) estimates when considering few events per winter (cp. eRPN with tRPN columns). If e.g. all years have either zero or one occurrence, no overdispersion is found, and thus theoretical RPs cannot be estimated ('-' in table 1). The uncertainty estimates for tRPN are calculated with the Gaussian error propagation based on the standard error. Differences between eRPN and tRPN for a large number of events per winter can be explained by the length of the investigated time series: for eRPN, the possible maximum estimate is 40 years, as the dataset consists only of 40 winters, while for tRPN, the theoretical fit may estimate RPs which are nominally larger than the length of the dataset.
Table 1. Estimates for accumulated probabilities for Core Europe for 1, 2 and 5 year return levels for NCEP (index N), GCM data considering a fixed return level (index RL) and a fixed 20C LI threshold (index LI). The RPs are assessed empirically (eRP) and theoretically (tRP) with uncertainty estimates using the Gaussian error propagation. Additionally the ψ-values are listed. For NCEP 40 winters are considered, for GCM 800 winters, respectively. tRPs estimates longer than 500 years are abbreviated as 500+. Bold and italic: significant shorter estimates compared to the natural climate variability.
| Number of events | numN | num20C | numRL | numLI | eRPN | eRP20C | eRPRL | eRPLI | tRPN | tRP20C | tRPRL | tRPLI | ||||
|---|---|---|---|---|---|---|---|---|---|---|---|---|---|---|---|---|
| 1yrl | — | — | — | — | — | — | — | — | — | ψ = 0.19 | ψ = 0.24 | ψ = 0.20 | ψ = 0.31 | |||
| Events per winter | 1+ | 24 | 475 | 479 | 581 | 1.67 | 1.68 | 1.67 | 1.38 | 1.66 ± 0.12 | 1.69 ± 0.11 | 1.64 ± 0.10 | 1.39 ± 0.62 | |||
| 2+ | 11 | 219 | 212 | 333 | 3.6 | 3.7 | 3.8 | 2.4 | 3.8 ± 0.7 | 3.8 ± 0.6 | 3.8 ± 0.5 | 2.5 ± 1 | ||||
| 3+ | 3 | 76 | 75 | 145 | 13 | 11 | 11 | 6 | 11 ± 3 | 10 ± 2 | 11 ± 3 | 5 ± 5 | ||||
| 4+ | 2 | 21 | 25 | 60 | 20 | 38 | 32 | 13 | 34 ± 15 | 31 ± 10 | 38 ± 12 | 12 ± 12 | ||||
| 5+ | — | 6 | 9 | 25 | — | 133 | 89 | 32 | 119 ± 69 | 100 ± 41 | 146 ± 61 | 31 ± 31 | ||||
| 6+ | — | 3 | — | 8 | — | 267 | — | 100 | 455 ± 322 | 346 ± 172 | 500+ | 83 ± 83 | ||||
| 7+ | — | — | — | 2 | — | — | — | 400 | 500+ | 500+ | 500+ | 236 ± 236 | ||||
| 8+ | — | — | — | 1 | — | — | — | 800 | 500+ | 500+ | 500+ | 500+ | ||||
| 9+ | — | — | — | 1 | — | — | — | 800 | 500+ | 500+ | 500+ | 500+ | ||||
| 2yrl | — | — | — | — | — | — | — | — | — | ψ = 0.04 | ψ = 0.09 | ψ = 0.21 | ψ = 0.3 | |||
| Events per winter | 1+ | 15 | 303 | 295 | 417 | 2.7 | 2.6 | 2.7 | 1.9 | 2.6 ± 0.7 | 2.9 ± 0.3 | 3.1 ± 0.2 | 2.0 ± 0.2 | |||
| 2+ | 3 | 73 | 88 | 171 | 13 | 11 | 9 | 5 | 11 ± 7 | 9 ± 2 | 9 ± 1 | 5 ± 3 | ||||
| 3+ | 1 | 21 | 14 | 47 | 40 | 38 | 57 | 17 | 60 ± 60 | 29 ± 10 | 25 ± 5 | 14 ± 14 | ||||
| 4+ | 1 | 1 | 3 | 9 | 40 | 800 | 267 | 89 | 409 ± 409 | 95 ± 41 | 72 ± 17 | 45 ± 45 | ||||
| 5+ | — | 1 | — | 3 | — | 800 | — | 267 | 500+ | 310 ± 169 | 202 ± 60 | 149 ± 149 | ||||
| 6+ | — | 1 | — | — | — | 800 | — | — | 500+ | 500+ | 500+ | 500+ | ||||
| 5yrl | — | — | — | — | — | — | — | — | — | ψ = 0.10 | ψ = 0.02 | ψ = 0.04 | ψ = − | |||
| Events per winter | 1+ | 7 | 144 | 143 | 250 | 5.7 | 5.6 | 5.6 | 3.2 | 5.8 ± 0.2 | 6 ± 0.9 | 6.1 ± 0.8 | — | |||
| 2+ | 1 | 15 | 16 | 56 | 40 | 53 | 50 | 14 | 43 ± 3 | 37 ± 11 | 34 ± 9 | — | ||||
| 3+ | — | 1 | 1 | 8 | — | 800 | 800 | 100 | 353 ± 37 | 229 ± 105 | 187 ± 75 | — | ||||
| 4+ | — | — | — | 2 | — | — | — | 400 | 500+ | 500+ | 500+ | — | ||||
3.2. Clustering and related RPs for GCM data under recent climate conditions
GCM data is now considered to enhance the RP estimates for the storm series. With 20 ensemble members, more robust statistics can be obtained from these GCM simulations than from the NCEP data. As expected, the maximum number of events per winter is larger in the GCM dataset, with up to six events per winter for 1yrl (e.g. table 1). This was expected, as the GCM dataset consists of 800 winters and not only 40 winters, and thus may include rarer storm series. Moreover, GCMs tend to overestimate both the westerly flow over the North Atlantic (e.g. Sillmann and Croci-Maspoli 2009) and the clustering of cyclones over the Eastern North Atlantic (Pinto et al 2013). A correction of the GCM bias on clustering is possible and was attempted in Karremann et al (2014) using weather type frequencies, but only a small influence on the estimated RPs was found. Hence, biases are neglected and the uncorrected GCM data are used for further analysis.
Comparing the empirical results based on GCM data (eRP20C) and NCEP data (eRPN) for Core Europe, some discrepancies are found, particularly for higher numbers of events (see table 1, eRPN versus eRP20C). As for NCEP, significant overdispersion is identified for the GCM for all RLs. Both NCEP and GCM show similar ψ-values for 1yrl (ψ = 0.19 versus ψ = 0.24, respectively) and 2yrl events (ψ = 0.04 versus ψ20C = 0.09, respectively), but less agreement for 5yrl (ψ = 0.1 versus ψ = 0.02; table 1). For accumulated probabilities (numbers in figures 2(d)–(f), differences in RPs between NCEP and GCM for individual countries are typically smaller than for exact number of events (figures 2(a)–(c)). As the accumulated probabilities are of higher interest for the insurance industry, in the following focus is given only to accumulated results. Although the input data slightly differs (wind and wimax, see section 2), the theoretical RPs for NCEP and GCM are also mostly similar (cf table 1, supplementary E). This result is in line with previous studies comparing results of the storm loss model (Pinto et al 2007), which found only small differences for NCEP and GCM. The empirical RPs outside Core Europe show also good agreements between NCEP and GCM for almost all countries (figures 2(d)–(f)). The spread between both datasets increases for 2yrl with a rising number of events per winter (supplementary E).
The main advantage of considering the larger GCM data is in fact the reduction of the range of confidence intervals and the possibility to estimate longer RPs (table 1, right columns; Karremann et al 2014). As for NCEP data (section 3.1), substantial differences between the empirical and theoretical estimates are sometimes found for rarer storm series (e.g. 2yrl, 4+ events). This indicates that using the negative binominal distribution may not be in these cases the best fit to the empirical data. Nevertheless, possible future changes of RPs of storm series are analysed both theoretically and empirically in the next section. The advantage of estimations based on the empirical data is that all winters with multiple independent intense loss events are considered and not only winters with serial clustering events.
3.3. Future changes of clustering and related RPs
Possible changes of clustering and associated RPs in a changing climate are determined by comparing the two periods 2060–2100 and 1960–2000. Results for Core Europe are presented in table 1. 1yrl, 2yrl, and 5yrl (800, 400 and 160 events in 800 winters GCM data, respectively) are compared theoretically (tRP20C versus tRPRL with a fixed RL in 2060–2100). While the ψ-values for 2yrl and 5yrl increase, a slight decrease is found for 1yrl events. This indicates an increase of clustering for strong events in a future climate, while weaker events may cluster less. Additionally to this perspective with a fixed RL (tRPRL), future changes relative to a fixed 20C LI threshold (tRPLI) are also considered. The former approach RPRL enables the identification of shifts towards more/less clustering of the top 160, 400 or 800 events (i.e., top events more/less concentrated in single years, as total number is fixed). The latter approach tRPLI detects the combined effect of clustering and possible shifts in rankings of intense losses under future climate conditions (see Pinto et al 2012). In fact, Pinto et al (2012) identified a significant positive change in the rankings of storms for most European countries in the A1B scenario (cf their figures 4, 7(b)). Such a perspective is quite important e.g. for insurance companies. For example, a 5yrl corresponds per definition to 160 events in 800 years in GCM data for 20C, while for a fixed 20C LI threshold a total of 316 events in 2060–2010 exceed the present 20C RL for Core Europe.
For Core Europe, derived changes in tRPRL are small if few events per winter are considered (table 1, tRP20C versus tRPRL). For more prominent storm series, differences between the two periods are larger (longer RPs for 1yrl, shorter RPs for 2yrl and 5yrl). For individual Core European countries, theoretical estimates of changes for fixed RLs (tRPRL) are mostly coherent between RLs and number of events (figures 3(a)–(c)). For 1yrl and 3+ events, shorter RPs are estimated, except from Benelux and Ireland (figure 3(a)). Further, decreasing RPs are found for the Mediterranean area, Sweden, Lithuania, Latvia, AUTCHESVN and HUNSVK, while longer RPs are identified for Norway, Finland, Estonia, Poland and the Czech Republic. For 2yrl and 2+ events, results are similar: For Core Europe, reduced clustering (longer RPs) is found for Belgium, while for other countries shorter RPs are identified (figure 3(b)). Differences between the 1yrl and the 2yrl are identified only for Sweden and Italy (shorter 1yrl RPs and longer 2yrl RPs; see figures 3(a), (b)). At the 5yrl and 2+ events, theoretical estimations are not possible for most countries. Significances between the estimated RPs were computed with the Kolmogorov–Smirnov test for the whole distributions (supplementary I), but all RP changes are not statistically significant at the 95% confidence level. For the different RLs, ψ-value changes (supplementary F) are in line with RP changes.

Figure 3. Future changes (2060–2100 minus 1960–2000) of RPs for storm series based on the accumulated events for single regions. Dark blue: increase of more than 1 year. Blue: increase of 0–1 year. Dark red: decrease of more than 1 year. Red: decrease of 0–1 year. Numbers denote the RP for 20C (upper number) and A1B (lower number). In italic and bold: changes, which are significant shorter compared to the natural climate variability. Bold and underlined: changes, which are significant longer compared to the natural climate variability. (a)–(c) RP changes estimated theoretically with a fixed RL (tRPRL). (d)–(f) RP changes estimated empirically with a fixed RL (eRPRL). (g)–(i) RP changes estimated empirically with a fixed 20C LI threshold (eRPLI). For grey regions at least in one of the analysed periods no clustering is found. For more details see text.
Download figure:
Standard image High-resolution image
The future changes of empirical RPs with a fixed RL (eRPRL, figures 3(d)–(f)) are in most cases similar to those obtained theoretically (figures 3(a)–(c)). However, distinctions between empirical and theoretical RPs are found for some countries. Such differences may occur as the theoretical fit is performed for the whole spectrum of occurrences at a certain RL, while the empirical method only considers a certain number of events per winter. Moreover, estimates for eRPRL are always possible, unlike tRPRL (cf figures 3(c), (f)). Opposite tendencies at the 1yrl are found for Sweden, Finland, Estonia, AUTCHESVN, HUNSVK and The Netherlands (cf figures 3(a), (d)). For the 2yrl, differences only remain for Sweden, AUTCHESVN and France (cf figures 3(b), (e)). For 5yrl and 2+ events shorter RPs are found for most Core Europe countries except for Denmark and Ireland (figure 3(f)). Again, all RP changes are not significant at the 95% confidence level (Kolmogorov–Smirnov test). Generally, all regions with divergent tendencies between the two methods show in fact only marginal RP changes between present and future climate conditions (less than 1 year, supplementary F).
A much more homogeneous pattern of change is found for empirical RPs using fixed 20C LI as threshold (eRPLI, figures 3(g)–(i)). For Core Europe and most individual European countries, the RPs now clearly decrease for the three shown RL. Only for Spain (1yrl and 2yrl), Portugal (2yrl), and Italy (1yrl, 2yrl, and 5yrl) longer RPs are found. Changes estimated theoretically (tRPLI) are similar (supplementary G). These identified differences are significant for Denmark (2yrl), Estonia (1yrl), and Latvia (1yrl) at the 95% significance level (Kolmogorov–Smirnov test). Detailed information on each country can be found in supplementary F.
In order to gain more insight on the possible changes of RPs due to climate change, the above results are also compared with RP estimates taken from the 505 year long pre-industrial run with constant forcing. This long run permits a quantification of natural inter-decadal climate variability (see, International ad hoc Detection and Attribution Group (IDAG) 2005 for a review), which we define as the range of RPs between the 5th and the 95th percentile for the whole run. These ranges are included in the tables of supplementary E and F (5% PRE, 95% PRE columns both for theoretical and empirical RPs). RP estimates outside of this range indicate significant differences to the pre-industrial climate variability and are marked in bold in these tables. A careful analysis of the data indicates that while estimates at the 1yrl for tRP20C and tRPRL are mostly within the 5th and 95th range of the control run, this is rarely the case for tRPLI estimates. Moreover, while the deviations between PRE and tRP20C as well as tRPRL for high intense series (2yrl, 5yrl; figures 3(b), (c), underlined numbers) are predominantly towards longer RPs, the significant changes for tRPLI are almost always towards shorter RPs (except some Southern European countries, supplementary E and F). Considering the empirical RPs, results are similar but differences between eRPRL and eRPLI are clearer: while for eRP20C and eRPRL almost all estimates are within the 5th and 95th range of the PRE run (figures 3(d)–(f) and supplementary E and F), the eRPLI estimates are often outside this range, displaying shorter RPs for most countries except Southern Europe (figures 3(g)–(i) and supplementary E and F). Therefore, we conclude that the changes identified here for RPRL are mostly probably also within the range of natural climate variability. On the other hand, results for RPLI clearly show shorter RPs, which are mostly outside the range of natural climate variability, as a consequence of the combined effect of changes in clustering and shifts in ranking of top losses.
4. Summary
The main focus of this study is to estimate possible changes in clustering of potential losses associated with windstorms affecting Europe in a changing climate. In particular, possible alterations of RPs of storm series at different RLs are analysed. 40 winters of NCEP data are used as basis to identify historical storm series. Further, GCM ensembles for recent and future climate conditions (20C and A1B scenarios; each 800 years) are considered. Time series of top events (1yrl, 2yrl or 5yrl) are used to estimate RPs associated with multiple events per winter empirically or theoretically (negative binomial distribution). In line with previous results for Germany (Karremann et al 2014), overdispersion (clustering) is found for most European countries, and RPs based on NCEP and GCM data are similar for current climate conditions.
Future changes of RPs are estimated for fixed RLs and fixed 20C LI thresholds. The latter approach combines the effect of clustering and of possible shifts in event ranking in a changing climate, and is thus of particular interest for risk assessment. While changes are small and rather heterogeneous when considering fixed RLs, they are larger and homogeneous for fixed 20C LI thresholds, with clearly shorter RPs for almost all countries except Southern Europe. However, only very few changes are statistical significant. RP estimates were also tested against the (pre-industrial) natural climate variability. In this case, RP estimates for future climate with fixed 20C LI thresholds typically show shorter RPs for most Central and Northern European countries. These RPs are mostly outside the 5th and 95th percentile range of variability of a pre-industrial control run, and thus they are beyond the range of natural climate variability. This is not the case for most eRP20C and eRPRL.
5. Discussion and conclusions
Recent results by Pinto et al (2013) using the same GCM ensemble suggested that clustering of cyclones affecting Europe may change under future climate conditions, pointing to a decrease over the North Sea area (corresponding to longer RPs) and an increase for Scandinavia (shorter RPs). These results are sometimes partly in contrast with those obtained here for losses associated with extreme cyclones, particularly for 2yrl and 5yrl. These differences may be attributed to two main factors: first, the number of (cyclone) events considered in Pinto et al (2013) is much larger (typically about 10 events per year) than the number of loss events analysed here (one event per 1, 2, or 5 years). In fact, the conclusions of Pinto et al (2013) are rather in line with present results for lower RLs (1yrl) for Core Europe. Second, climate change signals between events regarding only the meteorological intensity (not considering the population density, MI) and loss events (additionally considering the population density, LI) may show a considerable spread (see discussion on MI and LI in Pinto et al 2012). Thus, at least a part of the identified differences may be attributed to the different thresholds concerning the extremes and the different target variables.
While the results for fixed RLs are quite heterogeneous, the changes of RPs are more pronounced for a fixed 20C LI threshold, showing clearly shorter RPs for all countries (except for Mediterranean region). This difference can be explained by the fact that the latter approach also considers the effect of changes of ranks for loss events. This result is in line e.g. with Della-Marta and Pinto (2009), who identified a shortening of return period for intense storms over the North Sea area during the 21st century, documenting a shift of the main storm track area towards the densely populated area of Central Europe. Furthermore, Pinto et al (2012) provided evidence that these changes in intense cyclones lead to an increase of top losses over Western Europe and shorter RPs of potential losses. As a consequence, more events exceeding a fixed LI are identified in the second half of the 21st century (e.g. 316 events in A1B instead of 160 in 20C, 5yrl), thus leading to increased clustering and shorter RPs for storm series.
In this study we have used a large ensemble of only one GCM, which is motivated by the focus on statistical robustness of the results rather than on inter-model sensitivity. Further, the changes of synoptic activity in this GCM are close to the CMIP3 ensemble average (Ulbrich et al 2008). Hence it can be expected that our results are probably representative for a CMIP3 multi-model ensemble. Future work should focus on earth system models (ESMs) of the CMIP5 ensemble. ESMs incorporate enhanced spatial resolution and additional components of the climate system, which may result in a better representation of mechanisms leading to the clustering of storms. This will also permit a better estimate of the statistical significance of results based on such large multi-model ensembles, to provide more robust estimates of possible changes of cumulative risks associated with windstorm series affecting Europe.
Acknowledgments
We acknowledge the National Centres for Environmental Prediction/National Centre for Atmospheric Research for the NCEP reanalysis data. We thank the MPI for Meteorology (Hamburg, Germany) and Andreas Sterl from the KNMI (De Bilt, The Netherlands) for providing GCM data. We also thank the Centre for International Earth Science Information Network (CIESIN), Columbia University; and Centro de Agricultura Tropical (CIAT) providing the Gridded population of the World Version3 (GPWv3): Population density grids. Palisades, NY: Socioeconomic Data and Applications Centre (SEDAC), Columbia University. Available online under the following weblink: http://sedac.ciesin.columbia.edu/gpw (date of download: 5.4.2012). Furthermore we thank the CRAN-R-project for providing the open-source software package R: R Development Core Team (2011). R: A language and environment for statistical computing. R foundation for statistical computing, Vienna, Austria. ISBN 3-900051-07-0, URL http://www.R-project.org/.