

Abstract
Glacier ecosystems are a significant source of bioavailable, yet ancient dissolved organic carbon (DOC). Characterizing DOC in Mendenhall Glacier outflow (southeast Alaska) we document a seasonal persistence to the radiocarbon-depleted signature of DOC, highlighting ancient DOC as a ubiquitous feature of glacier outflow. We observed no systematic depletion in Δ14C-DOC with increasing discharge during the melt season that would suggest mobilization of an aged subglacial carbon store. However, DOC concentration, δ13C-DOC, Δ14C-DOC and fluorescence signatures appear to have been influenced by runoff from vegetated hillslopes above the glacier during onset and senescence of melt. In the peak glacier melt period, the Δ14C-DOC of stream samples at the outflow (−181.7 to −355.3‰) was comparable to the Δ14C-DOC for snow samples from the accumulation zone (−207.2 to −390.9‰), suggesting that ancient DOC from the glacier surface is exported in glacier runoff. The pre-aged DOC in glacier snow and runoff is consistent with contributions from fossil fuel combustion sources similar to those documented previously in ice cores and thus provides evidence for anthropogenic perturbation of the carbon cycle. Overall, our results emphasize the need to further characterize DOC inputs to glacier ecosystems, particularly in light of predicted changes in glacier mass and runoff in the coming century.
Export citation and abstract BibTeX RIS

Content from this work may be used under the terms of the Creative Commons Attribution 3.0 licence. Any further distribution of this work must maintain attribution to the author(s) and the title of the work, journal citation and DOI.
1. Introduction
Glacier ecosystems cover approximately 10% of the Earth's surface and contribute large volumes of runoff to rivers and the coastal ocean. The large water flux from glacier watersheds in coastal and high-latitude regions can lead to a substantial watershed flux of dissolved organic matter (DOM) despite the typically low concentrations of dissolved organic carbon (DOC) reported for glacier ecosystems (Hood and Scott 2008, Hood et al 2009, Bhatia et al 2013). Recent studies have also shown that glacier DOC is biologically available and therefore provides a subsidy of bioavailabile carbon to receiving streams, estuaries and coastal systems (Hood et al 2009, Fellman et al 2010, Singer et al 2012). The ongoing loss of glacier ice occurring in many regions of the world (Radic and Hock 2011, Gardner et al 2013) has the potential to shift the timing and magnitude of freshwater and highly bioavailabile DOM delivered to downstream environments. Therefore, glacier environments can be important drivers of regional biogeochemical change and these ecosystems will increase in importance over the coming decades in areas where glacial water fluxes and DOM are increasing with climate warming. As a result, it is fundamentally important to develop an understanding of the source, cycling and export of DOM from glacier ecosystems.
The origin of DOM in glacier ecosystems has been attributed to a range of sources including: supra and subglacial biological processes, subglacial organic matter, and deposition of aerosols containing soil organic matter and fossil fuel combustion byproducts (Hodson et al 2008, Bhatia et al 2010, Singer et al 2012, Stibal et al 2008, 2012, Stubbins et al 2012). Although the seasonal evolution of glacier hydrologic systems is generally well understood (Hubbard and Nienow 1997, Nienow et al 1998, Skidmore and Sharp 1999), the way in which potential sources of DOM interact with the glacier hydrologic system to control DOM export remains uncertain, primarily because of a lack of seasonally extensive data linking glacier discharge to the chemical characteristics of DOM in glacial outflow. Glacier-derived DOC has been shown to be radiocarbon (14C) depleted in temporally discrete samples at a range of sites in Greenland, the European Alps and North America (Hood et al 2009, Singer et al 2012, Stubbins et al 2012, Bhatia et al 2013). The depleted radiocarbon values in glacial DOC indicate glacier ecosystems contain ancient organic matter that is accessible for hydrological export during the melt season. However, the overall importance on an annual basis of this ancient organic matter pool for glacial DOM fluxes is unclear given that the relative contribution of different DOM sources to glacier runoff is likely to change by season due to changes in flow paths, temperature variations and light levels (Hodson et al 2008, Stibal et al 2012). A number of glacier export studies have documented seasonal variability in DOM character and source (Barker et al 2009, Bhatia et al 2013). In this study, we evaluated how the DOC concentration and chemical and isotopic characteristics of DOM shifted with development of the glacier hydrologic system at Mendenhall Glacier in southeast Alaska. Glacier outflow samples were collected across a full glacier runoff season to elucidate how the evolution of flow paths on and within the glacier influences the concentration and character of DOM accessible for hydrological export.
2. Study site and methods
Mendenhall Glacier is a major outflow glacier from the 3800 km2 Juneau Icefield, which mantles the northern Coast Range in the Alaska panhandle (USA) and is representative of glacial systems found throughout the Gulf of Alaska. The glacier terminates just above sea level, and over the last two decades, the glacier has thinned at an average of 1.4 m yr−1 over its entire volume (Larsen et al 2007). The Mendenhall Glacier outflow drains a 155 km2 watershed of which 128 km2 (83%) is covered with ice. The remaining watershed area (17%) consists of bedrock outcrops and alpine tundra as well as extensive forested hillslopes above the lower 5 km of the glacier.
For the mid-May to late October study period, the mean air temperature at a National Weather Service climate station 4 km from the Mendenhall Glacier terminus was 9.6 °C and rainfall totaled 131 cm, the majority (99 cm) of which fell between August and October. Daily discharge at the Mendenhall Glacier outflow was calculated using data from the USGS stream gauge (#15052500) on the Mendenhall River (220 km2) immediately downstream of pro-glacial Mendenhall Lake. In order to calculate daily discharge at the Mendenhall Glacier outflow, estimated daily runoff for the watershed portion below the glacier outflow (65 km2) was subtracted from the daily gage data on Mendenhall River to estimate discharge at the glacier outflow.
Glacier outflow samples at the terminus were collected approximately weekly from mid-May 2011 through late October 2011 (n = 25) encompassing the glacier discharge season. Specific conductivity was measured in the field with a YSI 556 multi-probe unit. All samples were field-filtered through precleaned (acid and Milli-Q rinsed) 0.45 μm capsule filters (Pall AquaPrep 600) into precleaned (acid and Milli-Q rinsed) high-density polyethylene plasticware. In addition, three snow samples were collected in May 2011 approximately 50 m apart from one another from the accumulation zone of the Mendenhall Glacier. For each snow sample a 1 m pit was dug and four depth-integrated samples were collected and combined for a water yield of approximately 1 L. These snow samples were returned to the laboratory and thawed in the refrigerator before filtration, as described for the glacier outflow samples.
Samples for DOC concentration were measured via a Shimadzu TOC-V CSH analyzer using established protocols (Fellman et al 2010). Fluorescence excitation-emission matrices (EEMs) of DOM were undertaken within 24 h of sample collection on a Horiba FluoroMax-4 and parallel factor analysis (PARAFAC) was used to analyze EEMs using the methods described by Fellman et al (2010). PARAFAC was conducted with MATLAB using the PLS_toolbox version 3.7 and the final PARAFAC model was selected using a split half analysis following the procedures of Stedmon et al (2003). Using this approach, we determined that a five component model, with four humic-like components and one protein-like component, was the best fit for the data. The data array used in the model consisted of 160 EEMs with 151 emission and 43 excitation wavelengths. Because of our limited number of sample EEMs (n = 25), we added these additional EEMs to incorporate environmental variability and improve our ability to resolve differences in DOM fluorescence between sample dates. The additional EEMs were from water collected from various glacial-fed and non-glacial streams in southeast Alaska using identical sample collection and processing techniques as those included in this study.
The percent contribution of protein-like fluorescence was determined for each EEM by quantifying the contribution of each component and dividing that by the total fluorescence of all the modeled PARAFAC components. We focused our analysis on protein-like fluorescence rather than all five PARAFAC components because it is often the dominant fluorescence component in glacial meltwater (e.g., Barker et al 2009, Hood et al 2009, Dubnick et al 2010). Therefore, it is a particularly useful tracer for identifying glacial contributions of organic matter to stream DOM pools and how they change seasonally. The five PARAFAC components were similar to those of other studies in freshwater and glacial environments (Stedmon and Markager 2005, Jaffe et al 2008, Barker et al 2009, Dubnick et al 2010). Humic-like component 1 (C1) (Ex = 240 nm, Em = 460 nm) was similar to the ubiquitous humic-like 'peak A' as initially defined in Coble (1996). Humic-like C2 (Ex = 240 nm, Em = 420 nm) and C3 (Ex = 280 nm, Em = 494 nm) have not been traditionally defined, but humic-like C4 (Ex = 340 nm, Em = 440 nm) was similar to 'peak C' in the visible region Coble (1996). Protein-like C5 (Ex = 270 nm, Em = 346 nm) has spectral characteristics that strongly resemble the reference standard of tryptophan and commonly dominates the fluorescence spectra in glacial environments (Barker et al 2006, Dubnick et al 2010).
δ13C-DOC samples were analyzed using an O.I. Analytical Model 1010 TOC analyzer interfaced to a PDZ Europa 20–20 IRMS (Sercon Ltd) as described in previous studies (Spencer et al 2009). Similarly, Δ14C-DOC was measured as described previously (Raymond 2005). Briefly, post inorganic carbon removal and UV-oxidation of DOC the resultant CO2 was transferred to a vacuum line and cryogenically purified. The purified CO2 was analyzed for Δ14C at the National Ocean Sciences Accelerator Mass Spectrometry Facility at the Woods Hole Oceanographic Institution (USA).
Prior to statistical analyses sample distributions were checked for normality using the Shapiro-Wilk test in R (R Core Team, 2013). Differences in samples between periods were evaluated with a two-tailed t-test, and differences in sample variance were evaluated with an F-test in SPSS (IBM, NY, USA). The threshold for significance was p < 0.05 for all statistical tests.
3. Results and discussion
Discharge from the glacier outflow ranged from 1.2 m3 s−1 during the onset of the summer melt period and post summer melt period, to >300 m3 s−1 during two glacier outburst flood events (Figure 1). For the study period in which samples were collected, mean discharge at the glacier outflow was 47 m3 s−1 (σ = 45 m3 s−1). During the transition periods when glacier runoff was increasing following snowmelt (May to mid-June), or decreasing with the onset of fall snow events (late September to late October) discharge was typically < 40 m3 s−1(figure 1). During the summer glacier melt period discharge was consistently 40 to 100 m3 s−1 except during outburst flood events. Specific conductivity for the Mendenhall outflow ranged from 8.01 to 40.80 (μS cm−1) and was significantly higher (t-test, p < 0.01) during the transition periods (n = 11; mean = 24.80; σ = 7.41 μS cm−1) compared to the melt period (n = 14; mean = 12.64; σ = 4.13 μS cm−1) (figure 2(a); table 1). Specific conductivity was also significantly less variable during the melt period (F-test, p = 0.03). Taken together the relatively lower and more stable values for specific conductivity during the summer melt period suggests that discharge at the Mendenhall terminus is dominated by supraglacial melt water routed through subglacial channels (Tranter et al 1997, Barker et al 2009). The greater variability in specific conductivity and typically higher values at lower water discharge (<40 m3 s−1) during the transition periods likely result from a combination of: (1) slow flow through a distributed drainage system with extended water contact times with large amounts of rock (Tranter et al 1993, 1997) and (2) contributions from non-glacial water sources in the lower reaches of the catchment such as snow melt runoff in the spring, and rainfall runoff, including from vegetated hillslopes, in late summer and fall when the glacier terminus received ~1 m of rainfall.

Figure 1. Mendenhall glacier outflow water discharge for 2011. Gray dots represent sample points during the transition periods, black dots represent sample points during the glacier melt period.
Download figure:
Standard image High-resolution image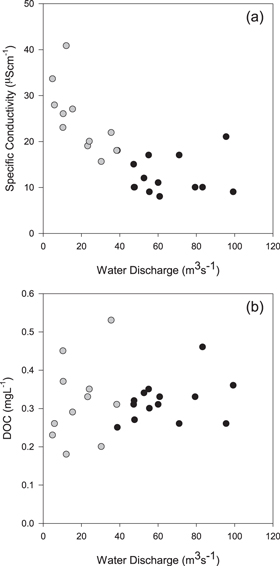
Figure 2. Water discharge at Mendenhall glacier outflow versus (a) specific conductivity, (b) DOC. Gray dots represent sample points during the transition periods, black dots represent sample points during the glacier melt period.
Download figure:
Standard image High-resolution imageTable 1. Mendenhall glacier outflow specific conductivity, DOC concentration, composition and radiocarbon data.
| Transition period | Melt period | |||||||
|---|---|---|---|---|---|---|---|---|
| Mean | σ | Maximum | Minimum | Mean | σ | Maximum | Minimum | |
| Specific Conductivity (μS cm−1) | 24.80 | 7.41 | 40.80 | 15.60 | 12.64 | 4.13 | 21.00 | 8.01 |
| DOC (mg L−1) | 0.32 | 0.11 | 0.53 | 0.18 | 0.32 | 0.05 | 0.46 | 0.25 |
| Protein-like fluorescence (%) | 13.7 | 5.4 | 20.3 | 6.5 | 20.1 | 6.1 | 30.9 | 13.3 |
| δ13C-DOC (‰) | −25.4 | 1.3 | −23.6 | −27.9 | −25.4 | 0.6 | −24.0 | −26.4 |
| Δ14C-DOC (‰) | −206.2 | 91.1 | −100.9 | −353.8 | −279.6 | 66.6 | −181.7 | −355.3 |
| 14C-DOC (ybp) | 1840 | 957 | 3450 | 795 | 2603 | 740 | 3470 | 1550 |
Concentrations of DOC in the glacier outflow were consistently low in both the transition and melt periods and ranged from 0.18 to 0.53 mg L−1 (table 1), which is similar to DOC concentrations in other glacier outflows globally (Barker et al 2006, Singer et al 2012, Bhatia et al 2013). The mean DOC concentration was 0.32 mg L−1 in both transition and melt periods but the transition period samples exhibited a greater range and significantly higher variability compared to those collected during the summer melt period (F-test, p = 0.01; figure 2(b)). The range of DOC concentrations in snow samples collected from the accumulation zone of the Mendenhall glacier during May 2011 (0.16–0.31 mg L−1) overlapped with the range in concentrations at the outflow however the mean was lower (0.22 mg L−1). The elevated DOC concentrations at low flow in the transition period could be due to the accessing of chemically distinct DOC pools by seasonally evolving hydrologic flow paths within the glacier (Bhatia et al 2013). Alternatively the higher DOC concentrations in the transition period may be due to inputs from terrestrial vegetation and soils on forested and tundra hillslopes above the glacier in the lower reaches of the catchment (Lafreniere and Sharp, 2004, Barker et al 2009). These terrestrial inputs would naturally be more discernable at the outflow during the lower flow transition periods compared to the summer melt period when glacier melt is the dominant source of water and DOM to the outflow.
Previous studies have highlighted the dominance of protein-like fluorescence in glacier ecosystems (Lafreniere and Sharp 2004, Hood et al 2009, Dubnick et al 2010). When examining fluorescence EEM's via PARAFAC, the relative proportion of the fluorescent components in the EEM can be divided up into their percentage contribution to assess how much of the overall fluorescence is derived from protein-like components (Fellman et al 2010). Using this approach, the transition periods have a significantly lower contribution (mean = 13.7%) from protein-like components in comparison to the melt period (mean = 20.1%; t-test; p = 0.01; figure 3(a); table 1). During the melt period if supraglacial melt water routed through established subglacial channels is the dominant source of discharge (Tranter et al 1997, Barker et al 2009) this indicates that supraglacial DOM is relatively enriched in protein-like fluorescence as previously described by Stubbins et al (2012). This suggests that the melt period DOM is more bioavailabile than DOM exported during the transition periods as protein-like fluorescence shows a strong positive correlation to DOC bioavailabilty (Fellman et al 2008). Furthermore, it highlights that the transition periods likely have more terrestrial influence (e.g. inputs from vascular plants) as proportionally less protein-like fluorescence has been shown to correlate with declining glacier coverage (and increasing forest coverage) in watersheds in southeast Alaska (Hood et al 2009).

Figure 3. Water discharge at Mendenhall glacier outflow versus (a) protein-like fluorescence, (b) δ13C-DOC, (c) Δ14C-DOC. Gray dots represent sample points during the transition periods, black dots represent sample points during the glacier melt period.
Download figure:
Standard image High-resolution image
Further evidence for terrestrial sources of DOM in the glacier outflow during the transition periods comes from δ13C-DOC and Δ14C-DOC values (figures 3(b)–(c); table 1). During the transition periods, δ13C-DOC ranged from −23.6 to −27.9‰ (mean = −25.4‰, σ = 1.3‰) with the more depleted values comparable to terrestrially dominated freshwaters (ca. −27‰) (Fellman et al 2010, Spencer et al 2012). The transition periods also show the most enriched δ13C-DOC values and significantly greater variability in δ13C-DOC values compared to the melt period (F-test, p < 0.01), suggesting that there is a wider range of streamwater DOM sources during the time when glacier melt inputs are increasing in spring and decreasing in fall. The majority of δ13C-DOC values in the melt period (mean = −25.4‰, σ = 0.6‰) are highly comparable to the δ13C-DOC values for the snow samples (−25.6 to −26.2‰; table 2) implying a common source. Previous work has shown precipitation to have a wide range of δ13C-DOC signatures encompassing the more enriched δ13C-DOC values reported here (Raymond 2005). Therefore, the most enriched values in the transition periods may reflect precipitation inputs. Overall, the δ13C-DOC values are consistent with values reported in previous studies on a variety of glacier ecosystems (Hood et al 2009, Stubbins et al 2012, Bhatia et al 2013) and encompass a range of potential sources including autochthonous production, terrestrial C3 inputs and fossil organic carbon.
Table 2. Mendenhall glacier accumulation zone snow DOC concentration, composition and radiocarbon data.
| Snow 1 | Snow 2 | Snow 3 | |
|---|---|---|---|
| DOC (mg L−1) | 0.31 | 0.19 | 0.16 |
| δ13C-DOC (‰) | −25.9 | −26.2 | −25.6 |
| Δ14C-DOC (‰) | −390.9 | −243.2 | −207.2 |
| 14C-DOC (ybp) | 3920 | 2180 | 1800 |
As observed for δ13C-DOC, the Δ14C-DOC values during the transition period show a greater range and σ than in the melt period (−100.9 to −353.8‰, σ = 91.1‰ versus −181.7 to −355.3‰, σ = 66.6‰ respectively), however this difference in variability between the two periods was not significant. The most modern samples are reported during the transition periods potentially due to a greater proportion of modern terrestrial carbon input in line with observed depletion in δ13C-DOC values and low protein-like fluorescence (figures 3(a), (b); table 1). However, all samples in both the transition and melt periods are aged and the oldest samples are comparable in age in the transition and melt periods (ca. 3450 ybp; table 1). There is also no systematic increase in age with increasing discharge as the melt season progresses that would be consistent with progressive mobilization of an ancient subglacial carbon store with the development of the subglacial hydrological system (Hood et al 2009, Bhatia et al 2013). However, what is apparent is that the Δ14C-DOC values of the snow samples (−207.2 to −390.9; table 2) are consistent with those observed in the glacier outflow, particularly in the melt period. Therefore, it appears that pre-aged DOC is added to the surface of the Mendenhall Glacier as snow through wet and dry deposition as previously suggested for glaciers in western North America and the European Alps (Singer et al 2012, Stubbins et al 2012). In conjunction with other recent studies showing wet deposition of organic carbon with comparable δ13C-DOC and Δ14C-DOC signatures in rainwater and on other glacier surfaces in North America this study highlights that the DOC exported from glacier environments in this part of the world may be driven by depositional processes (Raymond 2005, Stibal et al 2008, Stubbins et al 2012).
The role of glaciers with respect to carbon fluxes to receiving ecosystems is garnering increasing attention in light of the size of the flux, the high bioavailability of the exported DOM and the changes impacting glacier environments. The lack of evidence presented here for mobilization of a subglacial carbon store and addition of pre-aged DOC to the glacier surface point toward depositional processes as the source of DOM for glaciers in the region of this study. Given that DOC originating from fossil fuels has been suggested to be a significant wet depositional flux globally (Jurado et al 2008, Yan and Kim 2012), it is reasonable that some portion of the DOM exported from glacier environments is anthropogenic in origin. Further evidence from ice cores shows a significant contribution of anthropogenic organic carbon sources with the onset of the industrial era (Grannas et al 2006, Jenk et al 2006) providing an insight into anthropogenic perturbation of the carbon cycle. The vegetated watershed area along the lower reaches of the glacier also appeared to impact the DOM exported from the glacier outflow during the low discharge transition periods. The transition periods that we documented are likely to increase in length as glaciers recede and contribute less to summer streamflow. Taken together, our results highlight the need to both characterize and constrain inputs to glacier ecosystems (i.e. snow) and to conduct sampling across the main glacier melt period to determine the dominant source of exported DOM in glacial runoff.
Acknowledgements
This study was supported by NSF DEB (1145932/1146161/1145885/1145313), NSF EAR (0943599), and the DOI Alaska Climate Science Center.