
Abstract
Degrading permafrost can alter ecosystems, damage infrastructure, and release enough carbon dioxide (CO2) and methane (CH4) to influence global climate. The permafrost carbon feedback (PCF) is the amplification of surface warming due to CO2 and CH4 emissions from thawing permafrost. An analysis of available estimates PCF strength and timing indicate 120 ± 85 Gt of carbon emissions from thawing permafrost by 2100. This is equivalent to 5.7 ± 4.0% of total anthropogenic emissions for the Intergovernmental Panel on Climate Change (IPCC) representative concentration pathway (RCP) 8.5 scenario and would increase global temperatures by 0.29 ± 0.21 °C or 7.8 ± 5.7%. For RCP4.5, the scenario closest to the 2 °C warming target for the climate change treaty, the range of cumulative emissions in 2100 from thawing permafrost decreases to between 27 and 100 Gt C with temperature increases between 0.05 and 0.15 °C, but the relative fraction of permafrost to total emissions increases to between 3% and 11%. Any substantial warming results in a committed, long-term carbon release from thawing permafrost with 60% of emissions occurring after 2100, indicating that not accounting for permafrost emissions risks overshooting the 2 °C warming target. Climate projections in the IPCC Fifth Assessment Report (AR5), and any emissions targets based on those projections, do not adequately account for emissions from thawing permafrost and the effects of the PCF on global climate. We recommend the IPCC commission a special assessment focusing on the PCF and its impact on global climate to supplement the AR5 in support of treaty negotiation.
Export citation and abstract BibTeX RIS

Content from this work may be used under the terms of the Creative Commons Attribution 3.0 licence. Any further distribution of this work must maintain attribution to the author(s) and the title of the work, journal citation and DOI.
1. Introduction
Permafrost soils contain ∼1700 gigatonnes (Gt) of carbon in the form of frozen organic matter, nearly twice as much carbon than is currently in the atmosphere (Tarnocai et al 2009). Half of the frozen organic matter lies in the top 3 m of permafrost and the rest is in highly localized deposits that can extend down to 30 m depth (Tarnocai et al 2009). Plant remains and other organic material was buried and frozen into permafrost during or since the last ice age by dust deposition, sedimentation in flood plains and peat development on time scales of decades to millennia (Zimov et al 2006a, 2006b, Schuur et al 2008). Vertical mixing of soil during repeated freeze/thaw cycles accelerated the burial process (Schuur et al 2008). Nearly all the frozen organic matter consists of plant remains (roots, stems and leaves) and partially decayed plant organic material. Decay essentially stops once the soil is frozen, so this organic matter has been preserved, frozen in permafrost, for thousands of years.
The permafrost carbon feedback (PCF) is the amplification of anthropogenic warming due to carbon emissions from thawing permafrost. If temperatures rise and permafrost thaws, the organic material will also thaw and begin to decay, releasing carbon dioxide (CO2) and methane (CH4) into the atmosphere and amplifying the warming due to anthropogenic greenhouse gas emissions (figure 1) (Zimov et al 2006b, Schuur et al 2009, 2013). Thermokarst lakes are especially effective in inducing rapid thaw of permafrost, with subsequent release of substantial amounts of CH4 (Walter et al 2007), which is 33 times more effective a greenhouse gas than CO2 (Shindell et al 2009). The release of CO2 and CH4 from thawing permafrost will amplify global warming due to anthropogenic greenhouse gas emissions and further accelerate permafrost degradation. Warmer conditions and increased atmospheric CO2 will enhance plant growth that will remove some CO2 from the atmosphere (Friedlingstein et al 2006), but this may only partially compensate for the much greater carbon losses from thawing permafrost. The PCF is irreversible on human time scales because in a warming climate, the burial mechanisms described above slow down or stop, so there is no way to convert CO2 into organic matter and freeze it back into the permafrost.

Figure 1. The permafrost carbon feedback (PCF) is an amplification of surface warming due to the thaw of organic material currently frozen in permafrost, which will then decay and release CO2 and CH4 into the atmosphere.
Download figure:
Standard image High-resolution imageThere are few published estimates that quantify CO2 and CH4 emissions from thawing permafrost, making it difficult to evaluate the effects of the PCF on global climate. Here we perform a detailed meta-analysis of currently published projections of future permafrost degradation and associated emissions of CO2 and CH4 to better quantify how the PCF influences global climate. We then evaluate how the PCF influences the negotiations of anthropogenic emissions targets (Schaefer et al 2012).
2. Impacts of thawing permafrost
2.1. Current permafrost status
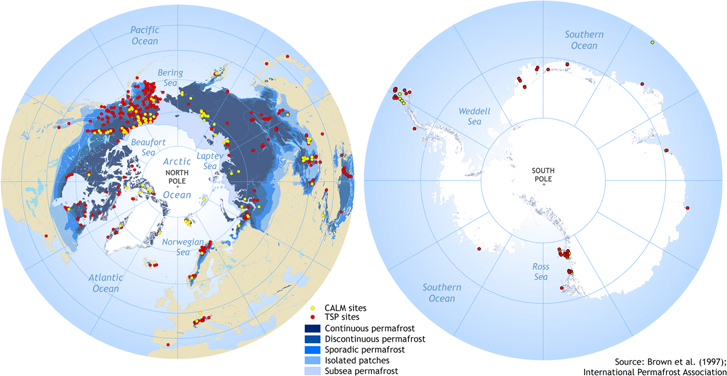
The Global Terrestrial Network for Permafrost (GTN-P) monitors permafrost status and degradation (figure 2). The GTN-P consists of two global networks to monitor permafrost: the thermal state of permafrost (TSP) and the Circumpolar Active Layer Monitoring (CALM) networks. The TSP network measures permafrost temperature at multiple depths at 860 borehole sites (Brown et al 2010, Romanovsky et al 2010a). The CALM network measures active layer thickness (ALT) or maximum annual thaw depth at 260 sites either mechanically using a probe, or electronically with a vertical array of temperature sensors (Brown et al 2000, Streletskiy et al 2008, Shiklomanov et al 2010). Permafrost temperature and ALT were both identified as essential climate variables for monitoring the state of the cryosphere and global climate by the Global Climate Observing System and the Global Terrestrial Observing System. The International Permafrost Association currently coordinates international development and operation of the TSP and CALM networks. Logistical support costs restrict TSP and CALM sites to areas with reasonable access by truck, plane or boat, resulting in a clustering of sites along roads, rivers, and the Arctic coastline. The number of sites in the GTN-P has doubled in the past decade, but coverage is sparse in discontinuous permafrost zones where we expect the greatest permafrost degradation (Anisimov et al 2007).
Figure 2. The Global terrestrial Network for Permafrost (GTN-P) consists of the Circumpolar Active Layer Monitoring (CALM) network, which measures ALT, and the thermal state of permafrost (TSP) network, which measures permafrost temperature.
Download figure:
Standard image High-resolution image
Observations from the TSP network indicate rising permafrost temperatures over the last several decades. Coastal sites show continuous warming since the 1980s and in Alaska this warming trend has propagated south from the Arctic coast towards the Brooks Range, with statistically significant warming in the upper 20 m of permafrost since 2008 (Romanovsky et al 2011, 2012). Northern Russia and Northwest Canada show increases in permafrost temperature similar in magnitude to those in Alaska during the last 30–35 years (Drozdov et al 2008, Oberman 2008, Romanovsky et al 2010b, Smith et al 2010). The same pattern repeats across the Arctic with coastal sites warming faster than more southerly sites (Romanovsky et al 2010a).
Trends in ALT from the CALM network are less conclusive, with some sites showing increases and others showing no trend at all. ALT has increased on the Qinghai-Tibet Plateau and in the Russian European North, but not in West Siberia (Mazhitova 2008, Vasiliev et al 2008, Wu and Zhang 2010, Zhao et al 2010). Although ALT has increased in the Alaskan and Canadian interior, there is no obvious trend near the Arctic coastline (Streletskiy et al 2008, Shiklomanov et al 2010, Smith et al 2009, 2010, Burn and Kokelj 2009). The melting of excess ground ice can produce long-term trends in surface subsidence indicative of permafrost degradation even if the observed ALT show no consistent trends (Liu et al 2010, 2012, Shiklomanov et al 2013).
2.2. Permafrost in the future
Permafrost degradation in response to warming starts with increases in ALT followed by talik formation. As temperatures rise, the simulated ALT increases and eventually, the active layer becomes too deep to completely refreeze during winter, forming a talik (Sazonova et al 2004, Schaefer et al 2011). The southern margins of northern hemisphere permafrost regions have the warmest permafrost and will see the greatest talik formation (Zhang et al 2008b). Eventually, the permafrost will become patchy and then disappear, and the boundaries of continuous and discontinuous permafrost will move north. Although near-surface permafrost in the top few meters of soil may disappear, deeper permafrost may persist for many years or even centuries. Over time the remaining permafrost will contract around the coldest regions in the Northern hemisphere, Northern Siberia and the islands of Northeast Canada, where the permafrost is most resistant to thaw.
Projections indicate ALT will increase and the areal extent of near-surface permafrost will decrease, but show a wide range in projected permafrost degradation. Table 1 shows projections of permafrost degradation for various future emissions scenarios defined for the Intergovernmental Panel on Climate Change (IPCC) Fourth Assessment Report (AR4) and Fifth Assessment Report (AR5). Studies highlighted in bold also included estimates of PCF strength and timing (see table 2 below). The current simulated permafrost area varied by a factor of two between models and the mean loss of permafrost area by 2100 was 52 ± 23%. Much of the spread in estimated permafrost degradation resulted from assuming different emissions scenarios and associated warming, but even models assuming the same scenario show a large spread in projected permafrost degradation.
Table 1. Predicted permafrost degradation by 2100 arranged in order of increasing loss of permafrost area.
| Study | Decrease in permafrost area (%) | Initial permafrost area (×106 km2) | 2100 permafrost area (×106 km2) | Increase in active layer (cm) | IPCC scenario | Domain |
|---|---|---|---|---|---|---|
| Zhang et al (2008b) | 17.4 ± 1.5 | na | na | 190–500 | A2 | Canada |
| Zhang et al (2008a) | 20.5–24.0 | na | na | 30–80 | A2 | Canada |
| Euskirchen et al (2006) | 26 ± 1 |
21.7 | 16.1 ± 0.2 | na | A1B | No. hem. |
| Koven et al ( 2011 ) | 30 | 14 | 9.8 | 30–60 |
A2 | No. hem. |
| Schaefer et al ( 2011 ) | 30 ± 10 | 12.5 | 7.6 ± 1.3 | 56–92 | A1B | No. hem. |
| Koven et al (2013) | 32 ± 45 |
14.4 | 8.9 ± 6.5 | na | RCP8.5 | No. hem. |
| Marchenko et al (2008) | 53 |
1.3 | 0.6 | 162b | A1B | Alaska |
| Schuur et al ( 2013 ) | 55 ± 5 |
15.3 | 6.9 ± 0.8 | na | RCP8.5 | No. hem. |
| MacDougall et al ( 2012 ) | 56 ± 3 | 15.8 | 7 ± 0.5 | na | RCP8.5 | Global |
| Schneider von Deimling et al ( 2012 ) | 57 ± 20 | na | na | na | RCP8.5 | No. hem. |
| Saito et al (2007) | 60 | 18.1 | 7.3 | 50–300 | A1B | No. hem. |
| Burke et al ( 2012 ) | 65 | 23.8 | 8.5 | 59 | RCP8.5 | No. hem. |
| Lawrence et al (2012) | 72 | 12.5 | 3.5 | na | A2 | No. hem. |
| Eliseev et al (2009) | 80 ± 7 |
21.0 | 4.2 ± 1.4 | 100–200 | A2 | No. hem. |
| Lawrence et al (2008) | 85 ± 2 |
10.7 | 1.6 ± 0.2 | 50–300 | A1B | No. hem. |
| Lawrence and Slater (2005) | 90 ± 2 |
10.5 | 1.0 ± 0.2 | 50–300 | A2 | No. hem. |
aCalculated from numbers or tables in text. bCalculated from estimated trends.
Table 2.
Projections of cumulative emissions from thawing permafrost, with CO2 equivalents in parentheses
| Study | 2100 | Permafrost carbon emissions (Gt C)2200 | 2300 | Flux uncertainty (%) | Temperature increase (K)2100 | Initial carbon stock (Gt C) | Permafrost area loss (%)2100 | Scenario |
|---|---|---|---|---|---|---|---|---|
| Zhuang et al (2006) |
37 (46) | na |
na | 3% | na | na | A2 | |
| Dutta et al (2006) | 40 (50) | na | na | na | na | 460 | 5 °C Siberia | |
| Burke et al (2013) | 50 (62) |
na | 99 (124) |
41% | na | 850 | 76 ± 20 | RCP8.5 |
| Koven et al (2011) | 62 (78) | na | na | 11% | na | 504 | 30 | A2 |
| Schneider von Deimling et al (2012) | 63 (79) | 302 (378) | 380 (476) | 16% | 0.13 ± 0.10 | 800 | 57 ± 20 | RCP8.5 |
| Schuur et al (2009) |
85 (107) | na | na | 15% | na | 818 | A2 | |
| Schaphoff et al [2013] | 98 (122) | na | 226 (283) |
23% | na | 952 | 24 | 5 °C global |
| Gruber et al (2004) | 100 (125) | na | na | na | na | 400 | 2 °C global | |
| Schaefer et al (2011) | 104 (130) | 190 (238) | na | 36% | na | 313 | 30 ± 10 | A1B |
| Burke et al (2012) | 150 (188) | na | na | 67% | 0.22 ± 0.14 | 951 | 65 | RCP8.5 |
| Schuur et al (2013) | 158 (198) | na | 345 (432) | 24% | na | 1488 | 55 ± 5 |
RCP8.5 |
| MacDougall et al (2012) | 174 (218) | na | na | 61% | 0.27 ± 0.16 | 1026 | 56 ± 3 | RCP8.5 |
| Harden et al (2012) | 218 (273) |
na | 436 (546) |
85% | na | 1060 | 74 | RCP8.5 |
| Raupach and Canadell (2008) |
347(435) | na | na | na | 0.7 | 500 | A2 |
aCO2 equivalent calculated assuming 2.3% of total emissions is CH4 (Schuur et al 2013) and a global warming potential of 33 (Shindell et al 2009). bCalculated from rates in the paper. cNot available. dCalculated from a predicted atmospheric concentration assuming 0.4606 ppm Gt C−1 and half of all emissions stay in the atmosphere (Schaefer et al 2011). eAssumes half of the estimated committed carbon is respired by 2100 and the rest by 2300.
The spread between models resulted from differences in how they represented snow processes, soil organic matter, and associated soil and snow thermodynamic properties (Koven et al 2013). Snow in winter is very insulating, resulting in permafrost temperatures that are usually several degrees warmer than the air temperature (Zhang 2005, Schaefer et al 2009). Most of the spread between models resulted from differences in how they represented snow and associated insulating effects on soil temperature (Koven et al 2013). The surface organic layer is very insulating, especially when it dries in the summer, and tends to slow thawing of the active layer (Williams and Smith 1989). Models with no organic soil layer simulated deeper active layers and less permafrost than currently observed and were more sensitive to permafrost degradation in response to future climate change (Koven et al 2013). In addition, none of these models account for melting of excess ground ice ubiquitous in many permafrost regions, which will slow permafrost degradation due to latent heat effects (Burn and Nelson 2006). A more detailed evaluation of the AR5 models against observed permafrost temperatures and ALT will help better isolate how to improve simulated permafrost dynamics. However, improvements in projections of permafrost degradation should focus on improving the representation of the soil organic layer, snow processes, and excess ground ice.
Although the models vary widely, they all agree that permafrost degradation will occur in the future, resulting in substantial changes to the landscape due to abrupt changes in soil physical properties and hydrology. Expensive and extensive damage to buildings, roads, and other key infrastructure can occur quickly once permafrost begins to thaw, impacting national and regional budget planning and public services. However, there are very few studies and reports that quantify the risks, costs and mitigation associated with property and infrastructure damage due to permafrost degradation.
2.3. The PCF
There are currently 14 published estimates of CO2 and CH4 emissions from thawing permafrost and impacts of the PCF on global temperature (table 2). All but three of the projections in table 2 are based on the IPCC AR5 representative concentration pathway (RCP)8.5 scenario, or its equivalent in the AR4, the A2 scenario. The methods used to estimate permafrost carbon flux vary: nine estimates are based on models, three on observations (Dutta et al 2006, Schuur et al 2009, Harden et al 2012), one on qualitative risks (Gruber et al 2004), and one on an expert solicitation (Schuur et al 2013). The Burke et al (2013) estimate is an ensemble average of emissions estimates based on changes in permafrost extent from 17 global climate projections from AR5. Four of the model projections include estimates of global temperature increases due to emissions from thawing permafrost: three based on simulated climate sensitivities (Schneider von Deimling et al 2012, Burke et al 2012, Raupach and Canadell 2008) and one using a fully coupled land–ocean–atmosphere model (MacDougall et al 2012). All four of the estimates of temperature increase account for subsequent uptake of permafrost emissions by the terrestrial biosphere and the ocean. Except for MacDougall et al (2012), none of the projections represent the complete or 'closed' feedback loop on global temperature, where emissions from thawing permafrost influence air temperature and the simulated permafrost thaw rate.
The ensemble average of estimated cumulative emissions from thawing permafrost by 2100 is 120 ± 85 Gt C and the median is 100 Gt C, but the spread in flux estimates is as broad as seen in table 1. Five of the studies include estimates of CH4 as well as CO2 emissions, but for consistency, we calculated all CO2 equivalents assuming 2.3% of the emissions from thawing permafrost will be CH4 (Schuur et al 2013) and a global warming potential of 33 (Shindell et al 2009). The average of estimated uncertainties from individual studies is 54% or ±66 Gt C, but a more realistic estimate is 72% or ±85 Gt C based on the standard deviation of the model ensemble. Enhanced plant growth currently removes roughly one-quarter of all anthropogenic CO2 emissions, and projections indicate a cumulative land uptake by 2100 of approximately 160 Gt C (Friedlingstein et al 2006). The PCF estimates in table 2 indicate emissions from thawing permafrost could cancel out 19%–100% of this global land uptake of CO2 emissions.
The large spread in cumulative flux estimates in 2100 resulted primarily from differences in simulated permafrost thaw rates, organic matter decay rates, and, to a lesser extent, differences in assumed initial stock of frozen carbon. Models assumed different amounts of initial frozen carbon, which determined the theoretical upper limit on the cumulative flux in 2100. However, the change in permafrost area determined the amount of thawed organic matter and the simulated flux. The correlation between estimated cumulative flux and the permafrost area in 2100 is 0.9, which is statistically significant at 95% confidence using a two-tailed Student t-test.
Essentially, the factors described above that determine the projected areal loss of permafrost in 2100 also determine the cumulative flux from thawing permafrost. However, the simulated temperature sensitivity of organic matter decay plays a role as well. For example, the Raupach and Canadell (2008) cumulative flux in 2100 is double the next lowest estimate not because of the simulated loss of permafrost area, which is comparable to the other estimates, but because their model did not shut down respiration when the organic matter refreezes in winter, resulting in relatively fast decay and a large cumulative flux. Consequently, improving how models represent the effects of soil organic matter, snow processes, excess ground ice, initial frozen carbon, and decay temperature sensitivity will improve estimates of emissions from thawing permafrost.
We may be committed to long-term CO2 and CH4 emissions from thawing permafrost that will influence the climate system for centuries (Schaefer et al 2011, Burke et al 2012, Schaphoff et al 2013, Schuur et al 2013). The decay of thawed organic material is slow in permafrost regions because the soil will always be cold and wet in summer and periodically refreeze in winter (Koven et al 2011, Schaefer et al 2011, Schneider von Deimling et al 2012). Schaefer et al (2011) simulated a characteristic carbon turnover time of ∼75 years, indicating it would take ∼150 years for 95% of the thawed organic matter to decay away. Also, permafrost and additional organic matter will continue to thaw for decades or even centuries after warming stops (Schaefer et al 2011). The six long-term estimates in table 2 indicate that ∼60% of the cumulative emissions from thawing permafrost will occur after 2100. Future studies should extend their projections to 2200 or even 2300 to evaluate the long-term impacts of the PCF on global climate.
Using the model results summarized here, we estimate that the PCF will increase the global average surface air temperature by 0.29 ± 0.21 °C in 2100. To make this estimate, we first calculated the regression of global temperature increase as a function of cumulative flux for the four estimates in table 2 that include temperature impacts: 0.0019 °C Gt C−1. Although the four studies used different estimates of climate sensitivity, this regression has an r2 of 0.95 and is statistically significant at 95% confidence using a two-tailed Student t-test. These four estimates account for subsequent terrestrial and ocean uptake of CO2 from thawing permafrost, so this regression represents the temperature impacts of net carbon emissions from permafrost. Multiplying by the ensemble average cumulative emissions of 120 ± 85 Gt C gives a temperature increase of 0.23 ± 0.17 °C in 2100, consistent with temperature increases due to historical anthropogenic emissions (IPCC 2013). Using the CO2 equivalent emissions increases this to 0.29 ± 0.21 °C by 2100, indicating CH4 emissions from thawing permafrost would increase global temperatures by 0.06 ± 0.05 °C in 2100. The assumed cumulative anthropogenic emissions for RCP8.5 is ∼2100 Gt C in 2100 (IPCC 2013), so the PCF would increase emissions by 5.7 ± 4.0%. The projected increase in global average air temperature for RCP8.5 is 3.7 ± 1.1 °C in 2100 (IPCC 2013), so the PCF would increase global temperatures by 7.8 ± 5.7%.
Our simple estimate of a 0.06 ± 0.05 °C increase in global temperature in 2100 due to CH4 emissions from thawing permafrost is consistent with other published estimates based on more sophisticated models. We estimate that CH4 emissions will contribute 21% of the total warming due to the PCF while Schneider von Deimling et al (2012) and Burke et al (2012) estimate CH4 will contribute 10% and 25% respectively, corresponding to 0.013 °C and 0.055 °C in 2100. Anisimov (2007) estimated a global temperature increase of 0.012 °C and Gao et al (2013) estimated an increase of 0.1 °C in 2100 due to CH4 releases from thawing peatlands and wetlands. Anisimov (2007) and Gao et al (2013) did not include CO2 emissions, but comparing to our ensemble average of 0.29 ± 0.21 °C indicates their estimates would contribute 4% and 34% of the total warming due to the PCF respectively. All these are less than the estimated 30–50% based on an expert solicitation (Schuur et al 2013). An ensemble average of these estimates indicates that CH4 emissions from thawing permafrost will contribute no more than 0.05 ± 0.04 °C or ∼16% of the warming due to the PCF in 2100 and represents no more ∼1% of the warming due to anthropogenic emissions.
There are large sources of uncertainty in these PCF estimates that need to be quantified and reduced. The simulated permafrost extent and the loss of permafrost area for a given warming scenario is the largest source of uncertainty in these projections (Koven et al 2013). Differences in the assumed IPCC scenario and associated warming rates and the exact amount of frozen organic matter are also large sources of uncertainty. These estimates also do not account for processes that could either enhance or reduce emissions from thawing permafrost. For example, these estimates do not account for either potential enhanced peat growth, which would compensate for permafrost emissions (Camill et al 2001), or the development of thermokarst features and thermal erosion, which would accelerate permafrost emissions. Some of the thawed organic matter will be dissolved into the ground water and carried off into lakes and oceans, but how much would be buried in deep water and how much would be oxidized and released into the atmosphere as CO2 and CH4 is not known.
The PCF should influence the negotiation of emissions reductions in the international treaty to address global climate change. The treaty currently under negotiation to replace the 1997 Kyoto Protocol focuses on a target warming of 2 °C above pre-industrial temperatures by 2100 (UNEP 2011). When adopted and ratified, this treaty would succeed the 1997 Kyoto Protocol and place limits on anthropogenic greenhouse gas emissions for each country. The estimates in table 2 are on par with the differences in the total greenhouse gas emissions between RCP scenarios, so the long-term climate after 2100 will be determined by both permafrost and anthropogenic greenhouse gas emissions. The IPCC scenario closest to the 2 °C warming target is RCP4.5, corresponding to an upper limit on anthropogenic emissions of ∼900 Gt (IPCC 2013). Most of the estimates in table 2 correspond to RCP8.5, but, fortunately, both Schneider von Deimling et al (2012) and Burke et al (2013) ran projections for the RCP4.5 and estimated permafrost emissions by 2100 of 27 and 100 Gt C and temperature increases of 0.05 and 0.15 °C in 2100 respectively. Based on these two estimates, the PCF would account for 3%–11% of the total allowed emissions, indicating the relative importance of the PCF is greater under scenarios of lower anthropogenic emissions. If we assume 60% of committed permafrost emissions will occur after 2100, these numbers increase to 9%–33% of total allowed emissions, indicating that failure to account for CO2 and CH4 emissions from thawing permafrost in the treaty may result in overshooting the 2 °C warming target.
CO2 and CH4 emissions from thawing permafrost will also complicate treaty verification. Verification of emission reductions will involve a combination of emissions reported by individual countries confirmed by estimates of actual emissions derived from models using direct measurements of atmospheric greenhouse gas concentrations. Many countries already have infrastructure to measure atmospheric greenhouse gases and estimate regional emissions, such as the Carbon Tracker system in the United States (Peters et al 2005). However, it is not clear whether this infrastructure can detect emissions from thawing permafrost and distinguish them from anthropogenic greenhouse gas emissions.
Treaty negotiators will use the climate projections in AR5 to help negotiate emissions targets, but none of these projections include the effects of the PCF. Participating model teams had to stop new model development in 2009 in order to meet AR5 deadlines, before the scientific community fully realized the potential effects of the PCF on global climate and too late to incorporate PCF dynamics into their models. The AR5 sections on permafrost and the global carbon cycle evaluate our current knowledge of the PCF, but the PCF is not included in the climate projections (IPCC 2013). Most models in the AR5 simulate carbon cycle dynamics in the active layer with varying degrees of success (Todd-Brown et al 2013), but none of them include deep, frozen carbon in the permafrost below the active layer. The simulated carbon fluxes into the atmosphere are biased low because they do not account for the decay of carbon that thaws as the simulated permafrost degrades. Atmospheric CO2 concentrations are prescribed for each RCP based only on fossil fuel emissions and do not include emissions from thawing permafrost. Other key reports, such as the Global Outlook for Ice and Snow commissioned by UNEP and the Snow, Water, Ice, and Permafrost in the Arctic assessment commissioned by the Arctic Monitoring and Assessment Programme mention CO2 and CH4 emissions from thawing permafrost, but do not quantify how these emissions influence global climate. Since none of the models participating in the AR5 include thawing of deep, frozen carbon as permafrost degrades, all climate projections in AR5 are biased low relative to global temperature and all emissions targets based on those projections would be biased high.
We recommend the IPCC prepare a special assessment or similar report on CO2 and CH4 emissions from thawing permafrost suitable to supplement the AR5 in support climate change policy discussions and treaty negotiations (Schaefer et al 2012). The special assessment would require new simulations that evaluate future permafrost degradation, estimate potential CO2 and CH4 emissions from thawing permafrost, identify key unknowns, and quantify uncertainty. Most importantly, the IPCC should assess the potential effects of permafrost CO2 and CH4 emissions from thawing permafrost on global temperatures in 2100 to support treaty negotiations and in 2300 to evaluate the effect of committed emissions on long-term global climate. An IPCC special assessment on permafrost degradation and the PCF would complement the AR5 and provide international community with the scientific information required to negotiate anthropogenic emissions targets for the climate change treaty.
3. Conclusions
Degrading permafrost can alter ecosystems, damage infrastructure, and release enough CO2 and CH4 to initiate the PCF and influence global climate. Available estimates of the PCF indicate 120 ± 85 Gt of carbon emissions from thawing permafrost by 2100. This is equivalent to 5.7 ± 4.0% of total anthropogenic emissions for the RCP8.5 scenario and would increase global temperatures by 0.29 ± 0.21 °C or 7.8 ± 5.7%. For RCP4.5, the scenario closest to the 2 °C warming target for the climate change treaty, the range of cumulative emissions in 2100 from thawing permafrost decreases to between 27 and 100 Gt C and the impact on temperature to between 0.05 and 0.15 °C, but the relative fraction of permafrost to total emissions increases to between 3% and 11%. Projections indicate 60% of the permafrost emissions will occur after 2100, indicating that not accounting for permafrost emissions risks overshooting the 2 °C warming target. AR5 climate projections, and any emissions targets based on those projections, do not include the PCF. Consequently, we recommend the IPCC commission a special assessment focusing on the PCF and its impact on global climate to support treaty negotiation.
Acknowledgements
This article was funded by NASA under grant NNX10AR63G, by NOAA under grant NA09OAR4310063, by the NSF Permafrost Carbon Research Coordination Network under Grant 955713 and under AON Grant ARC-0856864, and by the United Nations Environmental Programme, Division of Early Warning and Assessment.