

Abstract
Numerical investigations have been carried out to study the wake characteristics of flow past two tandem square cylinders vibrating in phase. Both the cylinders vibrate in a transverse direction, i.e., perpendicular to the incoming flow with the same frequency and amplitude. The frequency of vibration of the cylinders and the inter-cylinder spacing are varied for fixed values of the Reynolds number (Re = 100) and the amplitude ratio ( = 0.4). The synchronous or lock-in regime for the oscillatory wake of the vibrating cylinders has been identified by varying the frequency of the vibration from
  = 0.4
= 0.4  to 1.6
  (
( being the frequency of vortex shedding behind a stationary square cylinder). The characteristics of lift and drag and the mechanism of vortex shedding are studied by varying the excitation frequency within the lock-in range for each value of inter-cylinder spacing. The complex interaction of flow between the cylinders gives rise to a variety of characteristically different shedding patterns in their wake. For values of inter-cylinder spacing equal to 2D and 3D, periodic, as well as quasi-periodic, lock-in behaviors are observed in the synchronous range.
Export citation and abstract BibTeX RIS
Communicated by M Maxey
Nomenclature

|
Amplitude of vibration |

|
Unit vector along a specified direction |

|
Drag coefficient |

|
Average drag coefficient |

|
Lift coefficient |

|
Root mean square value of lift coefficient |

|
Side of square cylinder (characteristic dimension for length scale) |

|
Drag force |

|
Lift force |

|
Pressure force |

|
Viscous force |

|
Excitation frequency of transverse vibration of cylinders |

|
Normalized vortex shedding frequency |

|
Vortex shedding frequency behind stationary cylinder |

|
Frequency ratio 
|

|
Vortex shedding frequency in the wake of downstream cylinder |

|
Width of the computational domain |

|
Unit vector along x-direction |

|
Unit vector along y-direction |

|
Length of the computational domain |

|
Static pressure at any location of the fluid domain |

|
Free stream static pressure |

|
Reynolds number 
|

|
Inter-cylinder spacing |

|
Non-dimensional time |

|
Uniform velocity at inlet |

|
Non-dimensional velocity component in x-direction or flow direction |

|
Non-dimensional velocity component in y-direction or transverse direction |

|
Non-dimensional streamwise coordinate |
| y(t) | Displacement of the cylinder from its centre |

|
Non-dimensional transverse coordinate |
1. Introduction
Flow past systems of two or more circular and square cylinders in various configurations has become an area of interest in the last few decades due to the complex nature of their wake patterns and their physical importance in engineering applications. The complexity in the flow increases with an increase in the number of cylinders. Cylinder vibrations make the flow even more complex due to the onset of nonlinearity in the flow and the different types of interactions between the cylinders and the flow-field. Various researchers, either experimentally or numerically, have investigated the response of cylinders in different arrangements, which vibrate inline or transversely to the incoming flow (Li et al 1992, Minewitsch et al 1994, Mahir and Rockwell 1996, Lai et al 2003, Papaioannou et al 2006, Yang and Zheng 2010, Sewatkar et al 2011). In order to appreciate the behavior of flow past multiple vibrating cylinders, it is important to understand the flow characteristics past a single vibrating cylinder.
Flow past a transversely vibrating circular cylinder has been experimentally studied by Bishop and Hassan (1964), Tanida et al (1973) and Bearman and Obasaju (1982). The experiments were carried out over a range of excitation frequencies. They observed that in a particular range of cylinder excitation frequencies, the vortex shedding frequency synchronizes with the excitation frequency, and the phenomenon is termed 'lock-in.' Sudden changes in fluid force amplitudes and phases are observed when the frequency of excitation is varied within the lock-in range for a fixed value of amplitude of vibration of the cylinder. Different modes of vortex shedding have been observed by Williamson and Roshko (1988), with changes in amplitude and frequency of a transversely vibrating circular cylinder. Gu et al (1994) confirmed that the ratio of amplitude to the side length of the cylinder also has a significant effect on the behavior of the lock-in regime. Moreover, they reported that the band of frequency in which lock-in occurs widens with an increase in the amplitude of vibration. Many researchers have observed that when the excitation frequency of cylinder vibration crosses either boundary of the lock-in range, the surface of the cylinder from which the vortex shedding occurs alternates. This is referred to as 'vortex switch.' Bishop and Hassan (1964) and Stansby (1976), in their experimental study on flow past a vibrating circular cylinder, and Singh et al (2009), in their numerical study on flow past a vibrating square cylinder, observed this phenomenon.
The complexity in the flow grows with an increase in the number of cylinders, owing to their arrangement and geometry. This is observed even for stationary cylinders, and so the situation is expected to be more complex for vibrating cylinders. For cylinders placed in a tandem arrangement, the interaction between two stationary cylinders in tandem is highly sensitive to their relative spacing. If cylinders are far separated, the flow pattern behind either of them is nearly similar to that of flow past a single cylinder. As the separation distance between the cylinders decreases, the flow patterns are influenced by the interference effect. The vortex shedding pattern, force coefficients and Strouhal number are influenced appreciably by the inter-cylinder spacing, as suggested by Patil and Tiwari (2009) and by Bao et al (2012) for in-line square cylinders. Mahir and Rockwell (1996) experimentally studied the flow past two transversely vibrating circular cylinders at a Reynolds number of 160 over a range of frequencies, amplitudes and phase angles between the vibrations of both of the cylinders. They reported that the vibration of the cylinders leads to a substantially wider lock-in band than observed for an isolated single cylinder. They also observed that the range of frequencies at which lock-in occurs increases, and the amplitude of vibration at which lock-in occurs decreases, as the spacing between the two cylinders is reduced. They observed that flow regimes are sensitive to changes in phase between the vibrating cylinders when they are closely spaced.
Jester and Kallinderis (2004) numerically investigated flow-induced vibration and also forced vibration in the transverse direction for two circular cylinders arranged side by side, as well as in tandem configurations. They validated their results of forced transversely vibrating circular cylinders in a side-by-side arrangement with the experimental results of Mahir and Rockwell (1996). Lee et al (2009) studied the flow patterns behind two circular cylinders vibrating out of phase (phase difference of 180°) and placed side by side, with cylinder spacing as the main parameter. They suggested that most of the flow patterns observed for two vibrating cylinders can be explained by a suitable combination of two stationary cylinders and a single vibrating cylinder.
The region of the lock-in response, when plotted in an amplitude-versus-frequency bifurcation diagram, resembles a tongue, which is referred to as 'Arnold tongue' by mathematicians working with dynamical systems. Papaioannou et al (2006) numerically showed that for tandem circular cylinders, the geometry of the Arnold tongue depends on the phase difference between the two vibrating cylinders. They observed that unlike single vibrating cylinders that have a solid Arnold tongue, two circular cylinders vibrating in phase can have holes in the Arnold tongue, and they attributed this to the presence of regimes of quasi-periodicity within the lock-in range as the amplitude is increased for a frequency ratio between  = 1.25 to 1.5 (ratio between the excitation frequency and the vortex shedding frequency behind a stationary cylinder). They also noticed the widening of the lock-in range, especially toward the higher frequency, in the case of tandem cylinders as compared to a single cylinder.
In spite of a wide range of studies pertaining to flow past stationary and vibrating cylinders, it is still not clear how different the flow behavior would be if two square cylinders vibrated simultaneously in a transverse direction with respect to the oncoming flow. From the detailed literature review, it is understood that the flow behaves differently for different frequencies of vibration of the cylinders. The present work is a numerical study of a low Reynolds number flow past two square cylinders arranged in tandem and vibrating transversely in phase with each other. The study is focused on the synchronous regime where the vortex shedding frequency synchronizes with the cylinder excitation frequency. The characteristics of aerodynamic forces acting on the cylinders and on the vortex shedding mechanism behind the cylinder combination are studied by varying the frequency of the cylinder excitation within the identified lock-in range for different values of inter-cylinder spacing. The amplitude of the cylinder vibration and the Reynolds number of the flow are kept fixed in the present study.
2. Problem definition
The domain used for the computations is shown in figure 1. The computational domain has a length of L = 26D and a width of H = 16D. Air at standard conditions was used as the working fluid. The spacing between the two tandem cylinders (S) is varied from 2D to 5D, keeping the position of the upstream cylinder fixed at 6D from the inlet. Both cylinders placed in the flow have equal dimensions. The cylinders are forced to vibrate harmonically in a transverse direction to the incoming flow, according to  , where A is the amplitude of cylinder vibration and
  is the frequency of vibration. Both the cylinders vibrate in phase with the same amplitude and frequency. The amplitude ratio of the cylinder vibration is kept fixed at
  = 0.4. For each value of inter-cylinder spacing, the frequency ratio is varied from
  = 0.4 to 1.6 to identify the lock-in range. Having identified the frequencies in the lock-in range from the set of frequency values considered, the flow characteristics are studied only for those frequencies. All the computations have been carried out for a fixed Reynolds number flow of Re = 100.

Figure 1. Computational domain.
Download figure:
Standard image High-resolution image3. Governing equations and boundary conditions
3.1. Governing equations
The fluid flow is governed by the basic equations of mass and momentum conservation. The mass conservation equation for incompressible flow is

A two-dimensional Navier–Stokes equation for unsteady laminar and incompressible flow in the non-dimensional tensor form is

where ui is the velocity component along the xi coordinate direction, and Re is the Reynolds number. For a 2D coordinate system, equation (2) collectively represents the x and y-components of the momentum equation for values of xi as x and y and of ui as u and v, respectively.
The spatial coordinates and the velocity components have been non-dimensionalized with respect to the characteristic length as a side of square cylinder (D) and the characteristic velocity as the free stream velocity at inlet  .
.
In equation (2), the Reynolds number (Re) is defined in terms of the characteristic length and the characteristic velocity as

The static pressure at any location has been non-dimensionalized as

where ρ is the density and ν is the kinematic viscosity of the fluid at the standard conditions of free stream assumed at the inlet.
3.2. Boundary conditions
-
Inlet: Uniform velocity,
 and
and
-
Outlet: Pressure outlet,
- Top and bottom walls: No-slip boundaries, and
-
Cylinder surfaces: No-slip boundaries,


4. Numerical technique and grid independence study
4.1. Numerical technique
The governing equations for the considered two-dimensional flow are solved using finite volume-based commercial software Ansys Fluent 13. The grid used for the computations is of a hybrid type, with structured quadrilateral grids close to the cylinders and unstructured (triangular) elements everywhere else in the domain. The region of quadrilateral grids moves along with the cylinders without deformation. The triangular grids deform to incorporate cylinder motion. This approach is to ensure the quality of the grid near the cylinders to capture the flow characteristics more accurately. The harmonic motion for both of the cylinders is incorporated with the help of a user defined function (UDF). The dynamic meshing capability of Ansys Fluent 13 takes care of re-meshing when the cylinders are displaced after each time step. The governing equations are solved using a finite volume discretization-based SIMPLE (Semi Implicit Method for Pressure Linked Equations) algorithm. A first order accurate implicit scheme is used for transient formulation, and convective terms are discretized using a second order upwind scheme.
4.2. Grid independence study and validation of computations
A thorough grid independence test was carried out before fixing the mesh used for the computations. Grid independence has been confirmed for stationary tandem square cylinders that correspond to the inter-cylinder spacing of 5D. The results from the study are presented in table 1. It can be clearly seen that the 160 grid points on the cylinder surface give fairly accurate results, and hence, the same is used for our computations. After the proper grid was selected, the results of the present computations were validated against the results for flow past stationary single square cylinder reported by Robichaux et al (1999), Sharma and Eswaran (2004), Singh et al (2009), Sahu et al (2009) and Sen et al (2011). Table 2 shows a comparison of the coefficients of lift and drag and the Strouhal number. The results obtained from the present computations show a close match with those reported by the above-mentioned researchers.
Table 1. Comparison of the mean drag and the RMS lift coefficient for different grids.
| No. of grid points on cylinders | Cl,rms Cyl-1 | Cl,rms Cyl-1 | Cd,mean Cyl-2 | Cd,mean Cyl-2 |
|---|---|---|---|---|
| 80 | 0.2980 | 1.3727 | 1.625 | 1.388 |
| 120 | 0.2857 | 1.338 | 1.603 | 1.365 |
| 144 | 0.2814 | 1.318 | 1.596 | 1.353 |
| 160 | 0.2815 | 1.2948 | 1.596 | 1.352 |
| 184 | 0.2813 | 1.2952 | 1.5927 | 1.352 |
| 200 | 0.2813 | 1.2953 | 1.5939 | 1.352 |
Table 2. Validation of the chosen mesh for an isolated stationary cylinder.
| Blockage | Re | Cl,rms | Cd,mean | St | |
|---|---|---|---|---|---|
| Present | 0.0625 | 100 | 0.171 | 1.626 | 0.150 |
| Robichaux et al (1999) | 0.056 | 100 | — | 1.530 | 0.154 |
| Sharma and Eswaran (2004) | 0.050 | 100 | 0.192 | 1.494 | 0.1488 |
| Singh et al (2009) | 0.050 | 100 | 0.160 | 1.510 | 0.1470 |
| Sahu et al (2009) | 0.050 | 100 | 0.188 | 1.488 | 0.1486 |
| Sen et al (2011) | 0.050 | 100 | 0.1928 | 1.5287 | 0.1452 |
Figures 2(a), (b) and 3 show the validation of the present computations against the results reported by Singh et al (2009) and Sewatkar et al (2011) for the transverse vibration of a single cylinder. The results show good agreement with minimum error in predicting the coefficients of lift and drag and the lock-in bands. The band of lock-in frequency obtained for a vibrating square cylinder is slightly narrower than that for a circular cylinder, as can be observed from figure 3, and it is a good match with the results of Singh et al (2009).

Figure 2. Comparison of (a) RMS lift (b) mean drag coefficient with a change in the frequency ratio for A/D = 0.2 and Re = 100.
Download figure:
Standard image High-resolution image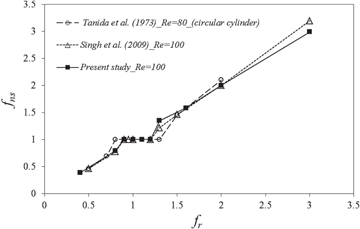
Figure 3. Comparison of the lock-in band of frequency for a single cylinder oscillation.
Download figure:
Standard image High-resolution image5. Results and discussion
Computations have been carried out for the flow past two square cylinders arranged in tandem and vibrating transversely. The amplitude of vibration of the cylinders and the flow Reynolds number are kept fixed, while the frequency of vibration and the spacing between the cylinders are varied. The frequency ratio  , which is the ratio of excitation frequency
  and the frequency of vortex shedding behind a stationary square cylinder
  , has been varied from 0.4 to 1.6 to identify the synchronous or lock-in regime. In the following subsections, after validation of the computations, the flow past stationary tandem cylinders is first studied, followed by the identification of the synchronous regime for two in-phase vibrating cylinders. Then, the results are presented, which correspond to the synchronous regime.
5.1. Flow characteristics behind stationary cylinders
In this section, we consider two stationary square cylinders in a tandem arrangement, with the spacing between them varying from S = 2D to S = 5D. Based on the spacing between the cylinders, researchers (Xu and Zhou 2004, Zhou and Yiu 2006) have classified the flow regimes for flow past stationary tandem circular cylinders. Results from the present computations also confirm similar observations. Figure 4 shows the vorticity contours for tandem square cylinders for different values of inter-cylinder spacing. For an inter-cylinder spacing of 2D, as shown in figure 4(a), we observe an 'extended body regime' similar to that observed for tandem circular cylinders. Here, both of the square cylinders behave as an extended body, and the shear layers interact farther downstream from the rear face of the second cylinder. For the inter-cylinder spacing of 3D and 4D, the separated shear layers from the upstream cylinder reattach directly onto the downstream cylinder, and no vortex shedding is observed behind both of the cylinders, as shown in figures 4(b) and (c), which can be referred to as the 're-attachment regime' or 'vortex suppression regime.' The authors are of the view that the shear layers may interact farther downstream, although this is not captured by the present computations. With a further increase in spacing to 5D, vortex shedding is observed behind both the upstream and downstream cylinders, as shown in figure 4(d), which can be referred to as the 'co-shedding' or 'vortex formation' regime.
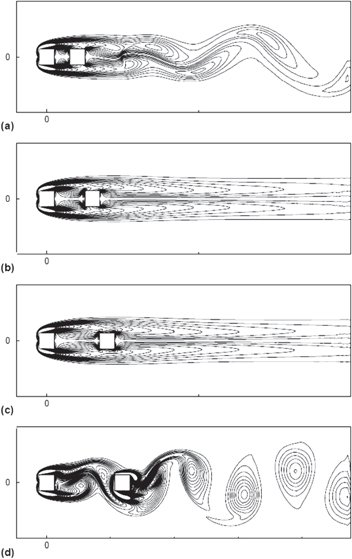
Figure 4. Vorticity contours behind stationary cylinders for different values of inter-cylinder spacing: (a) 2D, (b) 3D, (c) 4D, (d) 5D.
Download figure:
Standard image High-resolution imageFigure 5 shows the variation of the mean drag and RMS lift coefficients of the upstream and downstream cylinders with a change in the inter-cylinder spacing. The lift and drag coefficients are defined as follows:

where  is the unit vector (in this case,
  for the x-direction and
  for the y-direction), along which components of forces are sought. Accordingly,
  is the drag force, and
  is the lift force. The lift and drag coefficients per unit length of the cylinders are defined as


Figure 5. Variation of (a) mean drag, (b) RMS lift coefficient with changes in inter-cylinder spacing for stationary tandem cylinders.
Download figure:
Standard image High-resolution imageSince there is no vortex shedding in the gap between the cylinders, the downstream cylinder shows minimum drag (even negative) until the inter-cylinder spacing reaches the value S = 4D. Similarly, the lift coefficient of the downstream cylinder is almost negligible and does not vary up to the spacing value of 4D. The upstream cylinder, which is exposed to the incoming flow, shows almost constant values of drag coefficient, which is slightly less than that of an isolated single cylinder (table 2). The lift coefficient of the upstream cylinder is also close to zero because of the suppression of vortex shedding behind it. A sudden increase in values of lift and drag is observed when the spacing gets increased from S = 4D to 5D. This is attributed to the onset of vortex shedding in the spacing between the cylinders, caused by shear layer interaction.
5.2. Identification of lock-in (synchronous) regime
Figure 6 presents the variation of the normalized vortex shedding frequency  with the frequency ratio
  . The normalized vortex shedding frequency is defined as:

where  is the vortex shedding frequency in the wake of the downstream cylinder. There exists a range of excitation frequencies over which the frequency of vortex shedding matches that of the excitation frequency. This range is referred to as the 'lock-in' or 'synchronous' regime. Here, the vortex shedding frequency behind the vibrating cylinder deviates from the vortex shedding frequency behind the stationary cylinder and becomes equal to the excitation frequency. In figure 6, the plateau represents the region of the synchronous response. The regions before and after the plateau are the sub-synchronous and super-synchronous regimes, respectively. Even though the results have been plotted by capturing the vortex shedding frequency behind the downstream cylinder, it has been observed that the behavior of wake behind the upstream cylinder is almost the same, and hence both cylinders are expected to have a similar lock-in response. It is apparent from figure 6 that for spacing values of 2D and 3D, the lock-in appears for
  values in the range from 0.8 to 1.2. On the other hand, for spacing values of 4D and 5D, the lock-in is observed only between
  = 0.8 and 1.

Figure 6. The synchronous or lock-in response for different values of inter-cylinder spacing.
Download figure:
Standard image High-resolution image5.3. In-phase vibration of tandem cylinders
In the present study, our main focus is the characterization of the wake in the lock-in regime. It corresponds to the plateau in figure 6, where the frequency of the vortex shedding gets synchronized with the excitation frequency. Frequency ratios considered within the lock-in range for this study are  = 0.8, 1 and 1.2.
5.3.1. Characteristics of lift and drag
Figures 7 to 10 present the history of lift and drag coefficients in the form of a time series within the lock-in range. Figures 7–9 show the variation of lift, and figures 10–12 show the variation of drag with time for a different value of frequency ratios and inter-cylinder spacing. From the time signals shown in figures 7(a), (b), 8(a), (b) and 9(a), (b), it is observed that for S = 2D and 3D, the range of oscillation amplitude of the lift coefficient is more for the upstream cylinder. On the other hand, for S = 4D and 5D, shown in figures 7(c), (d), 8(c), (d) and 9(c), (d), the range of oscillation of the lift for the downstream cylinder dominates that of the upstream one. This may be attributed to stronger pressure fluctuations on the top and bottom of the downstream cylinder, caused by the vortex shedding from the upstream cylinder for larger spacing values. It can also be noted from the lift signals that for the same frequencies of vibration, an increase in inter-cylinder spacing results in the phase shift between the lift signals of upstream and downstream cylinders (figures 7–9). They become approximately out of phase when the inter-cylinder spacing is 3D for  = 0.8, as shown in figure 7(b). On the other hand, figure 7(c) shows that for the same
  value, they become in phase at S = 4D.

Figure 7. Time series of the lift at the lock-in regime for fr = 0.8 at spacing values of (a) 2D, (b) 3D, (c) 4D, (d) 5D between the cylinders.
Download figure:
Standard image High-resolution image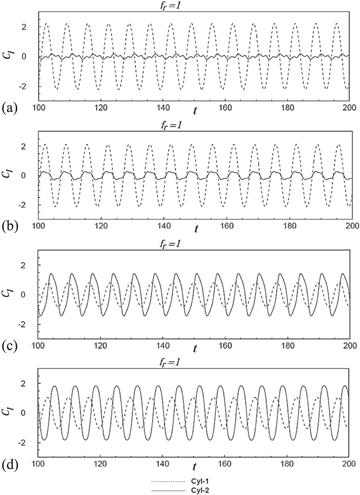
Figure 8. Time series of the lift at the lock-in regime for fr = 1 at spacing values of (a) 2D, (b) 3D, (c) 4D, (d) 5D between the cylinders.
Download figure:
Standard image High-resolution image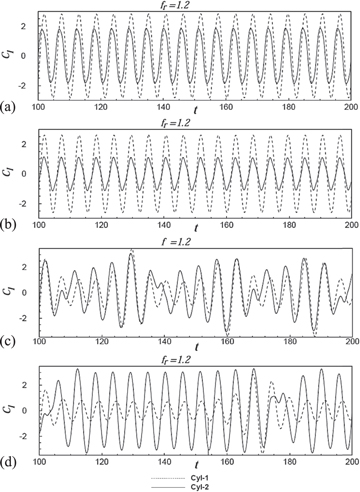
Figure 9. Time series of the lift at the lock-in regime for fr = 1.2 at spacing values of (a) 2D, (b) 3D, (c) 4D, (d) 5D between the cylinders.
Download figure:
Standard image High-resolution image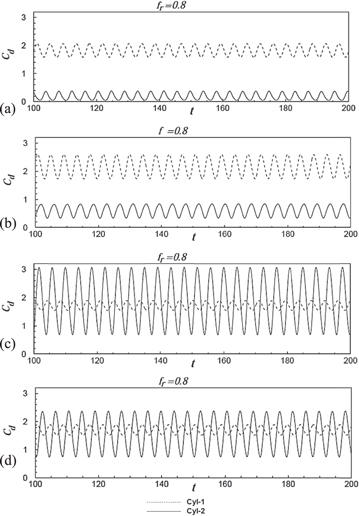
Figure 10. Time series of the drag at the lock-in regime for fr = 0.8 at spacing values of (a) 2D, (b) 3D, (c) 4D, (d) 5D between the cylinders.
Download figure:
Standard image High-resolution image
Figure 11. Time series of the drag at the lock-in regime for fr = 1 at spacing values of (a) 2D, (b) 3D, (c) 4D, (d) 5D between the cylinders.
Download figure:
Standard image High-resolution image
Figure 12. Time series of the drag at the lock-in regime for fr = 1.2 at spacing values of (a) 2D, (b) 3D, (c) 4D, (d) 5D between the cylinders.
Download figure:
Standard image High-resolution imageWithin the lock-in regime, the signals are expected to be sinusoidal since there is synchronization between the vortex shedding and the cylinder oscillation. Contrary to that, a quasi-periodic nature in the lift signals has been observed at frequency ratio  = 1, when the inter-cylinder spacing becomes S = 2D and 3D, as shown in figures 8(a) and (b), respectively. This is later explained with the help of vorticity contours. A similar observation is made by Papaioannou et al (2006) for two tandem circular cylinders that have a spacing of 2.5D and vibrate in phase at a frequency ratio of 1.226.
At a larger spacing, say S = 4D and 5D, no lock-in is observed at  = 1.2 (figures 9(c) and (d)) in our computations. This may be due to the fact that at low spacing, the presence of a stagnant recirculation region between the cylinders reduces the axial momentum of the fluid, and hence the strength of flow reaching the downstream cylinder. This weakens the strength of the vortex shedding from the downstream cylinder. Thus, the cylinder vibration is able to control the low-strength vortex shedding and synchronize it to the frequency of vibration of the downstream cylinder. Whereas at larger inter-cylinder spacing, there is sufficient room for vortex shedding between the cylinders, and hence the strength of flow reaching the downstream cylinder is high. This results in a higher strength of vortices behind the downstream cylinder. Accordingly, at a higher frequency of vibration, the cylinder is unable to make the vortex shedding frequency match the cylinder frequency. This is especially true when the cylinder vibration frequency is higher than the natural vortex shedding frequency.
The time series of drag also shows some interesting behavior with an increase in inter-cylinder spacing for the same vibration frequency of the cylinders. At the lower end of the lock-in regime ( = 0.8, figure 10), the amplitude of oscillation of the drag signals of the upstream and downstream cylinder are almost of the same range, even though their mean values differ significantly from each other for S = 2D and 3D. A sudden increase in the range of amplitude of oscillation is observed for the downstream cylinder as compared to that of the upstream cylinder when the inter-cylinder spacing is increased to S = 4D. This observation is consistent with the sudden change in flow pattern when the inter-cylinder spacing is increased from S = 3D to S = 4D. However, the mean drag shows almost the same values for upstream and downstream cylinders at S = 4D and S = 5D, as shown in figures 10(c) and (d). When the excitation frequency is exactly equal to the vortex shedding frequency of the stationary cylinder (
 = 1), as shown in figures 11(a)–(d), the range of oscillation of drag signals is observed to be approximately the same for all of the considered values of the inter-cylinder spacing. The appearance of higher harmonics in the flow first begins at
  = 1 for S = 4D and S = 5D and is visible in the signal of drag shown in figures 11(c) and (d). The presence of higher harmonics becomes more apparent at
  = 1.2 for the same value of inter-cylinder spacing, as can be seen from figures 12(c) and (d).
The phase portrait between the lift force and the cylinder displacement is a powerful tool to analyze the dynamic response of a system undergoing VIV
(Bao et al 2011). It gives an idea about the energy transfer between the cylinder motion and the fluid, thus providing an interesting description of the behavior of the system. One of the important features observed for all the phase portraits shown in figures 13–15 is that they are always symmetrical about the origin. This is due to the fact that the periodic fluctuations of pressure on the top and bottom surfaces of the cylinders are symmetrical when the cylinders are arranged in tandem. The incident vortex onto the downstream cylinder and the timing of the vortex shedding from the downstream cylinder play an important role in deciding the variation of the pressure distribution around the cylinders. Since the lift force is dependent on this pressure distribution, the shape of the phase portrait largely depends on the mechanism of the vortex shedding. A single loop closed phase portrait
indicates the existence of a periodic lock-in state. A phase portrait lying entirely in the first and third quadrants indicates that the fluctuations of the lift and the cylinder vibration are in phase, whereas the fact that they are entirely in the second and fourth quadrants implies that they are out of phase
. An elliptical phase portrait that is symmetrically inclined to the axes and that lies in the first and third quadrants would have a 45° phase difference, and the elliptical phase portrait in the second and fourth quadrant would have a 135° phase difference between the two signals. On the other hand, a circular shaped portrait with its centre at the origin represents a 90° shift between the signals. The phase portrait of the upstream cylinder, shown in figures 13(a) and (d) for  = 0.8 and the inter-cylinder spacing of S = 2D and S = 5D, respectively, shows an approximate 45° shift between the signals of the lift and cylinder vibration. A decrease in the length of the minor axis of the elliptical portrait would be associated with a decrease in the phase difference (ϕ < 45°), as shown in figures 13(b), 12(b) and 13(b), and vice versa (ϕ > 45°), as shown in figures 13(c) and (d). For
  = 1, with spacing S = 4D and S = 5D (figures 14(c) and (d)), the phase portrait of the upstream cylinder is almost circular, which corresponds to the near 90° shift in phase between the lift and the cylinder vibration.
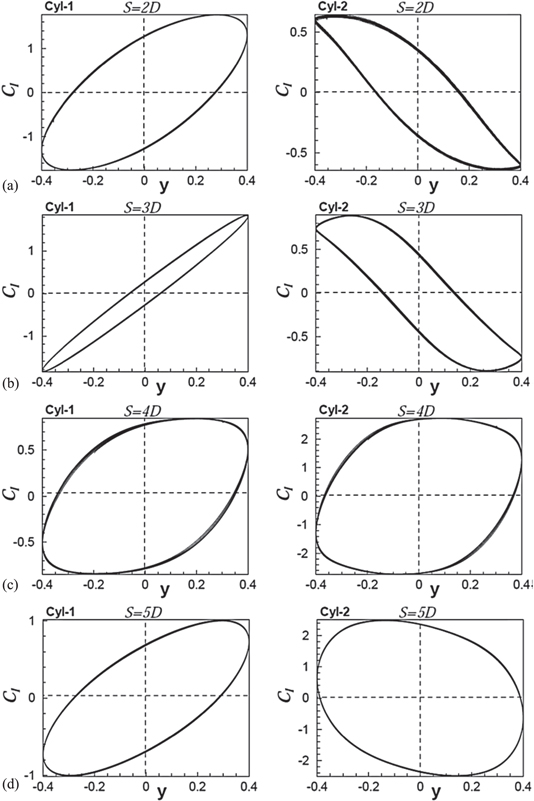
Figure 13. Phase portrait between the lift coefficient and the cylinder motion for fr = 0.8 at spacing values: (a) 2D, (b) 3D, (c) 4D, (d) 5D.
Download figure:
Standard image High-resolution image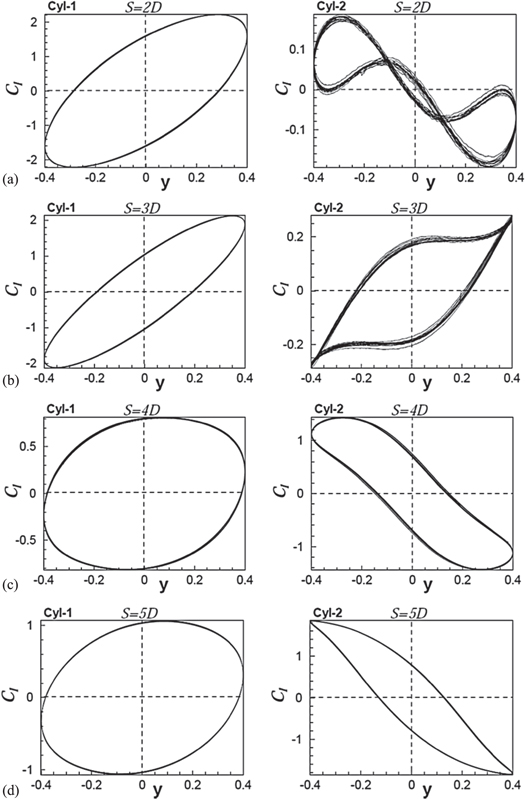
Figure 14. Phase portrait between the lift coefficient and the cylinder motion for fr = 1 at spacing values: (a) 2D, (b) 3D, (c) 4D, (d) 5D.
Download figure:
Standard image High-resolution image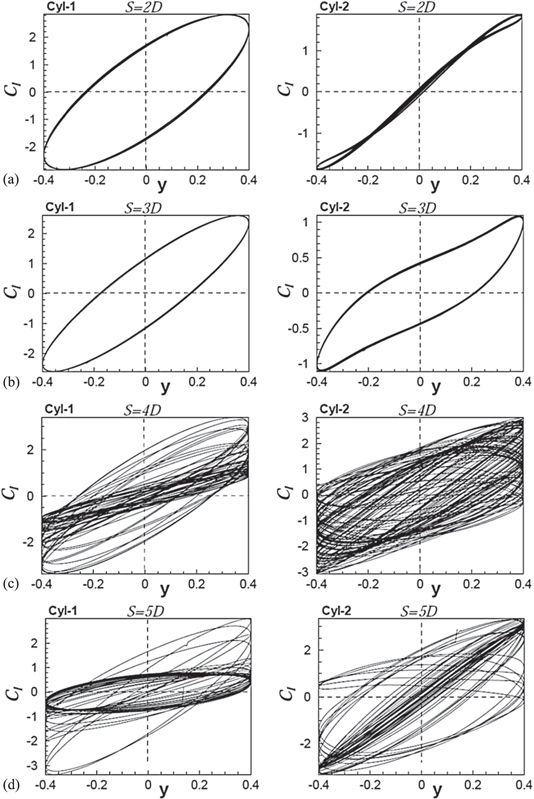
Figure 15. Phase portrait between the lift coefficient and the cylinder motion for fr = 1.2 at spacing values: (a) 2D, (b) 3D, (c) 4D, (d) 5D.
Download figure:
Standard image High-resolution imageHenceforth, in our discussion, any shift in phase of the signals that are less than 90° will be represented as in phase, and any shift greater than 90° will be represented as out of phase. Accordingly, we can summarize that the oscillation of the upstream cylinder is always found to be in phase with the lift signal for all of the values of the spacing and frequency ratios considered in our study. For the downstream cylinder, many interesting phase portraits have been observed. The phase portraits of the downstream cylinder at an inter-cylinder spacing of S = 2D shows that the lift signal, which is out of phase with the cylinder oscillation at  = 0.8 and
  = 1 (figures 13(a) and 14(a)), becomes in phase at
  = 1.2. This is consistent with the vorticity contours presented in figure 17, which show a 180° shift in vortex shedding behind the downstream cylinder. Similarly, for S = 3D, the lift signal of the downstream cylinder, which is out of phase with the cylinder oscillation at
  = 0.8, as in figure 13(b), becomes in phase at
  = 1 and 1.2 (figures 14(b) and 15(b)). The vorticity and pressure contours given in figures 20 and 21 confirm the behavior of the phase-portrait where a low pressure pocket changes its position from the top to the bottom edge of the downstream cylinder with an increase in frequency. At
  = 1, the phase portrait shows quasi-periodicity for an inter-cylinder spacing of S = 2D and S = 3D, as we have observed in the previous section dealing with the time history of lift. For S = 4D and 5D, both the upstream and downstream cylinders are observed as not in the lock-in state at
  = 1.2, which is evident from the phase portraits shown in figures 15(c) and (d).
Hence, from the signals and phase portraits presented above, we can conclude that there exists a quasi-periodic sub-regime of the lock-in within the lock-in regime when the cylinders are spaced at S = 2D or S = 3D. This quasi-periodicity has only been observed for the downstream cylinder and is due to the interaction of the shear layer from the upstream cylinder with the downstream cylinder. The detailed examination of this quasi-periodicity is reported with the help of vorticity contours in a later section.
Even though the phase portrait is an elegant tool with which to examine the signals, it is not possible to determine whether the lift signals lead or lag the cylinder vibration. Figure 16 shows the phase lag of the lift signal from that of the cylinder vibration for different values of excitation frequency and inter-cylinder spacing. This figure illustrates the explanations given in the previous paragraph that relate to phase differences in the portraits.
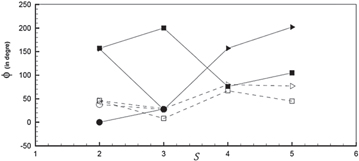
Figure 16. Phase lag of the lift signal from the cylinder oscillation for different values of inter-cylinder spacing. (■, □) fr = 0.8; (∆, ▲) fr = 1 and (●, ○) fr = 1.2, with (- - - - - -) upstream cylinder and (________) downstream cylinder.
Download figure:
Standard image High-resolution image5.3.2. Flow characteristics
The flow characteristics in the wake have been presented with the help of vorticity contour plots. In the lock-in regime, different modes and patterns of vortex shedding have been observed when the frequency of the vibration and the inter-cylinder spacing are varied. It has already been observed that the two stationary tandem square cylinders with an inter-cylinder spacing of 2D behave as a single extended body with vortex shedding occurring in the far wake of the downstream cylinder. The vortex shedding observed is of the '2S' mode (Williamson and Roshko 1988), where two alternate vortices shed one in each half cycle of the cylinder motion.
Figure 17 shows the vorticity contours of the vibrating tandem cylinders when they are at the extreme top and bottom positions of their motion. Similar to the stationary tandem cylinders, the '2S' mode of vortex shedding is observed for all the frequencies that correspond to the inter-cylinder spacing of S = 2D. The vibration of the cylinder causes the shear layer from the upstream cylinder to roll into the gap between the cylinders. With an increase in the frequency of vibration from  = 0.8 to
  = 1.2, rolling up of the vortices occurs more closely to the cylinders. The shed vortices change their shape from a transversely stretched form at
  = 0.8 to a more circular form as the frequency ratio increases (
 = 1.2) within the lock-in regime. The vortex street is observed to be aligned symmetrically above and below the mean centerline of the domain. The lateral spacing between the two consecutive vortices remains almost constant (≈1.33D) with a change in the frequency of vibration, whereas the longitudinal spacing between the two consecutive alternate vortices seems to reduce (almost linearly) with the increase in the frequency of vibration. These can be confirmed from the vorticity contours shown in figure 17.

Figure 17. Vorticity contours for S = 2D when the cylinders are (a) extreme top, (b) extreme bottom at frequency ratios fr = 0.8 (windows 1, 2), f = 1 (windows 3, 4) and fr = 1.2 (windows 5, 6).
Download figure:
Standard image High-resolution imageFigure 18(a) shows that for the separation S = 2D within the lock-in regime when the frequency ratio is increased from  = 0.8 to
  = 1.2, the lift signal of the downstream cylinder that is out of phase with respect to the cylinder motion at the lower limit of the lock-in range becomes in phase at its upper limit. This is attributed to the switch in low pressure pockets on the downstream cylinder as the frequency ratio increases. On the other hand, the upstream cylinder does not show any shift in phase between the lift and cylinder motion with the increase in frequency ratio. This is apparent from the pressure contours shown in figure 18(b), where low pressure pockets can be easily identified from the numerical values presented in the legend below the contour plots.
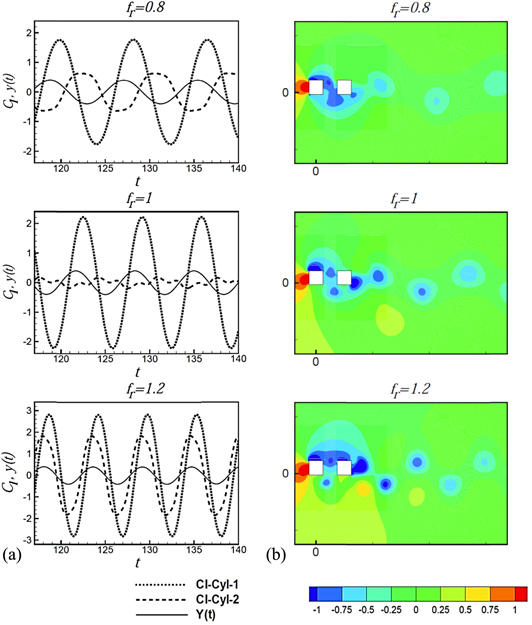
Figure 18. Switch in phase of the lift signal with an increase in the frequency ratio at S = 2D (a) coefficient of lift (Cl ) and displacement signals, (b) contour of pressure coefficient when cylinders are at the extreme top position.
Download figure:
Standard image High-resolution imageThe mechanism of vortex shedding from the cylinders when they are 2D apart and vibrate with  = 1, where quasi-periodicity is observed, has been illustrated in figure 19. The windows (1–6) of vorticity contours are chosen that correspond to the points (1–6), marked in the magnified lift signal shown in figure 19(a). The windows (1) and (2) in figure 19(b) clearly indicate that the vortex shedding is out of phase with that of the cylinder motion, as we can see that the vortices are shed from the bottom edge of the downstream cylinder when the cylinders are at their top extreme position, and vice versa. Interaction of vortices that shed from the upstream cylinder with that of the downstream cylinder results in non-sinusoidal variation of the lift on the downstream cylinder. As soon as a vortex is shed from the bottom edge of the downstream cylinder, as seen in window (1) of figure 19(b), the lift signal changes its nature and begins to increase from its negative maximum value (i.e., point '1' in figure 19(a)) towards positive values. The separated shear layer from the upstream cylinder creates a low pressure region below the downstream cylinder which disturbs the sinusoidal nature of the lift signal and causes a drop in lift as observed from (2) to (3) in figure 19(a). At point (3), this low pressure region merges with the shear layer of the downstream cylinder, as seen from window (3) of figure 19(b); thereby, the lift again begins to rise until point (4) in figure 19(a). This is where shedding takes place from the top edge of the downstream cylinder (window (4) in figure 19(b)), and the lift signal shows maximum positive value. Similarly, during the downward motion, the presence of a low pressure zone above the downstream cylinder disturbs the signal, as shown in window (5) of figure 19(b), and it merges with the shear layer of the downstream cylinder (window (6) in figure 19(b)), and the cycle repeats.
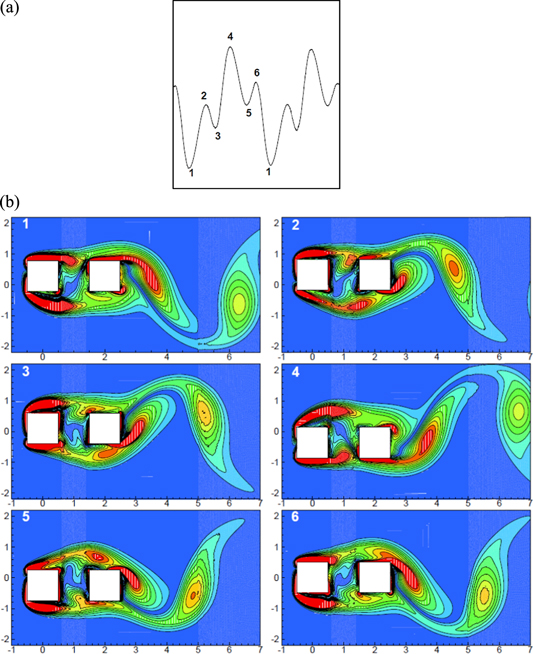
Figure 19. (a) Magnified signal of the lift coefficient for fr = 1 and inter-cylinder spacing 2D (b) instantaneous vorticity contours corresponding to state points in (a).
Download figure:
Standard image High-resolution imageThe flow past stationary tandem cylinders at spacing S = 3D is found to be steady with no vortex shedding, as previously depicted in figure 4. However, when the cylinders start to vibrate, the vortex shedding occurs behind the downstream cylinder. The vortex shedding pattern observed for this separation is similar to what has been observed for S = 2D. A '2S' mode of vortex shedding is observed for all the frequency ratios considered. Similar to the 2D separation, with an increase in the frequency of the vibration, the longitudinal spacing between two consecutive alternate vortices decreases, and the rolling up of the vortices occurs closer to the cylinder. Even though the increased spacing between the cylinders offers more room for shear layers from the upstream cylinder to roll in the gap, there is no proper interaction between the shear layers for vortex shedding to take place. These features can be observed in figure 20, which shows the variation of the shedding pattern as the vibration frequency of the cylinders is increased from  = 0.8 to
  = 1.2. It is also noticed from figure 20 that the vortex shedding from the upstream and the downstream cylinders are approximately out of phase to each other at
  = 0.8, and they are in phase at
  = 1 and at
  = 1.2. This can be clearly observed from the lift and the cylinder displacement signals, shown in figure 21(a). Again, the lift of the downstream cylinder changes its phase from out of phase with cylinder motion at
  = 0.8 to in phase with cylinder motion at
  = 1 and 1.2. The cause of this change of phase is also shown with the help of pressure contours in figure 21(b). The low pressure pockets can be clearly seen below the upstream and above the downstream cylinders that create out of phase lift on both of the cylinders at
  = 0.8.
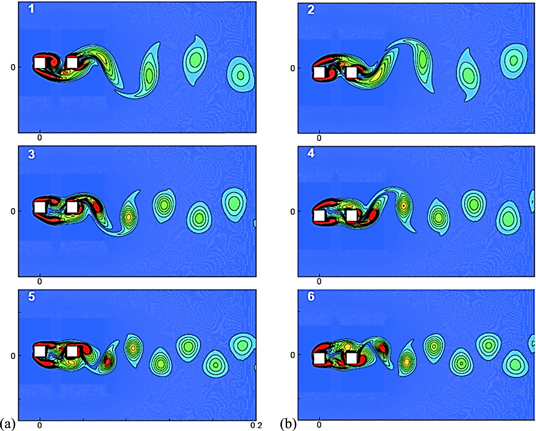
Figure 20. Vorticity contours for S = 3D when the cylinders are at (a) extreme top (b) extreme bottom for frequency ratios fr = 0.8 (windows 1, 2), fr = 1 (windows 3, 4) and fr = 1.2 (windows 5, 6).
Download figure:
Standard image High-resolution image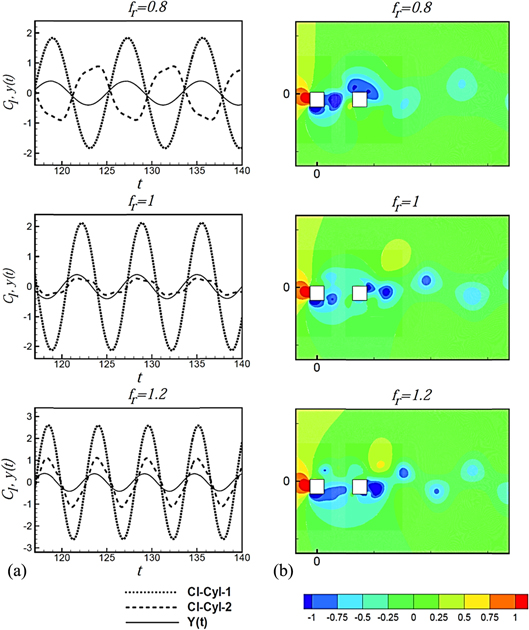
Figure 21. Switch in phase of the lift signal with an increase in the frequency ratio at S = 3D (a) coefficient of lift (Cl ) and displacement signals, (b) contour of pressure coefficient when cylinders are at extreme top position.
Download figure:
Standard image High-resolution imageSimilar to the inter-cylinder spacing of S = 3D, no vortex shedding is observed when the cylinders are held stationary at a spacing of S = 4D. However, for S = 4D, vortex shedding does take place for vibrating cylinders but shows a different pattern than that observed for S = 3D. The vortex shedding pattern over one complete cycle of cylinder vibration is shown in figure 22 for  = 0.8. Distinguishable patterns of vortex shedding are observed from the upstream and downstream cylinders for S = 4D. The evolution of a vortex street over a time period of oscillation, presented in figure 22, clearly shows a '2P' mode of vortex shedding (Williamson and Roshko 1988) behind the downstream cylinder. It is to be noted that at this spacing, the gap between the cylinders is sufficiently large for the shear layers to interact with each other. The shear layers from the upstream cylinder roll into the gap and impinge onto the downstream cylinder; then, they split into two and merge with the respective shear layers of the downstream cylinder. This sudden change in shedding pattern, with an increase in the inter-cylinder spacing at
  = 0.8, results in an abrupt increase in lift and drag on the downstream cylinder. At
  = 1, the shedding pattern returns to the '2S' mode, but due to the interaction of the shear layers from the upstream cylinder, the shedding mechanism becomes more complex than in a typical '2S' mode. Here, as we have observed for
  = 0.8, the shear layer from the upstream cylinder also rolls up between the gap, impinges onto the downstream cylinder and splits into two. However, one portion of the shear layer from the upstream cylinder, which has been split by the downstream cylinder, does not merge with the shear layer of the downstream cylinder and gets shed as a small vortex along with a vortex from the downstream cylinder and merges further downstream.
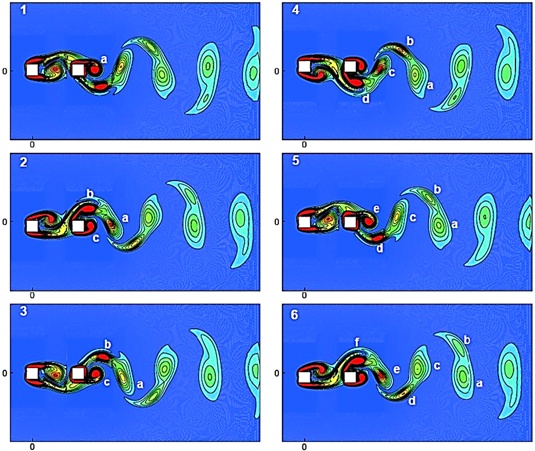
Figure 22. Vorticity contours at fr = 0.8 and 4D spacing over a time period of cylinder oscillation.
Download figure:
Standard image High-resolution imageFigure 23 shows that for S = 4D at  = 0.8, the lift forces acting on the upstream and downstream cylinders are in phase, and they almost lag by 90o, with respect to the cylinder displacement. As the frequency ratio increases to
  = 1, the lift on the downstream cylinder becomes nearly out of phase with the cylinder motion and lags by close to 90°, with respect to the lift of the upstream cylinder. The contours of the coefficient of pressure clearly show the evidence of shift in phase of the lift signal with that of the cylinder displacement.
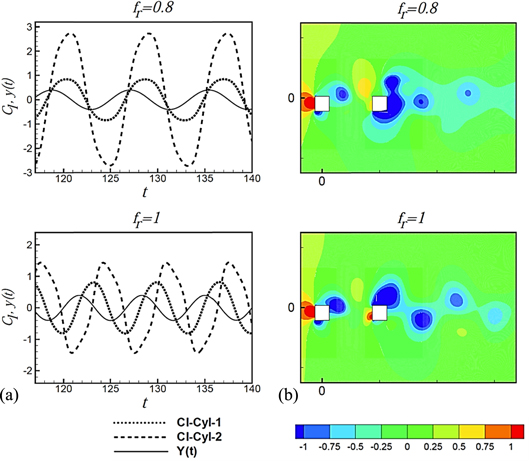
Figure 23. Switch in phase of the lift signal with an increase in the frequency ratio at S = 4D (a) coefficient of the lift (Cl ) and displacement signals, (b) contour of pressure coefficient when the cylinders are at the extreme top position.
Download figure:
Standard image High-resolution imageEven when the two cylinders that are kept 5D apart are stationary, vortex shedding occurs from both the upstream as well as the downstream cylinders. This gets enhanced when the two cylinders at the same separation are vibrating. The vortex shedding pattern observed is almost similar to that when the cylinders are at S = 4D separation. At  = 0.8, the '2P' mode of shedding observed is similar to that observed for the 4D separation. Similarly, at
  = 1, the vortex shedding pattern is similar to that of S = 4D at
  = 1. The only difference observed is that the shedding of the vortices from the upstream cylinder is out of phase and that from the downstream cylinder is in phase with the cylinder motion at
  = 1 when the inter-cylinder spacing is 5D, whereas at 4D spacing, shedding from the upstream as well as the downstream cylinder is found to be out of phase with that of the cylinder motion. The vortex shedding pattern over one complete period of oscillation of the cylinders at
  = 1 and at S = 5D has been shown in figure 24.
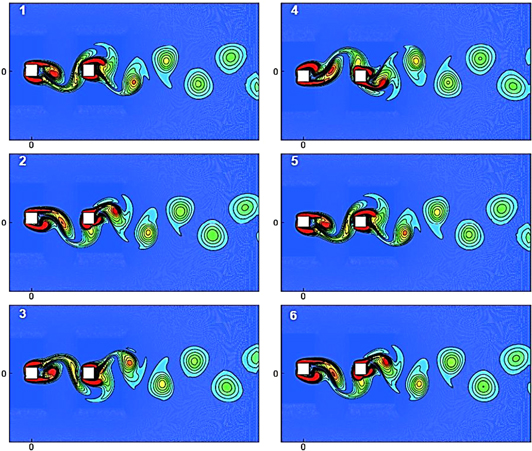
Figure 24. Vorticity contours at fr = 1 and 5D spacing over a time period of cylinder oscillation.
Download figure:
Standard image High-resolution image5.4. Variation of aerodynamic forces
A variation of the RMS lift and the mean drag coefficient with a change in spacing between the cylinders for different frequency ratios has been shown in figure 25. For  = 0.8, there is a sudden increase in the mean drag and the RMS lift of the downstream cylinder when the inter-cylinder spacing is increased from S = 3D to S = 4D. This is due to the sudden change in the vortex shedding pattern from the '2S' to the '2P' mode, as explained previously with the help of figure 22. This is accompanied by a small decrease in the RMS lift and mean drag of the upstream cylinder. It has also been noticed that when the inter-cylinder spacing is S ⩾ 4D,
the RMS lift coefficient of the downstream cylinder shows a higher value than that of the upstream cylinder. The mean drag of the upstream vibrating cylinder is found to be slightly greater than when it is held stationary in the tandem arrangement for all of the cases considered. On the other hand, the mean drag on the downstream cylinder is more sensitive to changes in inter-cylinder spacing and frequency ratio and shows a larger variation. Similarly, the RMS lift for both the upstream and downstream cylinders is found to be much higher with the cylinder vibration, as compared to its corresponding value for the stationary case.
= 0.8, there is a sudden increase in the mean drag and the RMS lift of the downstream cylinder when the inter-cylinder spacing is increased from S = 3D to S = 4D. This is due to the sudden change in the vortex shedding pattern from the '2S' to the '2P' mode, as explained previously with the help of figure 22. This is accompanied by a small decrease in the RMS lift and mean drag of the upstream cylinder. It has also been noticed that when the inter-cylinder spacing is S ⩾ 4D,
the RMS lift coefficient of the downstream cylinder shows a higher value than that of the upstream cylinder. The mean drag of the upstream vibrating cylinder is found to be slightly greater than when it is held stationary in the tandem arrangement for all of the cases considered. On the other hand, the mean drag on the downstream cylinder is more sensitive to changes in inter-cylinder spacing and frequency ratio and shows a larger variation. Similarly, the RMS lift for both the upstream and downstream cylinders is found to be much higher with the cylinder vibration, as compared to its corresponding value for the stationary case.

Figure 25. Variation of the RMS lift and the mean drag coefficient with the change in spacing between the cylinders for different frequency ratios (a) fr = 0.8, (b) fr = 1, (c) fr = 1.2.
Download figure:
Standard image High-resolution image
6. Conclusions
Computations have been performed for two equal-sized tandem square cylinders that vibrate transversely at a constant amplitude ( = 0.4) in a low Reynolds number flow (
 = 100). The cylinders are forced to vibrate harmonically and in phase. The vibration of the cylinders alters the flow situation drastically from that of the corresponding stationary cylinder case. For stationary tandem cylinders, at inter-cylinder spacing values of 3D and 4D, a region of 'vortex suppression' is observed in which no vortices are shed from either of the cylinders. On the other hand, when the cylinders vibrate, there is no evidence of vortex suppression, and clear vortex shedding takes place from the downstream cylinder for all of the spacing values considered. A change in the vortex shedding mode from '2S' to '2P' and again back to '2S' is observed when the inter-cylinder spacing is increased from S = 3D to S = 4D and further to S = 5D for the frequency ratio
  = 0.8. A region of quasi-periodic response is observed within the lock-in regime for S = 2D and 3D when the frequency ratio is
  = 1. A shift in phase of almost 180° is observed between the lift and displacement of the downstream cylinder when the frequency ratio is varied from the lower to the higher end of the lock-in boundaries. On the other hand, the phase difference between the lift and cylinder motion with an increase in frequency is nearly constant for the upstream cylinder. The change in vortex shedding mode from '2S to '2P' for spacing values between S = 3D and 4D and for
  = 0.8 results in a sudden increase of the RMS lift and the mean drag.