

Abstract
Nanoscale analysis of the local lithium-ion concentration in lithium-ion battery cathode materials is essential for achieving high-performance batteries. We developed a near-field optical technique to visualize the lithium-ion distribution in a lithium-ion battery cathode on a nanometer scale. A plasmonic metallic tip was employed to locally enhance and probe the electric field in close proximity to the LiCoO2 thin film, since it is correlated with the lithium-ion concentration at the surface. We also utilized this technique to map the electrochemically induced ion diffusion at the grain boundaries under the application of a DC voltage to the surface through the plasmonic metallic tip.
Export citation and abstract BibTeX RIS
Rechargeable lithium-ion batteries (LIBs) are the most prominent energy storage devices for portable electrical devices and vehicles. With the increasing demand for better performance of LIBs, improvements in their energy density and specific capacity are still required.1–3) In LIBs, cathode materials such as LiCoO2 play a key role in determining the overall battery performance, and extensive efforts to improve the performance of LIBs have been documented in the literature.4,5) Interestingly, both surface coatings and the nanosize effect have been demonstrated to affect the electrochemical performance of LIBs (including their cyclability and rate capability) because of nanoscale battery reactions.6,7) Nanoscale approaches to elucidate these battery reactions are crucial for the further development of LIBs.8)
Numerous investigations with the aim of elucidating the battery reactions of LIB cathode materials have been conducted using various analytical methods such as X-ray diffraction (XRD), neutron diffraction, X-ray photoelectron spectroscopy, X-ray adsorption spectroscopy (XAS), NMR, vibrational spectroscopy, and transmission electron microscopy (TEM). Both XRD and XAS can be used to characterize the crystalline structure and the environment around metal ions at the cathode surfaces. In the field of battery electrode surface research, atomic force microscopy (AFM) techniques allow us to observe local phenomena on the electrode surfaces with nanoscale spatial resolution, without requiring specific experimental conditions or sample preparation procedures.9) Clémençon et al. and Doi et al. have performed AFM measurements of electrode surfaces during electrochemical processes and detailed the topographic changes induced by lithium-ion intercalation/deintercalation into/from cathode materials in electrochemical cells.10,11) Additionally, the characterization of the surface of a LiCoO2 single crystal by scanning tunneling microscopy revealed inhomogeneous lithium-ion ordering patterns.12) These studies provide atomic-scale and nanoscale insights into direct battery reactions during battery operation. Recently, to elucidate lithium-ion transport processes within an electrolyte and within a solid during electrochemical operations, new AFM techniques such as scanning ion conductance microscopy and electrochemical strain microscopy (ESM), which feature a spatial resolution of 10–20 nm, have been applied to this research area.13–15) ESM is a powerful tool that enables the direct observation of the lithium-ion distribution/redistribution and intercalation/deintercalation processes within cathode materials in the absence of an electrolyte under an applied voltage. Moreover, the AFM technique coupled with optical microscopy has been introduced as an IR near-field scanning optical microscopy technique with the ability to elucidate not only the topography but also the phase distribution in microcrystals of a cathode material.16)
In the present study, we performed AFM-based near-field optical imaging of LiCoO2 thin films to observe the distribution of lithium ions with nanoscale resolution. A metal-coated AFM probe tip was utilized to plasmonically enhance Rayleigh scattering in the vicinity of the tip. We observed that the change in the intensity of near-field Rayleigh scattering was independent of topography. This spatial change in scattering intensity was observed as the difference in the lithium-ion concentration at each grain and between the grain edges and the grain interiors. Moreover, the lithium-ion redistribution induced by a voltage applied via the metal-coated probe tip was observed by near-field Rayleigh scattering imaging before and after the electrochemical operation.
Cathode thin films were fabricated using the RF magnetron sputtering method. Layered LiCoO2 was utilized as a cathode material since it is highly stable and is a suitable model material for investigating the diffusion of lithium ions. Two types of LiCoO2 thin films with different crystallinities were prepared in this experiment. One is an LiCoO2 film deposited onto a fluorine-doped tin oxide (FTO) film as a transparent conductive interlayer on a quartz substrate, hereafter referred to as sample LFQ. The other is a LiCoO2 film deposited onto a quartz glass substrate, hereafter referred to as sample LQ. Before the deposition of the films, the quartz substrates were cleaned by sequential sonication in ethanol and distilled water followed by a UV–ozone treatment. For the deposition process, the substrate was positioned 30 cm from the LiCoO2 target. The deposition was performed for 10 min at an RF power of 125 W and with a 0.5 Pa working gas pressure of Ar and O2 gases flowing in a  ratio to obtain LiCoO2 films with a thickness of 50 nm. After this deposition process, the LFQ and LQ films were annealed for 1 h at 725 and 500 °C, respectively, in an IR furnace to induce the growth of crystalline structures. The annealing temperatures of the LFQ and LQ films were selected to suppress the formation of the Co3O4 phase impurity in both thin films.
The crystalline structure of the LiCoO2 thin films was investigated by XRD analysis and Raman spectroscopy. These analyses were carried out using an X-ray diffractometer (Rigaku Ultima IV) equipped with a Cu Kα radiation source and a slit-scanning laser Raman microscope (Nanophoton Raman-11) with a 532 nm excitation source and a 100× objective lens.
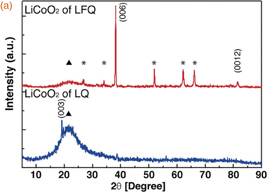
Figure 1(a) shows the XRD patterns of both the LFQ and LQ films. The XRD pattern of the LFQ film shows a strong (006) peak and a weak (0012) peak, with other broad and sharp peaks attributed to the quartz substrate and the FTO film, respectively. In contrast, the XRD pattern of the LQ film presents weak (003) and (006) peaks and a large broad peak attributed to the quartz substrate. This film was too thin for diffraction peaks of LiCoO2 to be detected, because the intensity as detected counts from crystal faces of the polycrystalline material was low. A comparison of the XRD patterns of the LFQ and LQ films reveals strong peaks and a shift of the (006) peak to lower angles in the pattern for LFQ. These results suggest that the LFQ film is more crystalline than the LQ film and that the LiCoO2 exhibits a slight lattice distortion due to lithium deficiency.17)
Download figure:
Standard image High-resolution image
Fig. 1. (a) XRD patterns of LFQ and LQ thin films. Peaks marked by asterisks and triangles are respectively attributed to FTO and quartz substrates. (b) Raman spectra of the LFQ and LQ thin films.
Download figure:
Standard image High-resolution imageAs shown in Fig. 1(b), the crystal structure of the LiCoO2 thin films gives rise to a specific Raman fingerprint that includes two bands at 486 and 596 cm−1 corresponding to the Eg (O–Co–O bending) and A1g (O–Co–O stretch) vibration modes, respectively.18) The occurrence of these Raman bands indicates that both films possess R-3m space symmetry.19) A comparison of the Raman spectra reveals differences in the peak intensities and in the FWHMs between the LFQ and LQ thin films. Both the Eg and A1g bands in the LFQ Raman spectrum are twice as intense and have narrower FWHMs than the corresponding bands in the LQ Raman spectrum, suggesting that the LiCoO2 in the LFQ film is more crystalline than that in the LQ film. This result indicates that the LiCoO2 in LQ was not sufficiently crystallized during annealing at the lower temperature, resulting in a substantial amount of low-crystalline-state LiCoO2 in this film.
Scattering-type near-field scanning optical microscopy was utilized to measure the local distribution of lithium ions in the LiCoO2 thin films. As schematically shown in Fig. 2, the near-field optical microscope was configured in combination with a tapping-mode atomic force microscope (Asylum Research MFP-3D) and an inverted optical microscope (Olympus IX71). A commercially available Si cantilever tip was metalized with silver of 50 nm thickness, which enabled to plasmonically scatter the electric field in the vicinity of the tip. A CW laser (wavelength: 532 nm) with radial polarization was tightly focused onto the sample surface under the total internal reflection configuration with a high-numerical-aperture (NA) objective lens (NA 1.45, 100×). The metalized AFM tip was oscillated normal to the sample surface using tapping-mode AFM at a resonant frequency, and the near-field optical interaction between the tip and the sample was extracted through demodulation at the same frequency by a lock-in amplifier.

Fig. 2. Schematic of our experimental setup for near-field Rayleigh scattering spectroscopy integrated with a commercial AFM and an optical system.
Download figure:
Standard image High-resolution imageNear-field Rayleigh scattering images were measured by raster scanning the LiCoO2 thin films under the tip. Figure 3 shows simultaneously collected topographical images and Rayleigh scattering images of the (a, b) LFQ and (c, d) LQ LiCoO2 thin films. Figure 3(a) shows the morphology of the LFQ thin film, which is composed of various grains with the sizes ranging from 50 to 200 nm. Figure 3(b) shows the near-field Rayleigh scattering intensity distribution in the same region. This near-field image exhibits almost the inverse contrast to the topographic image. Because of the backscattering configuration, Rayleigh scattered light in the vicinity of the tip was mostly absorbed, with the extent of absorbance depending on the volume of the LiCoO2 thin film. However, at local regions, the near-field intensity was not inversely correlated with the topography. A comparison of the images in Figs. 3(a) and 3(b) reveals that a near-field intensity higher than that expected on the basis of the volume was observed locally at the inner surface of grains indicated by red arrows. The deviation from the inverse contrast is attributed to the locally varying refractive index of LiCoO2 in the grains. It was previously reported that the refractive index of LiCoO2 drastically changes depending on the amount of lithium ions in solid LiCoO2. The LiCoO2 with lithium deficiency indicates a higher refractive index than as-prepared LiCoO2 at 532 nm,20) resulting in higher scattering intensity. This relationship enables us to estimate the local lithium-ion concentration in LiCoO2 solids from the near-field intensity distribution. Accordingly, the local lithium-ion concentration was estimated to be lower in the interior of the grain than at the grain edge and in other grains.
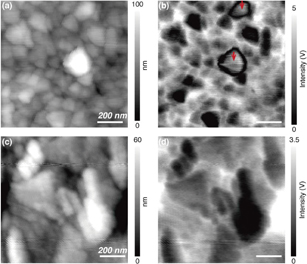
Fig. 3. Topographic images of LiCoO2 in (a) LFQ and (c) LQ thin films. Near-field Rayleigh scattering images of LiCoO2 in (b) LFQ and (d) LQ thin films.
Download figure:
Standard image High-resolution imageWe also carried out near-field Rayleigh scattering imaging of the LQ thin film, which had lower crystallinity than the LFQ thin film. The near-field optical image in Fig. 3(d) is completely correlated with the topographic image in Fig. 3(c), indicating that lithium ions were uniformly distributed on the LQ thin film without local variation of the lithium-ion concentration. These results enable us to summarize that the LFQ thin film with high crystallinity exhibits inhomogeneous ion-concentration distribution while the amorphous-like film (LQ) exhibits homogeneous ion distribution. Similar findings have been reported by Jiang et al. through the TEM observation of single LiCoO2 nanoparticles, revealing the heterogeneity, which corresponds to lithium ion deficiency, in the crystal structures of simultaneously synthesized single LiCoO2 nanoparticles.21)
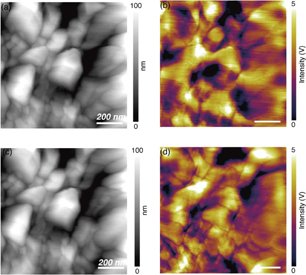
Finally, we applied this technique to observe electrochemically induced lithium-ion diffusion on LiCoO2 grains. Near-field Rayleigh scattering imaging of the LFQ surface was performed before and after a potential was applied to induce ionic diffusion. Specifically, +5 V DC was applied from the probe tip to the thin film for 10 min. Figures 4(a) and 4(b) show topographic and near-field Rayleigh scattering images on the LFQ thin film before the DC potential was applied. The yellow and purple regions indicate regions of high and low near-field optical intensity, respectively. Unlike the case of Fig. 3, the contrast in the near-field image differs from that observed in the topography of the whole scanning area, especially with respect to the volume and the shape of the grains. These observations suggest that lithium ions within LiCoO2 grains in Fig. 4 are more locally distributed than those in Fig. 3, because of the local high crystallinity. The topographic and near-field Rayleigh scattering images after the electrochemical operation are shown in Figs. 4(c) and 4(d), respectively. There were no structural changes in the size or the shape of the grains after the electrochemical operation. Despite the lack of morphological change, the optical contrast in the near-field optical images significantly changed, indicating local lithium-ion diffusion in the LiCoO2 thin film. More interestingly, grain boundaries were much more distinctly observed with weaker optical intensity in the near-field image after the electrochemical operation, indicating redistribution and concentration of lithium ions in grain boundaries. This is because the boundary area has a lower lithium-ion diffusion energy barrier.22)
Fig. 4. (a) Topographic and (b) near-field Rayleigh scattering images obtained before a DC potential was applied. (c) Topographic and (d) near-field Rayleigh scattering images obtained after a potential was applied.
Download figure:
Standard image High-resolution image
In summary, we successfully imaged the lithium-ion distribution within LiCoO2 grains without electrical operations by scattering-type near-field optical microscopy, which is capable of collecting Rayleigh scattering images at the nanoscale. Moreover, we observed the lithium-ion redistribution under an applied potential. The acquired Rayleigh scattering images showed lithium-ion distributions and local lithium-ion deficiency due to Rayleigh scattering intensity changes originating from changes in optical indices. In addition, imaging after the application of a DC voltage to diffuse lithium ions into the grains directly showed that lithium ions concentrated at grain boundaries because of the low energy barrier. One of the practical advantages of our AFM-based optical technique is a capability of measuring lithium ion distribution both before and after the electrochemical operation, enabling us to directly visualize the electrochemically induced migration of lithium ions, whereas other methods such as ESM can capture the ion distribution only under electrochemical operation. Our technique provides new platforms for improving the performance of batteries and developing innovative battery materials from the viewpoint of nanoscience.