
Abstract
Self-heating effects in organic electronic devices are investigated by impedance spectroscopy (IS). A temperature modulation of the admittance couples the gigantic imaginary part of the capacitance to its small real part, which results in negative capacitance at low frequencies with high bias. We present a model to explain the effects and verify it experimentally for hole-only devices and organic light-emitting diodes. The negative capacitance widely observed in various electronic devices can be explained, at least in the organic electronic devices, by self-heating effects. The generic effects, which smear the device details, need to be eliminated to obtain IS signals that reflect the intrinsic device-specific properties.
Export citation and abstract BibTeX RIS
Impedance spectroscopy (IS) is a powerful tool for analyzing the electrical properties of devices, in particular for capacitance–voltage analyses, which have become standard methods of investigating device characteristics. In the past few decades, the extraordinary phenomenon of negative capacitance (NC) has been reported frequently. Different sources of NC have been proposed for different devices.1–5) IS has also been extensively applied to organic devices recently, e.g., organic light-emitting diodes (OLEDs),6–10) organic photovoltaic cells,11,12) and organic thin-film transistors,13,14) revealing electrical properties such as carrier injection6,7) and transport properties.8–10) In organic devices, NC is also widely observed at low frequencies and high bias. The origin of NC2,3,9,15–18) in organic devices is still under debate.19) All the arguments, however, are based on the behaviors of charge carriers at the interfaces or in the bulk of the organic layers.
In the complex capacitance spectra of OLEDs, the real part of the capacitance at low bias (the usual level of capacitance) is commonly several orders of magnitude smaller than the imaginary part of the capacitance at low frequencies with high bias. When a mechanism exists that couples the real part, positive and small by nature, to the gigantic imaginary part, extraordinary phenomena appear in the real part of the capacitance. Under this condition, NC emerges in the real part of the capacitance with high bias at low frequencies.
In this work, we first propose that the coupling mechanism is a self-heating effect due to temperature modulation of the admittance. Second, we experimentally verify our proposed mechanism using a hole-only device (HOD) and an OLED device as examples. Two verification procedures are performed: (1) reconstruction of the NC using the current–voltage (I–V) characteristics and admittance spectra of the devices and (2) observation of a dramatic reduction in the NC when the heat capacity of the devices is increased.
Self-heating effects that couple the real and imaginary parts of the complex capacitance originate from the admittance (Y) modulated by the temperature change (ΔT) of an organic device. Consider a current I responding to an input voltage V, which is the sum of an AC voltage (with amplitude V0 and angular frequency ω) and a DC bias voltage Vb. When Y is modulated by ΔT, I is given by

where γ is the temperature coefficient of the admittance Y1 at some temperature. The Joule heat flux W generated in the device is estimated from the input power P and heat production ratio ϕ. To obtain a linear response around the bias voltage Vb, W is expanded by the Taylor series as

where α0 = P(Vb), and  . When P varies, ΔT is calculated by time integration of W(t) divided by the heat capacity CQ of the device. Omitting the nonlinear parts, the expression for ΔT produced by V = Vb + V0 exp(iωt) is
where JV is a ventilation flux (= ϕ · α0) that keeps the DC device temperature constant. Thus, the temperature-modulated Y is described by
When Y is transformed to a capacitance C through

the real part of Y1 reduces the real part of C because of the positive ϕ, γ, and α1, which are common for organic devices. Note that there is a direct relationship between the real part of Y1 and the imaginary part of C1: Re Y1 = iω · Im C1. Therefore, the second term in Eq. (5) provides an extrinsic mechanism to thermally couple the real and imaginary parts of C, causing NC.
The heat capacity CQ depends on not only the shape of the device but also the frequency. Owing to the slow thermal diffusion process, the AC heat flux generated in a sheet-shaped (xy plane) source produces an AC temperature change in a limited volume of the substrate only. The thermal diffusion process is characterized by the diffusion constant and dimensionality. At high frequencies, the one-dimensional diffusion dominates because of the z-directional (out-of-plane) temperature gradient. At lower frequencies, the two-dimensional diffusion gradually grows as the z-directional temperature gradient diminishes. For the dynamic heat capacity expressed by CQ(ω) = CQ(1)ωp, the power index p is −0.5 and −1 for one- and two-dimensional thermal diffusion, respectively. We define the characteristic time τch needed for the heat flux to penetrate the substrate of a device. For a typical glass substrate (thermal diffusivity 0.6 × 10⁻⁶ m2/s) 0.8 mm in thickness, τch is estimated to be 1 s. Using the dynamic heat capacity CQ(ω), the NC-related term picked up from Eq. (5) is expressed as

Two types of organic devices were employed in this study. First, we fabricated a typical HOD with an active layer of N,N-diphenyl-N,N-bis(1-naphthylphenyl)-1,1-biphenyl-4,4-diamine (α-NPD) and a device structure of indium tin oxide (ITO)/MoO3/α-NPD (150 nm)/MoO3/Al. Second, we prepared a typical phosphorescent OLED with an emissive layer composed of a tris(2-phenylpyridine)iridium [Ir(ppy)3] guest and an N,N-dicarbazolyl-4,4-biphenyl (CBP) host [CBP:Ir(ppy)3]. Its device structure is ITO/HAT-CN/α-NPD (20 nm)/CBP:Ir(ppy)3 (30 nm)/Balq (10 nm)/Alq3 (30 nm)/Liq/Al, where HAT-CN stands for 1,4,5,8,9,11-hexaazatriphenylene hexacarbonitrile, BAlq stands for aluminum(III) bis(2-methyl-8-quinolinato)-4-phenylphenolate, Alq3 stands for tris(8-hydroxy-quinolinato) aluminum, and Liq stands for 8-hydroxy-quinolinato-lithium. Both devices were prepared by vacuum sublimation at 1.5 × 10⁻⁵ Pa. Four pixels with a 2 × 2 mm2 active area were fabricated on a 30 × 30 mm2 glass substrate (thickness 0.8 mm) and sealed using epoxy resin with a desiccant in a dry glove box.
The impedance spectra were measured using a Solartron 1260 with a 1296 impedance analyzer. The AC voltage amplitude was fixed at 100 mV(rms). The actual bias voltage on the devices was corrected considering the output impedance (50 Ω) of the analyzer. The I–V characteristics were measured with a Keithley 2400 source meter. The device and ambient temperatures were controlled at 25 °C.
First, the self-heating effects were verified using the HOD. Figure 1 displays the capacitance spectra of the HOD with bias voltages ranging from 0 to 8 V. In the low-frequency range with high bias (≥6 V), NC can clearly be observed. In the low-bias range (≤2 V), the capacitance was approximately 0.8 × 10⁻⁹ F; in the higher-bias range (≥4 V), the capacitance decreased at low frequencies. On the other hand, the imaginary part of the capacitance was on the order of 1 × 10⁻² F at low frequencies, 7 orders of magnitude larger than the real part. These extremely different orders of magnitude of the real and imaginary parts have extraordinary effects.
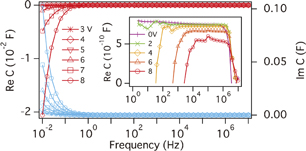
Fig. 1. Complex capacitance spectra of HOD for a series of bias voltages. Red and blue lines show the real and imaginary parts of the complex capacitance, respectively. The positive real parts are magnified in the inset.
Download figure:
Standard image High-resolution imageOn the basis of our proposed model, we reconstructed the NC signals. Figure 2(a) shows the frequency dependence of log(−C), where the small (<10−9 F) level of positive C is neglected. According to the model of Eq. (6), the slopes of log(−C) vs log(frequency) are related to the power p in the dynamic heat capacity CQ(ω) = CQ(1)ωp. Independently of the bias, the slopes provide a fitted power index of −1.45, as shown in Fig. 2(a). The obtained power index, corresponding to p = −0.55, indicates almost one-dimensional thermal diffusion. The value of p should vary between −0.5 and −1, depending on the heat diffusion path, but is hard to estimate precisely. Thus, the value of p was determined experimentally.
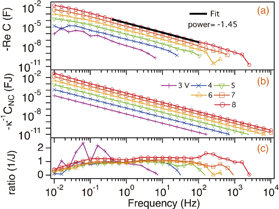
Fig. 2. (a) Logarithmic plot of observed NC (real part of −C) for HOD with a bias ranging from 3 to 8 V. Fitting (black) line indicates a power law because the dynamic heat capacity corresponds to Eq. (6). (b) Reconstructed NC following the self-heating model of Eq. (6), assuming a constant κ. (c) Ratio of the observed to reconstructed NC, which should yield constant parameters ϕγ/CQ(1) in Eq. (6).
Download figure:
Standard image High-resolution imageTo reconstruct NC, the model of Eq. (6) requires data concerning the conductivity: the real part of the admittance spectra and the input power. Figure 3 shows the input power P vs the bias voltage derived from the I–V characteristics of the HOD. By using these data, Re Y1 · α1Vb can be calculated for a series of bias voltages. Because the factors ϕ, γ, and CQ(1) in Eq. (6) cannot be obtained experimentally at present, ϕγ/CQ(1) was left unknown. The reconstructed NC spectra divided by a constant κ ≡ ϕγ/CQ(1), i.e.,

are plotted in Fig. 2(b).

Fig. 3. Bias voltage dependence of the input power P, derived from the I–V characteristics of the HOD. Inset shows the real parts of the admittance spectra Re Y1 for the HOD with a bias ranging from 3 to 8 V. These data concerning the conductivity are used to reconstruct the NC.
Download figure:
Standard image High-resolution imageThe ratio of the experimental NC [Fig. 2(a)] and reconstructed spectra [Fig. 2(b)], which should yield κ, are displayed in Fig. 2(c). The series of ratio spectra yields values of approximately 1.0, independent of the bias voltage, in a wide frequency range. The deviation of the ratio from 1.0 at very low frequencies can be attributed to a smaller p, indicating a contribution from two-dimensional thermal diffusion. For the HOD, all the input power is assumed to be converted to heat flux, so ϕ = 1, and the temperature coefficient of Y was measured to be γ ∼ 0.05/K. Considering these factors, CQ(1) was calculated to be 0.05 J/K. The frequency 0.16 Hz (ω = 1) is smaller than the inverse of the characteristic time τch = 1 s. Hence, the volume for CQ(1) is estimated as 0.8 × πr2 mm3. Assuming a heat capacity of 2 × 10⁶ J/(K m3), which is typical of glass substrates, CQ(1) = 0.05 gives a value of r = 3 mm. The estimated size corresponds well to the real active area size (2 × 2 mm2) of the HOD. The reasonable values of κ, independent of the bias voltage in a wide frequency range, demonstrate the successful reconstruction of the NC based on the model of Eq. (6). The mechanism by which the self-heating effects couple the real and imaginary parts of C is thus verified experimentally.
According to our model, simple and direct evidence of the self-heating effect exists. Because Eq. (6) includes the dynamic heat capacity CQ(ω), an increase in CQ(ω) is expected to reduce NC. Figure 4 shows the dramatic effects a change in CQ(ω) has on the NC at 7 V; attaching a copper block (10 × 10 × 20 mm3) on top of the glass substrate of the HOD reduces the original NC (marked by crosses) to the line marked by solid circles. The logarithmic plot of −C in the inset of Fig. 4 shows that the NC reduction appears only for frequencies lower than 1 Hz, corresponding to the characteristic time scale τch = 1 s. The characteristic time is needed for the AC heat flux to reach the copper block and induce an AC temperature change in it. Thus, the copper block effectively increases CQ(ω) at frequencies below 1 Hz, which limits the frequency range of the NC reduction. This fact strongly supports our model, i.e., Eq. (6).
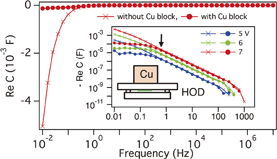
Fig. 4. Effects of changing the heat capacity by attaching a copper block with a heat-conducting tape on top of the HOD, as shown in the inset. Line marked by crosses shows a clear NC at 7 V. When the copper block is introduced, the NC is dramatically reduced (solid circles). Inset shows logarithmic plots of the real parts of −C with and without the copper block at 5, 6, and 7 V. Arrow indicates maximum frequency at which the reduction occurs.
Download figure:
Standard image High-resolution imageThe same procedure was employed for the OLED. Figure 5 shows the capacitance spectra of the OLED with a bias ranging from 0 to 8 V. The real part with a low bias (∼10−9 F, shown in the inset of Fig. 5), is 6 orders of magnitude smaller than the imaginary part with a high bias (∼10−3 F).

Fig. 5. Complex capacitance spectra for OLED with a series of bias voltages. Red and blue lines show the real and imaginary parts of the complex capacitance, respectively. The positive real parts are magnified in the inset.
Download figure:
Standard image High-resolution imageThe NC spectra were reconstructed using the I–V characteristics and real parts of the admittance Y following Eq. (6). The value p, obtained by fitting log(−C) [Fig. 6(a)], was −0.71, indicating that the dimensionality of the thermal diffusion is between one and two for the OLED. The p value is smaller than that of the HOD (−0.55), possibly because of slightly different heat paths in the two devices. Thus, the reconstructed NC spectrum was obtained for each bias voltage Vb as

as shown in Fig. 6(b). The ratio of the −C and −CNC/κ spectra, displayed in Fig. 6(c), yields a value of around 0.5 for κ, independent of the bias voltage. One of the reasons κ is smaller than the value for the HOD (∼1) is the decrease in ϕ owing to power dissipation through light emission in the OLEDs. Another possible reason is the smaller p, which suggests more high-dimensional thermal diffusion, and thus a larger CQ(1). The fine structures in the ratio spectra [Fig. 6(c)], which are absent from those of the HOD, suggest the appearance of some hidden device-specific information reflecting the detailed behaviors of charge carriers in the multilayered OLED.

Fig. 6. (a) Logarithmic plot of observed NC (real part of −C) for OLED with a bias ranging from 5.5 to 8.0 V. Fitting (black) line indicates the power law corresponding to Eq. (6). (b) Reconstructed NC following the self-heating model using exactly the same procedure as for HOD. (c) Ratio of observed to reconstructed NC, which should yield constant parameters ϕγ/CQ(1) in Eq. (6).
Download figure:
Standard image High-resolution image
The NC was reduced when a copper block was attached on top of the device for both the OLED and the HOD. Changing the heat capacity of a device can be a simple test to check whether the NC stems from the self-heating effect. For both the HOD and the OLED, the NC is universally explained by the self-heating of the devices, even though the electronic processes — carrier injection, transport, and recombination — differ greatly between the two.
The reconstruction of the NC using the I–V characteristics and the real part of the admittance supports the self-heating effects through a temperature-modulated admittance for both the HOD and the OLED. In addition, the reduction in NC obtained by increasing the heat capacity of the substrates verifies the self-heating effects simply and directly. The self-heating effects are determined by the I–V characteristics, admittance, and heat capacity of the devices, regardless of device details such as the carrier injection mechanism. The generic effects are applicable not only to organic electronic devices but also to a variety of devices in which the Joule heat is not negligible. Finally, we emphasize that caution is needed when analyzing the capacitance of semiconductor devices, such as LEDs, photovoltaic cells, and transistors, at low frequencies with high bias. The careful elimination of self-heating effects is crucial to extract device-specific information using impedance spectroscopy.
Acknowledgments
The authors thank H. Ohata, Y. Kitago, T. Kubo, K. Katagi, T. Yoshioka, and S. Miyaguchi for fabricating the devices. This work was conducted under "Development of Fundamental Evaluation Technology for Next-generation Chemical Materials" commissioned by the New Energy and Industrial Technology Development Organization (NEDO), Japan.