
Abstract
The temperature (T) dependence of the sodium ion diffusion coefficient D of a NaxMnO2 thin film is extensively investigated versus x and T using electrochemical impedance spectroscopy. D is found to be 5.0 × 10⁻¹¹ cm2/s at x = 0.54 at 301 K, which is much larger than the value of 0.7 × 10⁻¹¹ cm2/s at x = 0.54 at 303 K of a NaxCoO2 thin film. In addition, the activation energy  of D (= 0.26–0.32 eV) is smaller than that of NaxCoO2 (= 0.31–0.44 eV). The improved Na+ diffusion properties of NaxMnO2 are interpreted in terms of the larger interlayer distance (d = 5.54 Å) of NaxMnO2.
Export citation and abstract BibTeX RIS
P2-type NaxMO2 (M: transition metal element) with a layered structure is not only a fascinating electronic material that exhibits large thermoelectricity1) and superconductivity,2) but also a possible candidate for the cathode material in sodium-ion secondary batteries (SIBs).3–8) In particular, Na0.6MnO2 exhibits a large capacity of 140 mAh/g and an average operating voltage Vav of ∼2.5 V.7) Na0.74CoO2 also exhibits a good capacity of 120 mAh/g (Vav ∼ 3.0 V) and good cyclability, with a loss of less than 4% after 40 cycles.8) P2-type NaxMO2 exhibits alternately stacked MO2 layers and Na sheets with an ABBA oxygen stacking sequence.9) The MO2 layer consists of edge-sharing MO6 octahedra. The sodium atom is surrounded by six oxygens, and they form a NaO6 prismatic structure in the P2-type structure, whereas Li and six oxygens form a LiO6 octahedron in LixCoO2.
The sodium ion diffusion coefficient D is an important parameter that governs the critical discharge rate νc according to the relationship νc = 4D/L2, where L is the diffusion length, in a one-dimensional (1D) diffusion model.10) In the Na+-diffusion process, thermally activated Na+ jumps to a nearest-neighbor site beyond a potential barrier. Recently, Shibata et al. experimentally determined the D value of a NaxCoO2 thin film using electrochemical impedance spectroscopy (EIS).11) The magnitude of D was found to be (0.7–1.9) × 11−11 cm2/s at 0.54 ≤ x ≤ 0.85 at 303 K. They also reported that the activation energy decreases significantly from 0.51 eV at x = 0.85 to 0.32 eV at x = 0.54. These features were interpreted as an increase in the interlayer distance (d ≡ c/2, where c is the c-axis lattice constant) with a decrease in x.11) P2-type NaxMnO2 is an alternative candidate for the cathode material in SIBs because it exhibits a high capacity, comparable to that of NaxCoO2. In addition, the material does not contain costly Co.
In this paper, we evaluate the magnitudes of D and the charge-transfer resistance RCT in a well-characterized NaxMnO2 thin film prepared by pulsed laser deposition (PLD). The magnitude of D (RCT) is (1.0–1.4) × 10−10 cm2/s (45.0–55.7 Ω cm2) for 0.49 ≤ x ≤ 0.75 at 329 K. This value is significantly larger (smaller) than that for NaxCoO2 at 328 K.11) We interpret the improved Na+ diffusion properties in terms of the larger interlayer distance (d = 5.54 Å) between the neighboring Mn sheets.
A thin film of Na0.58MnO2 was grown on a Au-deposited MgO(100) substrate at 800 °C and an oxygen partial pressure of 100 Pa for 30 min by PLD. The Na concentration (x = 0.58) of the as-grown film was evaluated in terms of the spontaneous potential (= 2.70 V) versus that of Na metal and is close to the value of the target, x = 0.59. The target, whose thickness and diameter were 2 and 10 mm, respectively, was prepared by sintering Na0.59MnO2 powder. The synthesis condition and characterization of the Na0.59MnO2 powder are described elsewhere.12) The distance between the target and substrate was kept at 35 mm. A yttrium aluminum garnet (YAG) laser with a wavelength of 532 nm was used in the deposition. The laser intensity and repetition frequency were ∼1.7 J/cm2 and 10 Hz, respectively. The film thickness was evaluated to be 220 nm using a cross-sectional scanning electron microscope (SEM) image, and the film area was 0.45 cm2. The crystal structure and surface morphology were characterized by the X-ray diffraction (XRD) patterns obtained with Cu Kα radiation (Rigaku RINT2000PC) and SEM (TECHNEX Mighty-8).
Electrochemical measurements were conducted using a potentiostat (Bio-Logic SP-150) in an Ar-filled glove box using a beaker-type cell. The cathode, anode, and electrolyte were the Na0.58MnO2 thin film, Na metal, and propylene carbonate (PC) containing 1 mol/L NaClO4, respectively. The charge/discharge current density was 1 µA/cm2 to 4 mA/cm2 (0.13–520 C), and the cut-off voltages were 1.5 and 3.8 V. The EIS measurements were conducted in the frequency range from 5 mHz to 200 kHz with an amplitude of 30 mV at various temperatures (301 ≤ T ≤ 355 K).
Figure 1 shows the XRD pattern of the as-prepared Na0.58MnO2 thin film. The (002) and (004) peaks are clearly observed, indicating a c-axis orientation. A c-axis orientation was also observed in a NaxCoO2 film.6) The c-axis lattice constant c was evaluated to be 11.13 Å, which is consistent with that of NaxMnO2 with x ∼ 0.58.12) No impurity peaks were observed. The inset of Fig. 1 shows a surface SEM image of the thin film. The grain size was roughly evaluated to be ∼150 nm.
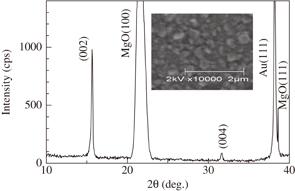
Fig. 1. (a) XRD pattern of as-prepared Na0.58MnO2 thin film. Inset shows a surface SEM image of the film.
Download figure:
Standard image High-resolution imageFigure 2(a) shows the discharge curves of the thin-film electrode at various discharge rates ν. These curves were measured after the charge process at 0.2 C. The discharge curve at 0.2 C well reproduces the curve of NaxMnO2 powder.12) The capacity Q at 0.13 C is Q ∼ 145 mAh/g, which corresponds to an x variation of 0.6. Figure 2(b) shows the discharge capacity QD as a function of ν for the NaxMnO2 thin film. QD decreases linearly with ν and then drops steeply at νc = 200 C. If we assume a 1D diffusion process, the Na+ diffusion constant is roughly estimated to be D (= νcL2/4) ∼ 6.7 × 10⁻¹² cm2/s.

Download figure:
Standard image High-resolution image
Fig. 2. (a) Discharge curves of thin film electrode of NaxMnO2 at various discharge rates ν. (b) Discharge capacity QD versus ν.
Download figure:
Standard image High-resolution imageFigure 3(a) shows the discharge curve at 0.5 C of the thin-film electrode after the charge process at 0.5 C. The arrows in Fig. 3(a) indicate the EIS measurement points.
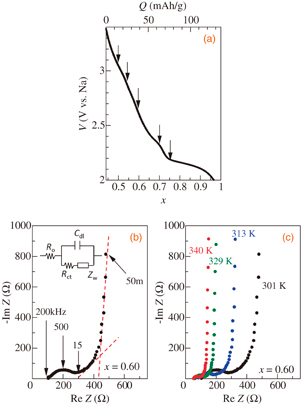
Fig. 3. (a) Discharge curve of NaxMnO2 thin film as a function of x at 0.5 C. Arrows indicate x values at which EIS measurements were performed. (b) Nyquist plot for x = 0.60 at 301 K. Broken lines are the results of least-squares fitting for the Warburg impedance region and low-frequency region. Inset in (b) shows the Randles equivalent circuit. (c) Nyquist plots for x = 0.60 at various temperatures.
Download figure:
Standard image High-resolution imageFigure 3(b) shows the Nyquist plot for x = 0.60 at 301 K. In the high-frequency region, the impedance spectrum exhibits semicircles with a radius of ∼100 Ω. Then, the impedance spectrum shows a straight line at an angle of 45° with respect to the horizontal axis in the medium-frequency region. At low frequencies, it seems to diverge with decreasing frequency. This behavior is quantitatively explained by the Randle's equivalent circuit shown in the inset of Fig. 3(b).13) This equivalent circuit consists of the uncompensated ohmic resistance RO of the electrolyte and electrode, the charge-transfer resistance RCT across the electrolyte–electrode interface, the double layer capacitance Cdl at the electrolyte–electrode interface, and the complex impedance (Warburg impedance) ZW arising from ionic diffusion at low frequencies. The semicircle at high frequencies is due to the parallel combination of Cdl and RCT. The left and right edges of the semicircle correspond to RO and RO + RCT, respectively. At x = 0.60 at 301 K, RO, RO + RCT, and Cdl are 103.1 Ω, 293.5 Ω, and 2.7 µF, respectively. In the medium-frequency region, the linear-like impedance spectrum corresponds to the ionic diffusion process. The straight line with an angle of 45° with respect to the horizontal axis is attributed to semi-infinite Na+ ion diffusion. The divergent impedance spectrum at low frequencies corresponds to finite Na+ ion diffusion. The intersection of the horizontal axis and the broken line corresponds to RO + RCT + RL, the value of which is 440 Ω for x = 0.60. RL is the limiting low-frequency resistance. By solving Fick's second law with proper initial and boundary conditions, ZW is expressed as
where i, L0, and f are the imaginary unit, thickness of the thin film, and frequency, respectively. Thus, the diffusion coefficient was evaluated using the slope of the broken line. D is evaluated to be 4.4 × 10⁻¹¹ cm2/s for x = 0.60 at 301 K. With increasing T, the divergent spectrum at low frequencies shifts to the left side [Fig. 3(c)], and the semicircle at high frequencies becomes small. This indicates that RCT decreases with T.
Figure 4 shows the temperature dependence of (a) D and (b) RCT for various values of x. The data were plotted using a logarithmic scale on the vertical axis and the reciprocal of the temperature on the horizontal axis. Because ln D (ln RCT) decreases (increases) linearly versus 1/T, the data were least-squares fitted with an activation-type function as

where  (
( ) and kB represent the activation energy of D (RCT) and the Boltzmann constant, respectively. The broken lines represent the results of least-squares fittings.

Fig. 4. Temperature (T) dependence of (a) sodium ion diffusion coefficient D and (b) charge-transfer resistance RCT for various values of x. Broken lines represent the results of least-squares fittings.
Download figure:
Standard image High-resolution imageIn Figs. 5(a) and 5(b), we compare D and RCT for NaxMnO2 at 329 K with those for NaxCoO211) at 328 K.14) The magnitudes of D for NaxMnO2 are much larger than those for NaxCoO2, although the data are somewhat scattered. On the other hand, the magnitudes of RCT for NaxMnO2 are significantly smaller than those for NaxCoO2. As discussed below, the larger (smaller) D (RCT) is ascribed to the larger interlayer distance d in NaxMnO2.

Download figure:
Standard image High-resolution image
Fig. 5. (a) D, (b) RCT, and activation energies ( and
and  ) of (c) D and (d) RCT versus x. Data for NaxCoO2 were taken from Ref. 11.
Download figure:
Standard image High-resolution image
Figures 5(c) and 5(d) show  and
and  for NaxMnO2 versus x. The magnitudes of
  for NaxMnO2 are slightly smaller than those for NaxCoO2, although the data are somewhat scattered. The magnitudes of
  are also slightly smaller than those for NaxCoO2. We ascribed the smaller
  and
and  for NaxMnO2 to the structural difference between NaxMnO2 and NaxCoO2; Shimono et al.12) reported that the d value of NaxMnO2 (d = 5.54 Å at x = 0.71) is larger than that of NaxCoO2 (d = 5.44 Å at x = 0.71). When a Na+ ion hops to the next Na site for diffusion, it must run close to four oxygens on a lateral surface of a NaO6 prism. The four oxygens produce a Lennard-Jones potential originating in the Pauli exclusion principle.15) The potential has a minimum at the center of the four oxygens. Thus, the Na+ ion will pass at the center. The height of the potential energy at the center corresponds to a potential barrier (
 ) for diffusion. When d is elongated, the height of the potential decreases, leading to a small
  . A similar scenario is applicable to
  because the Na+ ion would feel a weaker repulsive interaction from the surrounding oxygens when it intercalates between the MnO2 sheets. This argument is consistent with the findings of Kang and Ceder,16) who performed a first-principle calculation for LiCoO2 and reported that the activation energy for the Li+ diffusion constant increases with decreasing d.
In summary, we experimentally determined D and RCT versus x for NaxMnO2 and compared the values with those of NaxCoO2.11) The magnitude of D is (1.0–1.4) × 10−10 cm2/s (0.49 ≤ x ≤ 0.75) at 329 K, which is one order of magnitude larger than that of NaxCoO2 in the same x range at 328 K. The magnitude of RCT is 45.0–55.7 Ω cm2 (0.49 ≤ x ≤ 0.75) at 329 K, which is smaller than that of NaxCoO2 in the same x range at 328 K. The enhanced D (suppressed RCT) was interpreted in terms of the wider interlayer distance d between neighboring Mn sheets, which resulted in a lower potential barrier between neighboring Na sites.
Acknowledgment
We thank T. Shimono and D. Tanabe for technical support. This work was supported by a Grant-in-Aid for Scientific Research (23684022) from the Ministry of Education, Culture, Sports, Science and Technology, Japan (MEXT).