
Abstract
Molybdenum ditelluride (MoTe2) is known to have two different crystal phases: α-MoTe2 and β-MoTe2. α-MoTe2 is the polytype stable below 815 °C, and β-MoTe2 is stable above 900 °C. Here, we report changes in the structure and composition of each single crystal during heating in low and high vacuum conditions. Contrary to the results of a recently published paper, we did not observe α-MoTe2 transforming to β-MoTe2 at elevated temperatures. In a low vacuum, the α-MoTe2 sample was mainly oxidized, forming MoO2. In a high vacuum, it partially decomposed with surface oxidation. The recently reported "reversible phase transition" of α-MoTe2 is the misinterpretation of X-ray diffraction data.
Export citation and abstract BibTeX RIS
Transition metal dichalcogenides (TMDCs) have recently attracted remarkable attention for a number of applications,1–8) because TMDCs have a finite energy band gap, which graphene lacks. Among TMDCs, MoTe2 has a unique property: a thermally induced structural phase transition. The diamagnetic semiconductor α-MoTe2 is the polytype that is stable below 815 °C, and it has a 2H-type trigonal prismatic unit layer structure [Fig. 1(a)].9–17) In contrast, the paramagnetic semimetal β-MoTe2 is stable above 900 °C, and it has a distorted CdI2-type unit layer structure with one-dimensional zigzag chains of Mo atoms [Fig. 1(b)], the so-called 1T'-type structure.18–20) α-MoTe2 has a direct band gap of 1.1 eV in monolayer form, which is smaller than that of other TMDCs such as MoS2 and WSe2 (1.8 and 1.6 eV, respectively), and it has been utilized as the channel material of field-effect transistors (FETs).21–26) On the other hand, β-MoTe2 is expected to be a stable source material to realize a quantum spin Hall-effect device.27) Usually, artificial MoTe2 single crystals are grown by a chemical vapor transport (CVT) method.28) MoTe2 powder and a halogen (Br2 or I2) are sealed in a quartz ampoule under vacuum, and the ampoule is heated in a tube furnace containing a temperature gradient. Then, volatile molybdenum halides and tellurium diffuse in the gaseous form from the hot part of the ampoule (T = TH) and crystallize as single-crystalline MoTe2 at the cold part of the ampoule (T = TL). One can obtain single crystals of α-MoTe2 by slowly cooling the quartz ampoule after the CVT growth.28) In order to obtain β-MoTe2 single crystals, the ampoule must be quenched from a temperature higher than 900 °C to room temperature as quickly as possible.28)

Fig. 1. Crystal structures of α-MoTe2 and β-MoTe2.
Download figure:
Standard image High-resolution imageIn the case of FET application of TMDC, it is crucial to grow a high-quality insulator film on the surface of the TMDC. The simplest approach to growing an insulating oxide on a semiconducting material is thermal oxidation of the surface. Thus, we have much interest in the surface reaction of TMDCs under various environments. Our collaborators recently reported the surface reaction of WSe2 at elevated temperatures under the exposure to ozone.29) Layer-by-layer oxidation of WSe2 up to trilayers from the surface was observed at higher temperatures. In the case of MoTe2, not only the surface reaction itself, but also the difference in the reaction process of α- and β-MoTe2, which have different crystal and electronic band structures, is also of great interest.
It was recently reported, however, that α-MoTe2 single crystals, which were grown by a flux method, revealed a "reversible phase transition".30) The authors claimed, based on their X-ray diffraction (XRD) measurements, that α-MoTe2 transformed to β-MoTe2 when it was annealed above 500 °C in the XRD sample chamber, and recovered the α-MoTe2 structure during the slow cooling from the high temperature. Keum et al.30) showed only XRD patterns measured during the heating of α-MoTe2 to prove the phase transition, and no side reaction during the measurement was reported. However, the XRD patterns were recorded using an "Anton-Paar domed hot stage attachment", which only enables the vacuum condition of about 1 × 10⁻² mbar.31) In such a low vacuum, MoTe2 samples may be degraded during the high-temperature XRD measurement. Furthermore, there were two doubtful points in the XRD data shown in the supporting information of Keum et al.30) First, the 002 diffraction peak of 2H α-MoTe2 disappeared above 500 °C without the appearance of a 002 peak of 1T' β-MoTe2. Second, the XRD peak that appeared around 2θ = 26.1° above 500 °C was labelled as "004 of 1T' phase", but the 004 peak should appear at 2θ = 25.74° if the diffraction angle is calculated from the crystallographic parameter of β-MoTe2, c = 1.386 nm.18) These two problems suggested to us that the material formed during the high-temperature XRD measurement was not 1T' β-MoTe2. Here, we report verification of the thermal transition of α- and β-MoTe2 single crystals in vacuum conditions using our high-temperature XRD system. In order to check the surface composition and chemical states, X-ray photoelectron spectroscopy (XPS) measurements were also performed.
Our XRD (Bruker D8 Advance) is equipped with a high-vacuum-type hot stage (Anton-Paar HTK 1200N), which enables a better vacuum environment (1 × 10⁻⁴ mbar)32) than the dome-type attachment. α- and β-MoTe2 single crystals were grown by CVT using Br2 as the transport agent. MoTe2 source powder was synthesized from Mo powder (99.9+%, Nilaco) and Te shots (99.9999%, Nilaco) by heating them at 900 °C for 1 week in a vacuum-sealed quartz ampoule. α-MoTe2 was grown under the temperature gradient of TH = 900 °C and TL = 700 °C for 1 week, and the ampoule was slowly cooled after the growth. β-MoTe2 was grown under TH = 1000 °C and TL = 900 °C for 1 week, and the ampoule was quickly quenched in water. For the XRD measurement, each single-crystal flake (∼1 mm wide) was placed on a small SiO2 (285 nm)/Si (500 µm) wafer and set onto the alumina hot stage of the HTK 1200N. The SiO2/Si wafer blocks diffraction from the alumina stage. During the XRD measurement, the HTK 1200N was evacuated by a rotary pump (RP), or a combination of a RP and a turbo molecular pump (TMP). The vacuum pressures during the measurement were around 1 × 100 Pa and 1 × 10⁻² Pa using the RP and RP–TMP combination, respectively. Under these vacuum conditions, oxygen partial pressures were estimated to be 2 × 10⁻¹ Pa and 2 × 10⁻³ Pa, respectively. Hereafter, these vacuum conditions are abbreviated as "∼100 Pa" and "∼10−2 Pa", respectively. During the high-temperature XRD measurement, the sample temperature setting was increased by 10 °C/min and decreased by 2 °C/min between 25 and 650 °C.
Figure 2 shows XRD patterns of α- and β-MoTe2 single crystals before and after the annealing at 650 °C in vacuum conditions of ∼10−2 and ∼100 Pa. Before the annealing, XRD patterns of both crystals [patterns (A), (C), (E), and (G)] agreed well with those in the literature.9,18) In the vacuum of ∼10−2 Pa, the intensity of the 002 and 004 diffraction peaks of both crystals [in patterns (B) and (F)] became smaller after the annealing, which suggests the decomposition of crystals. On the other hand, in the vacuum of ∼100 Pa, the 002 peak of α-MoTe2 in the pattern (D) became very weak and that of β-MoTe2 in the pattern (H) almost disappeared. In the pattern (D) of α-MoTe2, a new peak appeared at the right side of the weakened 004 peak. In the pattern (H) of β-MoTe2, in contrast, only one peak existed around 2θ = 26°, and its position was almost the same as that of the above-mentioned new peak of α-MoTe2 [see pattern (H) and copied pattern (D) in Fig. 2]. Here, it must be noted that the 2θ angles of these peaks were slightly larger than that of the 004 peak of β-MoTe2, as indicated by a vertical red line from (H) to (G) in the figure.

Fig. 2. XRD patterns of α-MoTe2 (A–D) and β-MoTe2 (E–H) before and after the annealing at 650 °C in vacuum conditions. (A, E) Before annealing in ∼10−2 Pa. (B, F) After annealing (A, E) in ∼10−2 Pa. (C, G) Before annealing in ∼100 Pa. (D, H) After annealing (C, G) in ∼100 Pa. Comparison of the XRD peak intensity is adequate only between each pair of (A, B), (C, D), (E, F), or (G, H). The XRD pattern (D) is copied just above the pattern (H) for comparison.
Download figure:
Standard image High-resolution imageIn order to observe the peak positions in detail, XRD patterns with a narrow 2θ range (25.0–26.2°) including the 004 diffraction peaks of α- and β-MoTe2 were measured, as shown in Fig. 3. They were observed during the heating and cooling of α- and β-MoTe2 crystals between 25 and 650 °C in each vacuum condition. Differences in the full width at half maximum (FWHM) of XRD peaks observed before the heating mainly came from the fluctuation in the thickness of each single-crystal flake inside of the measured area; a more uniform thickness of the sample flake makes the FWHM narrower. In the case of α-MoTe2 in ∼10−2 Pa [group (A)], shifts of the 004 peak due to thermal expansion were clearly observed, but no new peak appeared during the observation. The amount of the c-axis thermal expansion of α-MoTe2 during the heating from 25 to 650 °C was calculated to be 0.010 nm using the 004 peak shift. We could find no previously measured high-temperature XRD data for α-MoTe2, but this expansion value is close to the reported values for 2H-MoS2, 2H-MoSe2, and 2H-WSe2.33) Therefore, our interpretation is that the observed 004 peak shift during the annealing really comes from the thermal expansion of the α-MoTe2 single crystal.
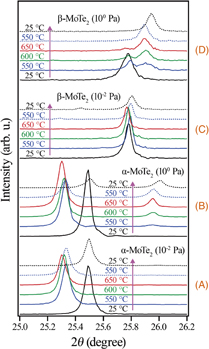
Fig. 3. Change of XRD patterns of (A, B) α-MoTe2 and (C, D) β-MoTe2 during the heating and cooling between 25 and 650 °C in (A, C) ∼10−2 Pa and (B, D) ∼100 Pa.
Download figure:
Standard image High-resolution imageIn the case of β-MoTe2 in ∼10−2 Pa [group (C)], small peaks could be seen around 2θ = 25.4° after the annealing. These peaks may come from desorption of Te, or from a partial phase transition from the metastable β- phase to the stable α-phase during the cooling. In the cases of annealing α-MoTe2 and β-MoTe2 in ∼100 Pa [group (B) and (D), respectively], new peaks could be observed around 2θ = 25.9–26.0°, and these peaks were distinctly different from the 004 peak of β-MoTe2 (2θ = 25.74°).18) Two separate peaks could be recognized in each XRD pattern of β-MoTe2 during the heating at 550 and 650 °C in ∼100 Pa.
From these XRD observations, it is clearly concluded that the reported phase transition from 2H (α) to 1T' (β) in Keum et al.30) is the misinterpretation of XRD data. Keum et al.30) possibly assumed that the new peak appearing around 2θ = 26° in the XRD of α-MoTe2 heated above 500 °C is the 004 peak of 1T' β-MoTe2, but our observations are inconsistent with this assumption. In the literature, it was reported that the Cu Kα XRD pattern of MoO2 shows an intense peak of 110 and 011 diffractions at 2θ = 26.005° (ICDD 01-074-6246).34) Therefore, it is supposed that the new XRD peak originates from the bulk MoO2 phase produced by the oxidation of MoTe2 during the annealing in a poor vacuum, ∼100 Pa. Here, the new "MoO2" peak observed for β-MoTe2 annealed in ∼100 Pa had a slightly smaller diffraction angle than that of α-MoTe2. This shift may be caused by the further oxidation of MoO2 derived from β-MoTe2 to Mo2O5 or MoO3. Otherwise, the distorted CdI2 structure of β-MoTe2 may have resulted in a somewhat different MoO2 structure after the oxidation in ∼100 Pa.
In order to further characterize the oxidized molybdenum phase, XPS spectra of α-MoTe2 crystals were measured before and after the annealing of the XRD measurement at 650 °C in ∼10−2 and ∼100 Pa. Spectra were measured using a Kratos AXIS Nova equipped with a monochromatic Al Kα X-ray source, and the pass-energy of the spectrometer was set to 160 or 20 eV for the survey or core spectrum measurement, respectively. In Fig. 4, (A) shows the survey spectra, (B) shows the Mo 3d core region spectra, and (C) shows the Te 3d core region spectra. In Fig. 4(A), the three spectra are each normalized by the height of the Mo 3d peak. In Fig. 4(B), the intensities of spectra (b) and (c) are multiplied by 1.5 compared to that of the spectrum (a) to enlarge observed peaks. In Fig. 4(C), similarly, the intensities of spectra (b) and (c) are multiplied by 30 compared to that of the spectrum (a).

Fig. 4. (A) XPS survey spectra, (B) Mo 3d core XPS spectra, and (C) Te 3d core XPS spectra of α-MoTe2 surfaces before and after the annealing at 650 °C. In each figure, (a) spectrum of a cleaved clean surface, (b) spectrum after annealing in ∼10−2 Pa, and (c) spectrum after annealing in ∼100 Pa. Peak fitting was calculated under the assumption of the peak separation of 3.13 eV for Mo 3d5/2 and 3d3/2 and 10.39 eV for Te 3d5/2 and 3d3/2, respectively, and the peak area ratio of  for 3d5/2:3d3/2. In (A), the three spectra are normalized by the height of the Mo 3d peaks. In (B), the intensities of spectra (b) and (c) are multiplied by 1.5 compared to that of the spectrum (a) to enlarge observed peaks. In (C), similarly, the intensities of spectra (b) and (c) are multiplied by 30 compared to that of the spectrum (a). The multiplication values are indicated as "× 1", "× 1.5", and "× 30". The inset of (B) shows enlarged spectra of (b) and (c) between 228 and 229 eV of the binding energy.
Download figure:
Standard image High-resolution image
As shown in Fig. 4(A), the intensities of Te-related peaks were drastically reduced after the vacuum annealing, and in ∼100 Pa Te almost disappeared from the surface. Instead, large peaks of O 1s appeared after the annealing, which suggests partial decomposition and the surface oxidation of α-MoTe2 crystals. The Mo 3d core spectra, shown in Fig. 4(B), also suggest that α-MoTe2 close to the crystal surface was decomposed by the annealing, since the Mo 3d5/2 peak coming from MoTe2, which had appeared at the binding energy (BE) of 228.5 eV,35) became very weak after the annealing in ∼10−2 Pa, and completely disappeared after the annealing in ∼100 Pa [see inset in Fig. 4(B)]. After the annealing in ∼10−2 Pa, a large Mo 3d5/2 peak originating from MoO235,36) could be seen at BE = 229.6 eV, which suggests the oxidation of surface molybdenum to MoO2, although no bulk MoO2 phase was detected by XRD. In the higher BE region, another component of Mo 3d existed, labeled as "MoO3−x". This component had a little higher binding energy after the annealing in ∼100 Pa than in ∼10−2 Pa, but this BE in ∼100 Pa was still slightly smaller than that of the Mo 3d5/2 peak of MoO3, which should appear at BE = 232.65 eV.35,36)
From these XRD and XPS results, it is concluded that the annealing in ∼10−2 Pa decomposed only the surface of α-MoTe2 and the surface Mo mainly formed MoO2. Some Mo atoms were further oxidized and a complicated mixture of MoO2, Mo2O5, and MoO3 was composed on the surface. Nonstoichiometric oxides might be included, too. In ∼100 Pa, almost the whole α-MoTe2 crystal was oxidized to MoO2, which was detectable by XRD, and its surface had a little more MoO3 than in ∼10−2 Pa. Additionally, Fig. 4(C) also reveals that the remaining Te formed MoTe2 and TeO235,36) in ∼10−2 Pa, and almost all Te atoms desorbed from the surface in ∼100 Pa. Here, the two peaks coming from MoTe2 in the spectrum (b) of Fig. 4(C) look larger than the above-mentioned MoTe2 peaks in Fig. 4(B). This is because the intensity of spectra (b) and (c) of Fig. 4(C) is multiplied by 30, and the sensitivity of Te 3d is far larger than that of Mo 3d.
These results clearly prove the impossibility of the phase transition of α-MoTe2 to β-MoTe2 during the heating in the vacuum condition. As for the surface reaction of the α-MoTe2 single crystal in ∼10−2 Pa, the oxidation of Mo and Te observed by XPS might occur not during the high-temperature XRD measurement, but when the sample was exposed to air while transferring samples from XRD to XPS. It is obvious from XRD measurement results that α-MoTe2 was almost completely oxidized to MoO2 during the annealing in ∼100 Pa. In order to thoroughly investigate the surface reaction in the high vacuum condition, experiments of in situ vacuum annealing of MoTe2 samples just before the XPS measurement is under preparation.
In conclusion, we characterized changes in the structure and composition of α- and β-MoTe2 single crystals during the heating in low and high vacuum conditions by XRD and XPS measurements. Contrary to the results of a recently published paper,30) α-MoTe2 never transformed to β-MoTe2 at the elevated temperature; in a low vacuum (∼100 Pa) it was mainly oxidized to MoO2, and in a high vacuum (∼10−2 Pa) it partially decomposed and its surface was oxidized to MoO2. The reported "reversible phase transition"30) of α-MoTe2 is the misinterpretation of XRD data.
Acknowledgments
We would like to thank Dr. M. Tokunaga and Dr. M. Yasutake (CACS, Saitama University) for their assistance in XRD and XPS measurements. This work is supported by a Grant-in-Aid for Scientific Research on Innovative Areas "Science of Atomic Layers (SATL)" (KAKENHI Grant No. 25107004) from the Japan Society for the Promotion of Science (JSPS).