Abstract
The equilibrium position of an aerosol droplet trapped in a counter-propagating Bessel beam and gas flow is studied both experimentally and theoretically. This provides an aerosol analogue to the separation of particles of differing size and refractive index in counter-propagating laser beam and liquid flow, referred to as optical chromatography. Using the model system of a pure glycerol droplet it is found that, as evaporation takes place and the size of the droplet decreases, the size-dependent equilibrium position does not change in a simple monotonic fashion. Instead, the position of the droplet is greatly affected by the excitation of whispering gallery modes. This leads to sharp peaks in the equilibrium position curve, not unlike those that occur in single particle spectroscopy. The conditions necessary to excite whispering gallery modes are thoroughly investigated.
Export citation and abstract BibTeX RIS

Content from this work may be used under the terms of the Creative Commons Attribution 3.0 licence. Any further distribution of this work must maintain attribution to the author(s) and the title of the work, journal citation and DOI.
This article is was made open access on 29 December 2014
1. Introduction
The manipulation of nano- and micro-objects using light is at the heart of many mature and emerging areas of research. The use of light to levitate particles [1] and the realization of optical tweezers [2] demonstrated that precise optical control of micro-particles was possible. These tools have found enormous success in biological applications such as in the manipulation and mechanical characterization of cells [3], and in single molecule studies such as monitoring the movements of motor proteins [4–6] and mapping the energy landscapes of nucleic acids [7, 8]. Beyond this, new tools such as holographic optical tweezers [9–12] and the study of novel effects such as optical binding [13, 14] have also been developed and explored.
The use of optical forces to sort and separate particles of different refractive index and size is also of increasing interest [15, 16]. A fine example of the ingenuity within this field is the technique referred to as optical chromatography. Developed by Imasaka et al [17, 18], the opposing hydrodynamic and optical forces lead to size-dependent equilibrium positions for particles flowing against the propagation direction of a weakly diverging laser beam. Experimentally it was demonstrated that colloidal particles with diamaters that ranged from 1 to 6 μm can be separated spatially by this approach [17, 18]. It has since been shown that it is also possible to concentrate samples with optical chromatography [19] and separate samples based upon differences in refractive index instead of size [20].
In addition to work on solution phase colloids, it has been suggested recently through a detailed modelling study that aerosol particles could be separated using optical chromatography [21]. Figure 1 illustrates the balance between optical and drag forces that can lead to an equilibrium position for an aerosol particle. The equilibrium position will be located along the propagation axis of the incident beam and the jet centerline (which are coincident lines). Both the speed of the gas and the intensity of the incident beam will vary along this longitudinal axis, leading to a complicated relationship between particle size and equilibrium position.

Figure 1. Pictorial representation of optical (the green beam) and drag forces (the blue jet) acting on a droplet. The balance of these opposing forces allows for size-dependent equilibrium positions to exist. The equilibrium position is also referred to as the retention distance.
Download figure:
Standard image High-resolution imageThe equilibrium position (or retention distance) of aerosol droplets in a system such as that shown in figure 1 will be studied here. While previous research involving optical chromatography has focussed on separating mixtures of particles, each of constant size and refractive index, here we track the equilibrium position of a single evaporating droplet composed of pure glycerol. As the glycerol evaporates, the retention distance of the droplet will change due to its decreasing radius. Consequently, the droplet is able to probe the variation in the retention distance over a range of radii. If the rate of change of the radius is slow enough, then the retention distance can be studied in very small steps of radius. It is shown both experimentally and theoretically that the retention distance is not a monotonic function of radius and that whispering gallery modes (WGMs) greatly impact the equilibrium positions.
In all experiments and most of the calculations performed here, a zeroth-order Bessel beam is used. This type of beam is pseudo-nondiffracting meaning that its intensity profile in the transverse plane is propagation invariant over a certain distance [22]. For the systems of curent interest, this propagation distance will be several millimeters. Such a beam has an inherent appeal for use in optical chromatography. Furthermore, the forces in the transverse plane allow for the confinement of sub-micron particles [23, 24], a property that is of great interest in aerosol science [25]. We present calculations for the forces on a droplet in a Bessel beam and thoroughly discuss how WGMs affect these results. We also demonstrate that WGMs, droplet position, and the non-ideal nature of the Bessel beam in the region where the droplet is trapped greatly influence experimental results.
2. Experimental details
We have described the use of Bessel beam traps to manipulate aerosol particles previously and only a brief description will be presented here (a schematic is shown in figure 2) [26, 27]. Laser light (λ = 532 nm, Verdi V5, coherent) was expanded and propagated (in the + z direction) through an axicon (Altechna) to create a Bessel beam. The perpendicular (x axis) polarization of the beam was selected using a polarization beam splitter and passed through two lenses to reduce the Bessel beam core radius by a factor of 1/9. The beam was then directed into an airtight, aluminium trapping cell. See section 3.1 for a discussion of the Bessel beam parameters.
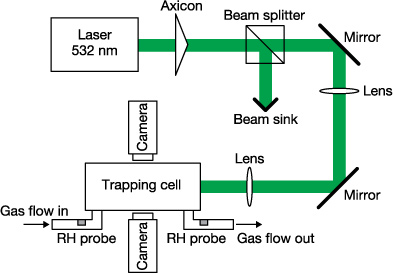
Figure 2. Schematic of the experimental setup. The details of the various components are given in section 2.
Download figure:
Standard image High-resolution imageA constant dry nitrogen flow was passed through the trapping cell using a mass flow controller (MKS) where typically the flow, Q, was 25 cm3 min−1. This flow was directed through a tube (r0 = 0.0075 m) and along the cell opposing the propagation direction of the Bessel beam. A capacitance humidity probe (Honeywell) was used to record the relative humidity over the course of each evaporation experiment. The longitudinal separation between the formation of the Bessel beam and the inlet of the counter-propagating gas flow, d, was measured to be 0.03 m.
Glycerol droplets were nebulised (Omron) using a solution of glycerol in water (80 g l−1) and directed into the cell until a particle became stably trapped due to the forces of the laser and gas flow. The confined droplet quickly lost water as it equilibrated with the low relative humidity of the surroundings.
Images of the droplet were collected and processed using two cameras, each perpendicular to the laser propagation. A microscope objective (MOTIC, NA = 0.42) was used to collect and direct scattered light from the particle onto the first camera (DCC1545M, Thorlabs). Such light collected from a spherical body yields a pattern, commonly called a phase function, and is characteristic of the size and refractive index of the particle [27]. The scattered light intensity was collected over the angular range of 67.5°–112.5° (the z axis lies at 0° and the x axis, where the camera is located, lies at 90°). The droplet size can be obtained by comparison of the collected phase functions to simulations calculated using Mie theory [28]. The real refractive index of the droplet was taken to be that of pure glycerol (n = 1.4746) [29] and the imaginary part was assumed to be negligible at λ = 532 nm. The second camera was used to monitor the changing particle position as it evaporated. The positional data recorded by this camera was calibrated against a graticule in order to define the pixel width of an in-focus image of the particle.
3. Theory
3.1. Bessel beam
An ideal linearly polarized Bessel beam can be described by its amplitude, order, semi-apex angle θ0 and wavenumber k. For a zeroth-order Bessel beam, the intensity profile in the transverse plane will consist of a bright, circular core surrounded by concentric rings of approximately equal power [30, 31]. The Bessel beam itself can be thought of as a superposition of plane waves travelling at an angle θ0 to the longitudinal axis [32]. These plane waves possess equal amplitude and are evenly distributed around all azimuthal angles and, as such, are often viewed as propagating on a cone [30, 33, 34]. The longitudinal and transverse components of the wavevector of the Bessel beam are then defined as kz = k cos θ0 and k⊥ = k sin θ0, respectively.
When a Bessel beam is generated using a Gaussian beam of waist wc passing through an axicon with an internal angle γ and refractive index of nax, the semi-apex angle will be defined as [35]
where n0 is the refractive index of the medium. For small values of θ0, equation (1) will be θ0 ≈ (nax/n0 − 1)γ. A beam generated in this way will not be diffraction free and will have a maximum propagation distance zmax defined as [36]

With these parameters, the expression for the electric field of a zeroth-order Bessel beam that is linearly polarized along the x axis can be written as [23, 35–37]:
where β = sin θ0/(1 + cos θ0),  , and ϕ = arctan (y/x). The unit vectors
  ,
,  , and
, and  are in the Cartesian coordinate system. A time dependence of e−iωt has been omitted. The factor E0 in (3) is chosen so that
  . The relationship between E0 and the power of the Gaussian beam PT is

To obtain beam widths that are suitable for experimental use, the Bessel beam needs to be reduced with a telescope. For a telescope consisting of two lenses with focal lengths f1 and f2 the magnification will be M = f2/f1. The transformation of the Bessel beam parameters are then described by [38]


where  and
and  are the semi-apex angle and beam waist, respectively, after passing through the telescope.
For the setup described in section 2, the calculated values of θ0 and zmax are 0.780° and 550.9 mm, respectively. The values of wc and nax are known to be 7.50 mm and 1.52, respectively. After the Bessel beam is passed through a telescope of magnification M = 1/9 the values of θ0, wc, and zmax become 7.04°, 0.833 mm, and 6.75 mm, respectively. For a beam with an input power of 768 mW and a wavelength of 532.0 nm, the calculated value of E0 after the telescope is 1.10 × 10⁶ V m−1.
3.2. Optical forces
Optical forces were calculated using the equations derived by Barton et al [39]. All beams considered here are propagating in the + z direction so the time averaged longitudinal force 〈Fz〉 is
and the time averaged forces in the transverse plane 〈Fx〉 and 〈Fy〉 are
where the size parameter is α = ka and a is the radius of the sphere. In practical calculations the series in l cannot be evaluated up to l = ∞ and must eventually be truncated. Here, the series was truncated at the integer closest to α + 4α1/3 + 2 [28]. The coefficients alm, blm, Alm, and Blm are defined as


where  , ψl and χl are the Ricatti–Bessel functions,
  is the relative refractive index of the particle, Ylm are the spherical harmonics, primes indicate differentiation with respect to the argument of the given function, H0 = E0/(μ0c), and Er and Hr are the radial components of the incident electric and magnetic fields, respectively, at the surface of the sphere. Equations (11) and (12) were evaluated numerically [40]. The program used to calculate the forces was tested and validated against previously published results for Gaussian [39] and Bessel beams [36, 41]. Additionally, calculations involving a plane wave were performed using Mie theory [28]. All calculations shown in this work were performed on spherical glycerol droplets (n = 1.4746) [29] in air (n0 = 1).
3.3. Drag forces
For a spherical droplet in a gas stream the drag force Fd from Stokes' law is

where μ is the dynamic viscosity of the medium and v is the undisturbed speed of the gas that would be found at the location of the droplet.
The Poiseuillian speed distribution of a free laminar jet is [42]
where zi is the distance from the inlet, Q is the volumetric flow rate through the inlet, η is the kinematic viscosity of the gas, r0 is the radius of the inlet, and r is radial distance from the z axis (the jet centerline). In all calculations, the medium was assumed to be air at a temperature of 298 K and a pressure of 1 atm, yielding viscosities of μ = 1.8 × 10⁻⁵ Pa s and η = 1.5 × 10⁻⁵ m2 s−1 [43]. The values for Q and r0 were given in section 2.
3.4. Equilibrium positions
In the longitudinal direction, the net force Ft that a particle experiences will be

Equilibrium positions will exist when Ft = 0. Figure 3 shows the calculated net force for a droplet with a = 2.0 μm in a Bessel beam. There are two equilibrium positions: one that is unstable (z0 = 0.14 mm) and one that is stable (z0 = 9.38 mm) with the negative slope of the force curve characteristic of a stable restoring force that acts to immobilise the particle at the zero force crossing. By calculating the latter position across a range of radii, the retention behaviour as determined by the variation in equilibrium position with droplet size can be quantified.
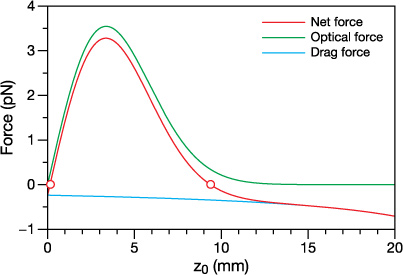
Figure 3. The net force Ft, the longitudinal optical force 〈Fz〉, and the drag force − Fd acting on a glycerol droplet with a = 2.0 μm located on the propagation axis of the Bessel beam (x0 = y0 = 0). Stable (z0 = 9.38 mm) and unstable (z0 = 0.14 mm) equilibrium positions are indicated with open circles. Note that throughout this work the coordinates x0, y0, and z0 indicate the location of the droplet center.
Download figure:
Standard image High-resolution imageWhile there is no drag force in the transverse direction, gravity will be present with the chosen experimental configuration of a horizontally propagating laser beam and gas flow. However, preliminary calculations and testing found the effect of gravity not to be significant and it will subsequently be ignored here. Therefore, in the transverse direction only optical forces need to be considered.
4. Results and discussion
4.1. Transverse optical forces
Figure 4(a) shows the transverse force that droplets of several different radii experience as they are displaced along the x axis (the polarization axis of the zeroth-order Bessel beam) while remaining at z0 = zmax/2 and y0 = 0. The corresponding potential energy curves are shown in figure 4(b). Washboard-like potentials [22, 36, 44] are observed in figure 4(b) where the barrier to escape a local energy minimum is always smaller when moving towards the center of the beam (x = 0) than it is moving away from the center. Therefore, in the transverse direction of the Bessel beam, droplets will be guided towards the center of the beam [22, 36, 44].
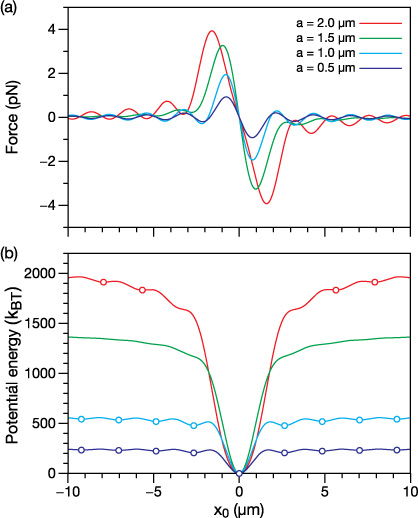
Figure 4. Calculated (a) force and (b) potential energy for spheres of radii a = 0.5, 1.0, 1.5, and 2.0 μm. Droplets are positioned at z0 = zmax/2, y0 = 0 and displaced along the x axis (the polarization axis of the Bessel beam). In (b) open circles indicate stable equilibrium positions (minima in the potential energy curve). The potential energy was calculated using  where Fx(x) is the force in the x direction when y0 = 0 and z0 = zmax/2. For the calculation of kBT a temperature of T = 298 K was used.
Download figure:
Standard image High-resolution imageMinima in the potential energy curves are located at positions that approximately correspond to intensity maxima in the rings of the Bessel beam, suggesting that droplets will preferentially adopt equilibrium positions in regions of maximum light intensity. However, not every intensity maximum in the Bessel beam has an associated minimum in the potential energy curve. For instance, in figure 4(b) the only equilibrium position for the a = 1.5 μm curve is at x0 = 0 which coincides with the center of the core of the Bessel beam. If a droplet with a radius that is initially greater than 1.5 μm is trapped in the Bessel beam and its radius were to slowly decrease (e.g. through evaporation), then it will eventually be confined along the x axis at x0 = 0 (as its radius approaches 1.5 μm). Once located at x0 = 0, the droplet will unlikely be able to access any of the local energy minima seen in the curves for a = 0.5 and 1.0 μm due to the high energy barrier to transverse motion. Furthermore, the low energy barriers in the a = 2.0 μm curve mean that the droplet will probably be trapped at x0 = 0 for radii well above 1.5 μm (for this curve a droplet approaching x0 = 0 must only overcome barriers that are less than 10 kBT in height).
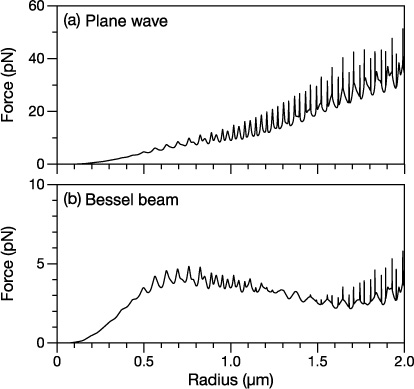
Figure 5. Calculated longitudinal force on a glycerol droplet in (a) a plane wave and (b) a Bessel beam. The amplitude E0 of the plane wave was identical to that of the Bessel beam (1.10 × 10⁶ V m−1). The droplet in the Bessel beam was located at x0 = y0 = 0 and z0 = zmax/2.
Download figure:
Standard image High-resolution imageThe intensity and Poynting vector of the Bessel beam have circular symmetry around the propagation axis of the beam (the z axis). For a droplet in this beam, however, the resulting transverse forces and potential energy surface will not be circularly symmetric. For example, the potential energy curves shown in figure 4(b) will not have the same energies if the displacements were along the y axis instead of the x axis. This lower symmetry originates from the linear polarization of the Bessel beam. The main consequence of this is that the potential energy curves for displacements in other direction in the transverse plane will have smaller barriers than those along the x axis. However, this change is not significant enough to affect the main conclusion that large droplets (a > 1.5 μm) will always tend to move onto the z axis as their radius decreases. Finally, even though the beam is linearly polarized, in the Rayleigh limit (a ≪ λ) the transverse forces calculated with the method described in section 3.2 will become approximately circularly symmetric around the z axis. This result is consistent with the well-known electrostatic expression that describes the gradient force in this limit [2, 45, 46].
4.2. Longitudinal optical forces
Figure 5 compares the longitudinal (z direction) force that a spherical glycerol droplet experiences while in (a) a plane wave and (b) a zeroth-order Bessel beam. Note that drag forces are not considered in this section. In the Bessel beam, the droplet is located at x0 = y0 = 0 and z0 = zmax/2. For this comparison, the amplitude E0 of the plane wave is the same as that of the Bessel beam. For very small radii (a < 0.2 μm), the force that a droplet experiences is similar in both beams. In this size regime, the transverse intensity profile of the Bessel beam will change very little across ρ = −a to + a and even less across z = zmax/2 − a to z = zmax/2 + a. As an approximation, the intensity can therefore be set to its value at the droplet center. This treatment yields a profile identical to that of a plane wave (which has a constant intensity at every position) and explains the similarities between the two results in this size regime.
As a increases (0.2 μm < a < 1.1 μm) the calculated forces when in a Bessel beam and in a plane wave differ considerably, as shown in figure 5. The energy flux crossing droplets of identical radii will always be greater for the plane wave than for the Bessel beam due to the constant transverse intensity profile of the plane wave and its chosen value of E0. Consequently, the difference between the two calculated forces becomes very large. Sharp peaks corresponding to morphology-dependent resonances or WGMs [47–58] also appear in this size regime. Despite the difference in the magnitude of the calculated forces, these peaks appear at identical radii. The type of beam used in the calculation has no effect on the radii at which WGMs occur.
The most noticeable difference between the two force curves in figure 5 occurs in the next size regime (1.1 μm < a < 1.6 μm). The sharp peaks that are observed in the plane wave force curve are either absent or greatly diminished in the Bessel beam force curve. In this range of radii, the excitation efficiency of the WGMs by the Bessel beam appears to be very low. In a spherical droplet, WGMs are excited by rays that pass through a region just outside the radius of the sphere. Known as van de Hulst's localization principle [59], excitation occurs through coupling between the incident beam and the evanescent field of the WGM. This phenomenon has been studied extensively for Gaussian beams that are incident on spherical particles [60–68]. Coupling between the incident beam and WGMs will be optimal at a radial distances bl from the center of the sphere (note, do not confuse the symbol bl with the Mie coefficient blm). The distance bl has been referred to as the impact parameter [67–69] and for mode number l is defined as [59]
The first order modes that exist in the 1.1 μm < a < 1.6 μm regime are from l = 15 to 23. This leads to values of bl that range from 1.3124 μm (l = 15) to 1.9898 μm (l = 23). The first minimum in the transverse intensity profile of the Bessel beam occurs at 1.67 μm, which falls approximately in the middle of this range of bl. This correspondence between the minimum in the intensity profile and the impact parameters suggests a straightforward explanation for the absence or diminishment of the peaks in figure 5(b): the excitation efficiency of the WGMs is greatly reduced as the availability of the number of rays from the incident beam is at a minimum.
The excitation of WGMs was further examined by plotting the internal and near-surface fields of spheres of different radii when illuminated by a plane wave (figures 6(a)–(c)) and a Bessel beam (figures 6(d)–(f)). For the plane wave, field amplitudes characteristic of WGMs are seen for radii that correspond to sharp peaks in figure 5(a). Figures 6(a) and (b) show the calculated fields for a = 1.3333 and 1.7067 μm, respectively. The WGM excitations in figures 6(a) and (b) are the  mode and
  mode, respectively. When the radius is not near a sharp peak, no resonance effects are observed (figure 6(c)).
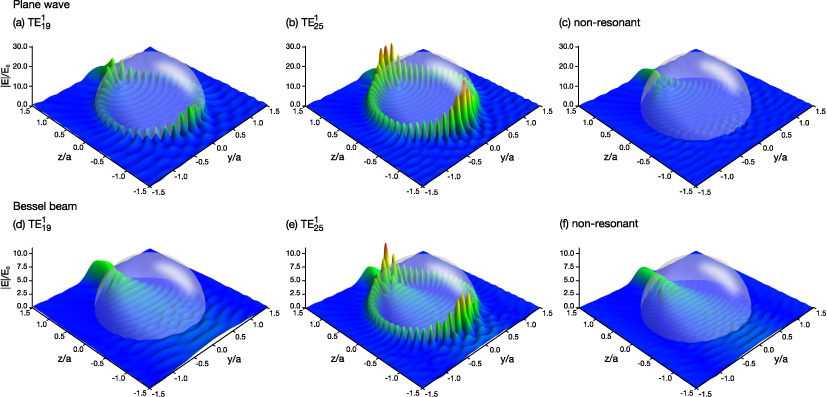
Figure 6. Internal and near-surface fields  for glycerol droplets in a plane wave (a)–(c) and a Bessel beam (d)–(f). The radii of the spheres are (a) 1.3333 μm, (b) 1.7067 μm, (c) 1.7000 μm, (d) 1.3333 μm, (e) 1.7067 μm, and (f) 1.7000 μm. The droplets in the Bessel beam are located at x0 = y0 = 0 and z0 = zmax/2. The resonances that the incident beam should excite are indicated in the figure.
Download figure:
Standard image High-resolution imageUnlike in figure 5(a), a = 1.3333 μm does not correspond to a sharp peak in figure 5(b). The associated field plot in figure 6(d) shows that no WGM is seen despite satisfying the resonant conditions for the mode. In fact, there is little difference between the fields in figures 6(d) and (f) (a non-resonant case where no excitation is observed). The impact parameter for the mode is b19 = 1.6511 μm which is very close to the first minimum in the transverse intensity profile of the Bessel beam (1.67 μm). This example illustrates the extent to which the excitation efficiency of a WGM can be diminished in a Bessel beam: it can fall to essentially zero if the impact parameter is near an intensity minimum in the Bessel beam cross-sectional profile.
For a = 1.7067 μm, the impact parameter is not near an intensity minimum of the Bessel beam and excitation of the mode by the Bessel beam is seen in figure 6(e). This field pattern is very similar to that seen in figure 6(b) when the same mode is excited by the plane wave. Figure 6(f) shows that, similar to the plane wave, no resonance effects are seen in the fields when the radius does not correspond to a sharp peak in figure 5.
In the final size regime (1.6 μm < a < 2.0 μm), all of the sharp peaks in figure 5(a) have corresponding peaks in figure 5(b). The impact parameter is now in the vicinity of the intensity maximum of the first ring of the Bessel beam and, as expected, the excitation efficiency of the WGMs drastically increases.
An interesting effect involving the longitudinal force is observed when a droplet is no longer centered on the propagation axis of the Bessel beam at x = y = 0. In figure 7 the longitudinal forces are shown for droplets located at the intensity maximum of the first ring of the Bessel beam. For the displacement along the x axis, the excitation efficiency of TE modes is much greater than TM modes and, for the displacement along the y axis, the excitation efficiency of TM modes is much greater than TE modes. An example of the difference in mode excitation that can occur is shown in figure 8 for first order l = 11 modes. When the droplet is displaced along the x axis, excitation of the TE mode is seen (figure 8(a)) but not the TM mode (figure 8(b)). Conversely, excitation of the TE mode is not seen when the droplet is displaced along the y axis (figure 8(c)) but the TM mode is excited (figure 8(d)).
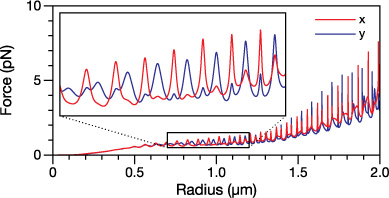
Figure 7. Calculated longitudinal force on a glycerol droplet in a Bessel beam when the droplet is positioned off of the propagation axis. The curve x indicates that the droplet was located at x0 = 2.65 μm, y0 = 0, and z0 = zmax/2. The curve y indicates that the droplet was located at x0 = 0, y0 = 2.65 μm, and z0 = zmax/2. Both of these coordinates were chosen so that the droplet center will be located on the intensity maximum of the first ring of the Bessel beam.
Download figure:
Standard image High-resolution image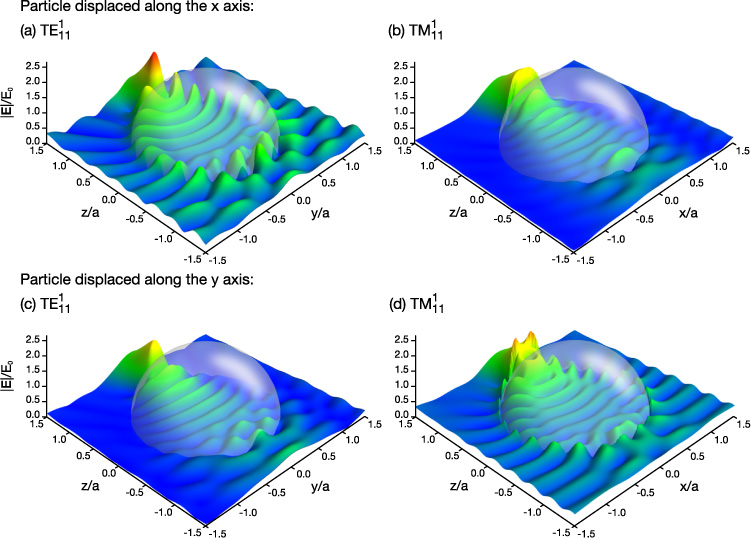
Figure 8. Internal and near-surface fields for glycerol droplets in a Bessel beam. The radii of the spheres are (a) 0.8241 μm, (b) 0.8506 μm, (c) 0.8241 μm, and (d) 0.8506 μm. The droplets in (a) and (b) are located at x0 = 2.65 μm, y0 = 0, and z0 = zmax/2. The droplets in (c) and (d) are located at x0 = 0, y0 = 2.65 μm, and z0 = zmax/2. The resonances that the incident beam should excite are indicated in the figure.
Download figure:
Standard image High-resolution imageIn contrast to figure 5 where the droplet is centered on the propagation axis, figure 7 does not contain a large region over which the excitation efficiency of all WGMs is poor. The overall lower symmetry of the system drastically changes the excitation efficiency of the WGMs and demonstrates that the coupling between the Bessel beam and the droplet is highly dependent on the position of the droplet within the transverse profile of the beam.
4.3. Measured and calculated retention distances
We now include both optical and drag forces to characterise the equilibrium positions of droplets captured by the Bessel beam. Figure 9 shows retention distances for glycerol droplets calculated using equation (15). Results for droplets in a Bessel beam (figures 9(a) and (b)), a plane wave (figure 9(c)), and a Gaussian beam (figure 9(d)) are presented. Sharp peaks are seen throughout all four plots. These are the result of the increase in the longitudinal force that occurs when the radius and refractive index of a droplet are such that the incident beam excites a WGM, displacing the droplet to regions of lower light intensity and giving rise to large excursions in droplet position on resonance.

Figure 9. Retention distance calculated using equation (15) for (a) a Bessel beam with the droplet located at x0 = y0 = 0, (b) a Bessel beam with the droplet located at x0 = y0 = 1.87 μm, (c) a plane wave whose intensity along z axis is identical to that of the Bessel beam along the z axis at x0 = y0 = 0 where the droplet is located at x0 = y0 = 0, and (d) a Gaussian beam with a beam waist of 10 μm whose focal point is x0 = y0 = 0 and z0 = zmax/2 and where the droplet is located at x0 = y0 = 0. The transverse location of the droplet in (b) is on an intensity maximum of the first ring of the Bessel beam. The value of E0 for each beam was set to that of the Bessel beam (1.10 × 10⁶ V m−1).
Download figure:
Standard image High-resolution imageAs was discussed in section 4.2, when a droplet is located on the propagation axis of the Bessel beam there will be a range of radii over which the excitation efficiency of the WGMs is poor. In figure 9(a) this occurs from approximately a = 1.1–1.6 μm. Here, peaks in the retention distance are either absent or not as sharp as they are in figures 9(b)–(d). Of course, excitation efficiencies are dependent on the position of the droplet in the Bessel beam and figure 9(b) demonstrates that when a droplet is no longer on the propagation axis of the Bessel beam it is possible to excite the same number of WGMs as a plane wave (figure 9(c)). Finally, figure 9(d) shows the retention distance curve calculated for a droplet in a Gaussian beam. This curve is provided here for reference as previous calculations involving retention distances have all been performed for spheres in Gaussian beams [18, 20, 70]. Given the loose focus of the Gaussian beam it is not surprising that the shapes of figures 9(c) and (d) are the most similar of the four plots.
A single glycerol droplet was trapped using the Bessel beam and gas flow system described in section 2. Figure 10 shows the measured retention distances as the radius of the droplet decreases due to evaporation. When initially trapped, the radius of the droplet was 1.549 ± 0.010 μm. As the radius decreases, the retention distance of the droplet varies. This change was tracked until the radius was equal to 0.823 ± 0.010 μm, at which point the droplet fell out of the trap. Notably, the droplet position varies by ∼0.2 mm over the size range.

Figure 10. Observed and calculated retention distance for a glycerol droplet in a Bessel beam. For the on-axis, non-ideal calculated plot the droplet is located at x0 = y0 = 0 and the optical forces used in the retention distance calculation were those of the ideal Bessel beam superimposed with those of a plane wave. For any point along the z axis, the intensity of the plane wave was set to 30% of that of the Bessel beam intensity at x = y = 0. For the off-axis calculated plot, the droplet is located at x0 = y0 = 1.87 μm in an ideal Bessel beam. Both calculated plots have been scaled and offset for clarity.
Download figure:
Standard image High-resolution image
The sharp peaks that were predicted in figure 9 are observed throughout figure 10. Based on the resonant behaviour in the measured positional data and its correspondence to the calculated curves, there is no doubt that the origin of the observed peaks is WGMs. However, according to calculations performed in section 4.1, the droplet should be located on the propagation axis of the Bessel beam and the excitation efficiency of the WGMs should be greatly diminished across a large portion of the size regime studied. This is not observed. The likely explanation is that because the measured retention distances in figure 10 are all much larger than zmax, the droplet will be outside of the Bessel zone and the beam will be far from ideal. The intensity in between the rings of the Bessel beam will no longer drop to nearly zero and this will allow for an increased excitation efficiency of WGMs whose impact parameters fall within this region. It is also possible that the non-ideality will remove the restriction that the droplet will become trapped at x0 = y0 = 0, allowing for equilibrium positions that are located off of the propagation axis. The calculated retention distance curves presented in figure 10 were chosen to be representative of these two cases. For the calculated and observed curves, the correspondence between both the positions and widths of the peaks is quite good as they match extremely well and the WGMs can be easily identified. The two deficiencies of the fit are that the amplitudes in the extent of the excursions of droplet position when resonant are not well represented and the more general location about which the droplet moves is not accurately calculated. For the current experimental setup, proper quantitative modelling of the retention distance appears to be incredibly difficult due to the presence of imperfections in the beam and the inability to determine the position of the droplet in the transverse plane with sufficient precision.
Given the similarities between the retention distance curves for the three different beam types shown in figures 9(b)–(d) it is worth briefly discussing why a Bessel beam was chosen in this work. On a simple first examination of figure 9, it may be thought that simple Gaussian or plane wave illumination may be just as effective at demonstrating aerosol optical chromatography, without the complexities of establishing a Bessel beam trap. However, while the Bessel beam is well-known for the properties of being diffraction free and self-healing, of particular interest here are the strong transverse forces that allow for the confinement of sub-micron droplets within the bright central core. For a droplet in a plane wave, there are no optical forces acting in the transverse direction and such a beam has no practical use when attempting to trap particles. For a droplet in a Gaussian beam, the transverse forces are much weaker than those of the Bessel beam (for the beams and droplet radii considered here). Furthermore, if the transverse forces are enhanced by greater focussing, the degree of motion that can be achieved in the z direction is similarly reduced. Therefore, when working with droplets with radii around one micrometer, the Bessel beam is the most suitable of the three beams, allowing resolution of particles of different size at different longitudinal positions but ensuring tight transverse confinement.
Previous theoretical work on optical chromatography has presented the relationship between retention distance and radius as one where the retention distance increases monotonically with increasing radius (for a dynamic range that spans about three orders of magnitude) [18]. This relationship is not seen in either the observed or calculated retention distance curves presented in figures 9 and 10. The reason for the discrepancy is that, to our knowledge, all previous work in the field of optical chromatography has used ray optics when calculating optical forces [18, 20, 21, 70]. The approximations in such a treatment ignore WGMs, which are the origin of the retention distance peaks in the results presented here.
Further, the influence of WGMs on measured retention distances has not been observed experimentally. It is reasonable that the effect has gone unnoticed as measurements have focussed on coarse separations of systems containing particles with at most four different sizes or refractive indices and a significant variation in each parameter [17, 18, 20, 21, 71, 72]. In contrast, the slow rate of evaporation of a glycerol droplet means that the droplets studied here are a unique probe of retention distance. Changes to the radius of the droplet are recorded on such a fine interval that the measured retention distance contains all of the features of the calculated curves. Even peaks whose widths are less than a few nanometers are observed in figure 10. If such a chromatographic technique is to be used for aerosols, it will be important to ensure that the instrument operates in a regime similar to that identified in figure 9(a), where a more monotonic change in retention distance with size (and refractive index) is observed with variation in particle size. Only in this limit would particles of differing size become segregated and, thus, separated, in different spatial locations.
5. Conclusion
The equilibrium positions/retention distances of glycerol droplets held in a Bessel beam propagating against a gas jet were studied theoretically and experimentally. In section 4.1, calculations demonstrated that as droplet size decreases and falls below a = 1.5 μm the droplet will become trapped on the propagation axis of the beam (x0 = y0 = 0). In sections 4.2 and 4.3, WGMs were shown to greatly affect the force that a droplet experiences in the longitudinal direction and lead to sharp spikes in the calculated and observed retention distance curves. The most striking discrepancy between the model and observed results was that the strong excitation of WGMs was observed across a droplet size regime where the model system predicted the excitation efficiency to be very low. This was attributed to either the droplet being located off-axis, the non-ideality of the Bessel beam, or a combination of both.
These results show that WGMs limit the ideal selectivity of optical chromatography as a technique for performing separations, both in the aerosol phase and in more conventional liquid flow systems. The fact that the retention distance is not a monotonic function of radius over any practical dynamic range means that a sample containing multiple particle sizes that are within a few hundred nanometers of each other will not separate in a straightforward manner. However, for separations that involve only a few particles whose sizes differ by more than a micrometer, optical chromatography will be satisfactory (as has been demonstrated in previous work). Furthermore, for particles where WGMs do not exist (for instance, objects that are not well-described as being homogeneous spheres; e.g. cells) the previous description of retention distance should still be accurate. Finally, the presence of WGMs in the retention distance curve should provide the opportunity to simultaneously characterize the size and refractive index of aerosol particles and provide a useful tool for investigating aerosol particles smaller than one micron in diameter, a size regime that is challenging to access by other light scattering methods. This will be studied in future work.
Acknowledgments
TCP gratefully acknowledges the Natural Sciences and Engineering Research Council (NSERC) of Canada for the award of a postdoctoral research fellowship and a Canada-United Kingdom Millennium Research Award. JPR acknowledges financial support from the Engineering and Physical Sciences Research Council (EPSRC) through the support of a Leadership Fellowship (EP/G007713/1). RS acknowledges financial support from the Swiss National Science Foundation (project no. 200021_146368) and the ETH Zurich.