

Abstract
Photo-induced quasi-particle (QP) relaxation dynamics with different symmetries have been investigated for the multiple charge–density–wave (CDW) compound DyTe3 by using ultrafast polarized pump-probe spectroscopy. By performing symmetry analysis, the QP dynamics with isotropic A1g and anisotropic B2g symmetry were found to show unique anomalies at the first and second CDW transitions. Both the temperature dependence and pump fluence dependence indicate that the B2g response is very sensitive to the underlying lattice deformation, which provides critical insight into the multiple CDW formations.
Export citation and abstract BibTeX RIS

Content from this work may be used under the terms of the Creative Commons Attribution 3.0 licence. Any further distribution of this work must maintain attribution to the author(s) and the title of the work, journal citation and DOI.
1. Introduction
Optical pump-probe time-resolved spectroscopy has been widely used to study chemical reaction, [1] dynamics of photo-excitation in semiconductors [2, 3] and optical devices [4, 5], and photo-induced phase transition in spin-crossover solid [6, 7] and strongly correlated electron systems [8, 9]. Moreover, the pump-probe spectroscopy has made a great contribution to researches of the coexistence and competition of different kinds of ordered states such as superconductivity (SC) and pseudogap (PG) state in cuprate superconductors [10, 11]. When multiple ordered states co-exist together, those photo-excited quasi-particle (QP) dynamics can be distinguished from each other by differences in relaxation time, magnitude of  changes, and the temperature dependences between them [12–17, 19–29].
Recently, the coexistence of multiple charge–density–waves (CDW) has been reported in quasi-two-dimensional (Q2D) rare-Earth tritelluride compounds, RTe3, where R is a rare-Earth ion (R = Dy, Ho, Er, Tm). RTe3 consists of square planar Te sheets (a–c plane) and insulating RTe3 layers, which are alternately stacked along the b direction [30]. The weakly interacting 5p electrons of the Te atoms construct a Q2D Fermi surface. Electron and x-ray diffraction measurements and angle-resolved photoemission spectroscopy (ARPES) have revealed that, in these compounds, the first CDW occurs along the c axis at high temperatures and the second CDW forms along the direction perpendicular to the first CDW direction (the a axis) at low temperatures [31–33]. However, in the pump-probe measurements for the series of RTe3, the temperature dependence of the magnitude of transient reflectivity changes and relaxation time did not show clear evidence of the second CDW transition [34]. This is because the response associated with the second CDW formation can be buried in that of the first one. Thus, the QP dynamics of multiple CDW states have not been completely understood so far.
The recent study has demonstrated that, by varying the probe-polarization, the SC and PG responses were distinguished individually by spatial symmetry breaking accompanied by the SC and PG transitions in the cuprate superconductor Bi2Sr2CaCu2O  (Bi2212) [29]. Since, on the CDW transition in a Q2D system spatial (translational and rotational) symmetries are broken, such a polarization-dependent pump-probe measurement will provide new information, especially on QP dynamics in terms of the second CDW transition.
In this paper, we report the use of pump-probe spectroscopy for a multiple CDW system of DyTe3 with different probe polarizations. By performing concise symmetry analysis, we found that the observed anisotropic response for the probe is not only attributed to the CDW formation but also that it is quite sensitive to changes in the underlying lattice symmetry. Moreover, the ratio between anisotropic and isotropic responses shows unique anomalies associated with the first and second CDW transitions.
2. Experimental
DyTe3 was chosen from among the RTe3 compounds because the CDW formation occurs along two directions. It is thus expected to provide more information for symmetry analysis than the other unidirectional CDW compounds. The first CDW forms along the c axis just at room temperature (
 305 K) and along the the second a axis at
  of 50 K. In the series of RTe3, a structural phase transition has not been reported except for the lattice modulation due to the CDW formation. This fact allows us to carry out simple analysis in terms of spatial symmetry breaking.
Single crystals of DyTe3 were grown by a self-flux technique [35]. High-quality starting elements with the molar ratio Dy:Te = 1:10 were put into a quartz tube and sealed under vacuum. Respective mixture were heated at 550 and 850 °C for 2 d. After heating, the mixtures were cooled gradually to 450 °C at a rate of 2 °C h−1 and quenched to room temperature. Clean sample surfaces were prepared by cleavage with adhesive tape. The crystalline axes were determined by x-ray diffraction measurement at room temperature. However, it was difficult to distinguish between the a and c axes because the resolution of the instrument was insufficient to detect a difference in their lattice constants.
In the optical pump-probe experiments, the pump beam excites carriers to a nonequilibrium high-energy state. This results in immediate relaxation of the excited carriers to states near the Fermi level by electron–electron and electron–phonon scattering [36]. When a gap for electronic excitation, such as a superconducting or CDW gap, is present, a relaxation bottleneck may occur and QPs accumulate just above the gap. The relaxation across the gap is caused gradually because of interaction between QPs and high-frequency phonons [12, 13]. The probe beam, which is delayed with the time t, measures the change of reflectivity,  , which is connected with the non-equilibrium distribution of the QPs,
  , as a function of t. The optical measurements were performed using 120 fs pulses centered at 400 nm for a pump (F = 36 μJ cm−2) and 800 nm for a probe from a cavity-dumped Ti:sapphire oscillator with a repetition rate of 270 kHz. The pump and probe beams were coaxially overlapped by a dichroic mirror and irradiated perpendicular to the a–c plane. The probe pulse polarization was rotated by a half-wave plate. θ is the angle between the probe electric field and the direction tilted by 45°from a crystalline axis, as shown in figure 1(a).
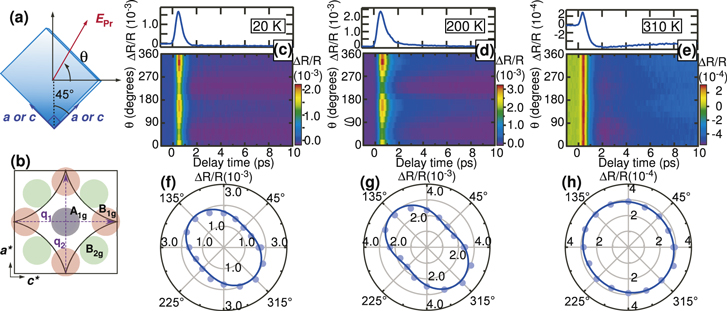
Figure 1. (a) Schematic of definition of the probe polarization angle θ. (b) Schematic of the Fermi surface and nesting vectors  1 and
1 and  2. A1g, B1g, and B2g indicate the selectivity of the probe in the k-space according to the Raman-like process. (c)–(e) Intensity plots of
  transient for F = 36 μJ cm−2 as a function of angle at 310, 200, and 20 K, respectively. (f)–(h) Polar plots of the maximum values of
  .
.
Download figure:
Standard image High-resolution image3. Results
Figures 1(c)–(e) show transient reflectivity  as a function of θ and
  for θ =
  at T = 310, 200, and 20 K, respectively. The maximum values of
  are plotted in figures (f)–(h). For T = 310 K (
 ), the
  shows no angular dependence (isotropic). On the other hand, an anisotropic response is observed for T = 200 K (

 ). The signals are enhanced along the
  and
and  directions, which correspond to the a or c axis. The anisotropy for the probe can be associated with the first CDW formation along with c axis. For T = 20 K (
 ), the angular dependences is qualitatively similar to that for T = 200 K, although the second CDW occurs along the a axis.
The probe-polarization-dependent  can be associated with two different types of pump excitation processe, stimulated Raman excitation and dissipative excitation (DE). The former is a coherent process and depends on the pump polarization, whereas the latter shows no pump polarization since information about the pump polarization is lost due to inelastic scattering. In our results, the observed anisotropy is independent of the pump polarization, indicating that DE is dominant. For the case of DE, the probe-polarization dependence of
  arises from the anisotropy of excited states affected by some symmetry breaking owing to the structural or electronic phase transition [29].
For DyTe3, because the lattice constant of a is very close to that of c (a  c), it is reasonable to assume the tetragonal (
 point group symmetry). Under this assumption, the angular dependence of
  for the probe can be analyzed in the same way as the case of Bi2212 [29]. As a result, the photo-induced change of reflectivity is derived as

where A1g, B1g, and B2g correspond to symmetries in the k-space, as shown in figure 1(b), respectively. By fitting equation (1) to the angular dependences of  , we decomposed the data into the components of isotropic A1g, anisotropic B1g, and B2g symmetries.
Figures 2(a) and (b) present  transients of the A1g and B2g components, respectively, for various temperatures. As a result of the decomposition, the A1g and B2g components are found to develop with decreasing temperature, whereas the B1g component is negligible at all temperatures. In the A1g response, a combination of positive and negative components is observed at 310 K. As the temperature decreases, only the positive component develops, whereas a negative component dominates in the B2g response. Oscillatory responses are seen in both the A1g and B2g channels at low temperatures, as shown later.
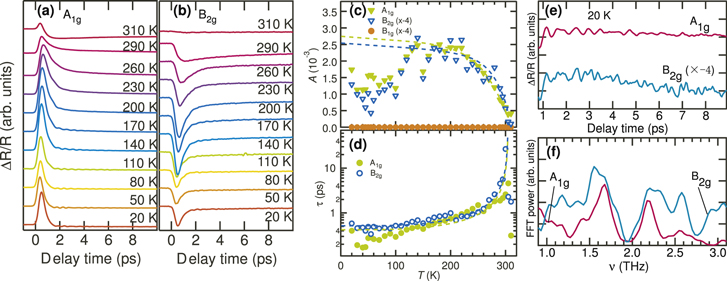
Figure 2. (a), (b)  transients of the A1g and B2g components for various temperatures, respectively. The data are shifted for clarity. (c) Temperature dependence of the amplitude A of the A1g and B2g components. (d) Temperature dependence of the decay time τ of the A1g and B2g components The dashed lines display the result fitted by the theoretical model. (e) Oscillatory responses of the A1g and B2g components at 20 K. (f) Fourier-transform spectrum of the data in (e).
Download figure:
Standard image High-resolution imageSince the maximum values A of  are associated with the photo-induced QP density, nqp, A is plotted as a function of temperature, as shown in figure 2(c). The curve of B2g is qualitatively similar to that of the A1g component. As the temperature decreases from 310 K and crosses
  , A increases steeply, indicating growth of the CDW gap. To explore the qualitative validity, we fitted the data with the theoretical model [13]. When nqp is small as compared to the equilibrium conditions,
  is given by

where  , kB, and g indicate the BCS-type gap function, Boltzmann constant, and the ratio of bosonic and electronic densities of states that contribute to nqp, respectively. The fits yield
  = 91 and 88 meV for the A1g and B2g components, respectively. These values are close to those obtained in ARPES [32] and the previous pump-probe measurements [34].With a further decrease in temperature, the A values start to deviate from the model at around 130 K. Similar deviation has been observed in other RTe3 compounds [34]. In the previous study, such a deviation may be associated with the resonant coupling between the collective excitation (amplitude mode) of CDW and the totally symmetric phonon [34]. Below 50 K, the A values tend to increase with decreasing temperature. The slight increase can be attributed to the occurrence of the second CDW.
Figure 2(d) shows the temperature dependences of the decay time obtained by fitting the rapid decline of the transient with a single-exponential function  . Before fitting, to eliminate the contribution of the temperature-independent component from the data, we subtracted the result at 310 K from each results below 305 K for the A1g response. The τ of both the A1g and B2g components show a clear divergence as
  is approached from below, whereas no pronounced anomaly is observed at
  . Theoretically, the relaxation time is associated with the CDW gap as
  /
/ when
when  [13] . This behavior agrees well with the divergence at
  . Therefore, we conclude that the positive component of the A1g and B2g response are associated with the CDW formation.
Figure 2(e) shows the oscillatory responses of the A1g and B2g components at a low temperature, where the relaxation component has been subtracted. The oscillations are observed not only in the A1g channels but also the B2g channels, although the oscillation amplitude in B2g is more than 4 times smaller than that in A1g. Figure 2 (f) exhibits the Fourier transform spectrum of the A1g and B2g oscillations. For the A1g spectrum, the peak positions agree well with those in a previous report, [34] in which a mode at 2.2 THz corresponds to the collective excitation of CDW (amplitude mode) and the others are attributed to oscillations of the totally symmetric phonons. On the other hand, the spectrum of the B2g component partly includes different modes. The observed peaks in the B2g channel may correspond to Raman-active phonon modes coupled with QPs in the B2g symmetry.
Figures 3(a) and (b) present the  transients of the A1g and B2g components, respectively, for various fluences at 20 K. For the A1g response, in addition to a positive component, which is ascribed to the CDW formation, a long-lived negative component is seen at high fluences. This component probably corresponds to that observed at 310 K, indicating that it is unrelated to the CDW formation. In the B2g response, two negative components seem to emerge at high fluences.

Figure 3. (a), (b)  transients of the A1g and B2g components for various pump fluences at 20 K, respectively. (c), (d) Fluence dependence of amplitude and decay time of the A1g, B1g, and B2g components, respectively. The dashed lines are linear fits. (e), (f) Fluence dependence of amplitude of the A1g and B2g components at 296 and 310 K, respectively.
Download figure:
Standard image High-resolution imageThe maximum values of the A1g and B2g signals are plotted as a function of fluence in figure 3(c). Both the amplitudes have qualitatively similar fluence dependence. As the fluence increases, amplitudes increase linearly and shows a kink, followed by a gradual increase. We determined that the threshold fluence Fth = 39 μJ cm−2 for both the A1g and B2g components by using the saturation model [20] . The Fth values are reasonable as compared to 47 μJ cm−2 for TbTe3, which has a higher CDW transition temperature of 336 K [27]. Figures 3(e) and (f) show the fluence dependences of the amplitude of the A1g and B2g components, respectively, at high temperatures. The saturation behaviors are observed up to 310 K ( ), indicating a precursor of CDW.
Figure 3(d) indicates the fluence dependence of decay time for the A1g and B2g signals. The τ value increases with increasing fluence, showing saturation behavior for both components. In the Rothwarf–Taylor (RT) model under the strong bottleneck condition [12], τ is given by

where nqp is the photo-induced QP density, nT is the QP density under the thermal equilibrium condition, and γ is the effective relaxation rate. At low temperatures, nT decreases as compared to nqp, leading to the relation  at low fluences. Our results are in contrast to the RT model. Although A increases linearly (figure 3(c)), τ seems to be proportional to nqp, i.e.,
  . Within the framework of the RT model, our results may be explained by the change of γ. If γ decreases with increasing fluence, it will lead to
  . This means that the bottleneck condition can be changed by varying the fluence. At high fluences, τ increases gradually. This behavior may be due to improper fitting. For both the A1g and B2g channels,
  seems to be two components at high fluences. Thus, use of a single exponential function will result in a poor fit. Similar behavior has been observed in Bi2212 [26].
As observed earlier, the temperature and fluence dependences of amplitude and decay time in the B2g channel are quite similar to those in the A1g channel. However, the following data reveal that the A1g and B2g responses have different origins. Figure 4(a) shows the magnitude of  normalized by the maximum value A of the A1g component for various temperatures. The
  value in the B2g channel is obviously different from that in the A1g channel. The ratio between the amplitude of the A1g and B2g components as a function of the normalized temperature is shown in figure 4(b). Strikingly, the ratio was found to increase near
  and, in contrast, decrease at
  . As the temperature increases from below
  , the
, the  curve shows a steep increase, followed by a rapid decrease. We note that the reduction above
  can be attributed to a negative component in the A1g channel, which is not associated with the CDW formation. For the intermediate temperature range
  , there are almost no changes in
  curve. Figure 4(c) shows the fluence dependence of
  for various temperatures. As the fluences increase, the
  curve shows a steep increase for 20 K, whereas it decreases for 296 and 310 K. At high fluences, all the curves become almost constant and monotonically shift downward with increasing temperature. These results indicate the distinct differences between A1g and B2g responses.

Figure 4. (a) Magnitude of transient reflectivity normalized by A in the A1g component for various temperatures. The dashed and solid lines indicate the A1g and B2g components. The data are shifted for clarity. (b) Absolute values of ratio of A between the A1g and B2g components as a function of normalized temperature. Right axis is ratio of the lattice parameter between a and c in TbTe3 adopted from [7]. (c) Fluence dependence of absolute values of ratio of A between the A1g and B2g components as a function of fluence for various temperatures. (d) Schematic of Te plane for three temperature regions.
Download figure:
Standard image High-resolution image
4. Discussion
Let us discuss origin of the isotropic A1g and anisotropic B2g responses. The A1g component is determined by the CDW order parameter. Generally, the order parameter of broken symmetry ground states is complex, written as Δ =  . Since in the excitation process by the pump pulse the dielectric constant is involved as powers of
  , it leads to the A1g symmetry. Therefore, the steep growth of the A1g signal below
  is assigned reasonably to the first CDW formation. The second CDW may be minor a contribution to the A1g channel because there is no remarkable anomaly at around
  in figure 2(c). As shown in figures 2(e) and (f), it is reasonable that the amplitude mode of CDW was observed in the A1g channel since it originates form the oscillatory modulation of
  .
.
The above discussion suggests that anisotropy of the CDW order parameter is not the origin of the B2g component. However, our results indicate that both the B2g and A1g responses are dominated by the CDW order parameter. Thus, it is reasonable to assume that the origin of the anisotropic response is associated with changes in the underlying lattice and that the relation between the B2g and A1g transients is simply given by  , i.e.,
  , where β is a coefficient for the anisotropy and
  corresponds to
  . In this case, we can explore the origin of the anisotropic transients (B2g signal) by investigating the behavior of β. To compare
  with the anisotropy of the crystal structure, the ratio of the lattice parameters between a and c in TbTe3, which is adopted from [33], is plotted on the right axis in figure 4(b). The ratio of the lattice parameters changes with decreasing temperature below
  , meaning that the lattice anisotropy grows monotonically. On the other hand, the
  curve shows a maximum just below
  and it is almost constant in the temperature range
  . The comparison indicates that
  does not correspond linearly to the lattice anisotropy. The most remarkable feature is that
  varies only at
  and
and  , suggesting that
  (
( signal) is not simply reflected by the lattice anisotropy but also by the anisotropy induced by the CDW transitions. When the temperature decreases and crosses
  , the underlying Te lattice deforms from a square to a rhombic shape as shown in the right side and middle of figure 4(d) owing to the first CDW formation along the c axis. In this case, the lattice anisotropy becomes strong, corresponding to enhancement of
  at
at  . As the temperature decreases further, the second CDW forms along the a axis, deforming the lattice as shown on the left side of figure 4(d). At
  , the lattice anisotropy is weakened, in contrast to the case at
  . The decrease of the lattice anisotropy may lead to the suppression of
  . In this way, the unique temperature dependence of
  is explained by the change of the lattice anisotropy induced by the CDW transitions.
The fluence-dependent variations of  presented in figure 4(c) are also explained by the CDW-induced lattice anisotropy. For 20 K, the
  curve shows a steep increase with increasing fluence, and then it shows a kink followed, by a gradual increase. At high fluences, the
  values approach ∼0.35, which is close to the value obtained near
  . When the fluence increases and exceeds Fth, the two CDWs are completely broken. This situation corresponds to the first CDW transition under varying temperature, indicating the enhancement of
  . The contribution accompanied by the second CDW transition is difficult to detect since the Fth value of the second CDW is significantly smaller than that of the first one. Above 296 K, the
  curves decrease with increasing fluence. This behavior may trace the steep reduction of
  near
near  with increasing temperature. For instance, at 296 K, the
  values are ∼0.3 at low fluences and ∼0.2 at high fluences. These values are consistent with those obtained at 295 and 300 K. At high temperatures, since the large negative component in the A1g channel is significantly larger than that at 20 K and it contributes significantly to the fluence dependence of
  .
.
From the above discussions, the appearance of the B2g response is interpreted as a consequence of spontaneous symmetry breaking in terms of the CDW transition. Usually, for a one-dimensional CDW system, the translational symmetry is broken. On the other hand, for the two-dimensional system, in addition to the translational symmetry, the rotational symmetry is broken simultaneously due to unidirectional CDW formation. In the case of DyTe3, as a result of such the symmetry breaking, the symmetry of the system changes from tetragonal to orthorhombic below  . This is consistent with the fact that the B2g signal is enhanced along the crystalline axis (a or c), which corresponds to the first CDW wave vector,
  1, or to the direction perpendicular to
  1. In our results, anisotropy in the B2g channel is conserved as the temperature decreases and crosses
  , indicating that the reduced rotational symmetry is maintained even though the second CDW occurs. Since the absolute value of the second CDW wave vector,
  2, is not identical to that of
  1 for ErTe3, [33] the orthorhombicity will not be changed even for DyTe3 below
  . Consequently, the emergence of the anisotropic transients corresponds to occasion of the rotational symmetry breaking accompanied by the CDW transition. The first CDW transition occurs with the translational along the c axis and rotational symmetry breaking, while only the translational symmetry along the a axis is broken at the second CDW transition, maintaining the rotational symmetry.
Our results clearly show that the B1g component is absent in the whole temperature range. The B1g symmetry corresponds to the direction tiled by ∼ from the crystalline axis (Te–Te bond direction) in real space. In the previous measurements [31, 33], any charge or lattice modulations along the direction have not been observed in the RTe3 compounds, which are consistent with our measurements.
Finally, we compare our results with the results of Bi2212 [29]. In Bi2212, below  , not only anisotropic B2g response but also isotropic A1g response are observed. A of B2g component is about 9 and 14 times (for over- and under-doped sample) smaller than that of A1g component. The ratio between the A1g and B2g component in Bi2212 is larger than that of in DyTe3. Moreover, the temperature dependence shows A increases gradually as temperature increases, which is contrast to that in DyTe3. These differences between Bi2212 and DyTe3 can be originated from spatial inhomogeneity. In Bi2212, spatial variations of carrier density and superconducting gap were observed [39, 40]. Thus, domains of some electronic ordered state accompanied by the B2g symmetry breaking can be emerged in the sample below
  . On the other hand, unidirectional CDW is formed uniformly in real space below
  in DyTe3. Since order parameter is averaged totally as the domains are spatially distributed, magnitude of the order parameter will be smaller than that in the case where electronic ordered state is spatially homogeneous. This may be the reason why the ratio between the A1g and B2g component and temperature dependence of A are different between them.
5. Conclusion
By performing pump-probe spectroscopy with different polarizations for the probe photons in DyTe3, we detected successfully not only the first CDW transition but also the second one in the ratio between the A1g and B2g components. These polarized measurements enabled us to investigate a buried component in multiple component systems more easily than we could using normal measurements. It thus provides a significant advantage for investigating the competition and coexistence of multiple electronic ordered phases.
Acknowledgments
The authors would like to thank M Takesada for experimental support.