
Abstract
Mid-infrared (MIR) imaging has emerged as a valuable tool to investigate biological samples, such as tissue histological sections and cell cultures, by providing non-destructive chemical specificity without recourse to labels. While feasibility studies have shown the capabilities of MIR imaging approaches to address key biological and clinical questions, these techniques are still far from being deployable by non-expert users. In this review, we discuss the current state of the art of MIR technologies and give an overview on technical innovations and developments with the potential to make MIR imaging systems more readily available to a larger community. The most promising developments over the last few years are discussed here. They include improvements in MIR light sources with the availability of quantum cascade lasers and supercontinuum IR sources as well as the recently developed upconversion scheme to improve the detection of MIR radiation. These technical advances can substantially speed up data acquisition of multispectral or hyperspectral datasets thus providing the end user with vast amounts of data when imaging whole tissue areas of many mm2. Therefore, effective data analysis is of tremendous importance, and progress in method development is discussed with respect to the specific biomedical context.
Export citation and abstract BibTeX RIS

Original content from this work may be used under the terms of the Creative Commons Attribution 3.0 licence. Any further distribution of this work must maintain attribution to the author(s) and the title of the work, journal citation and DOI.
Corrections were made to this article on 25 01 2018. An Acknowledgments section was added.
1. Introduction
The last decade has seen the early exploration of myriad applications of vibrational spectroscopy in the clinical arena. Both mid-infrared (MIR) absorption spectroscopy and Raman spectroscopy, utilising the inelastic scattering of laser light, probe the specific vibrational energy levels of molecules in the target volume. The two techniques are complimentary, probing different vibrational modes based on vibrational selection rules. The various methodologies are undergoing translational development for a range of applications from in vivo surface [1] and deep tissue probes [2] able to provide real-time analysis of disease specific tissue molecular compositional changes; to point of care testing of ex vivo tissues or body fluids [3, 4]; to microspectroscopic analysis and imaging of tissue and cells [5–7]. Until recently the limited speed of vibrational spectroscopic imaging has prevented its translation as a tool in digital spectral histopathology. However, new developments in MIR technologies and a greater understanding of the key discriminating features is leading to a resurgence of interest in MIR spectral histopathology as a tool for rapid molecular identification of disease, particularly to support pathologists in making difficult decisions when assessing early malignant disease [8, 9].
MIR technology is experiencing a renaissance with the development of new light sources and detection systems. This is driven by the need for faster imaging systems, as MIR hyperspectral imaging has proved to be a valuable tool for medical diagnostics but is hampered by relatively slow image acquisition times. Imaging speed has significantly increased within the last five or so years and is on the brink of becoming competitive to gold-standard histopathology procedures, while offering more detailed chemical information without the need for staining or labelling.
Imaging biological samples using resonant absorption in the MIR region is a particularly challenging task compared to imaging in the visible range of the electromagnetic spectrum. Here, we define the MIR region in terms of wavelengths ranging between 2 and 12 µm (in wavenumbers, 5000 to 800 cm−1). A major challenge when measuring the IR absorption spectrum of biological matter is the interference of water absorption, i.e. OH stretching modes giving rise to a broad band centred at 3300 cm−1 and bending mode at 1620 cm−1, due to their high water content. Furthermore, many materials have absorption bands in the MIR range and so there are only a few transparent materials that can be used as substrates, for instance. Of equal importance, the optical imaging elements made from these materials are less widely available than standard silica or quartz optics.
The scope of this review paper is to give an overview of the state of the art of MIR technologies and outline which technical developments are likely to have the greatest impact in the next few years. The reader is referred to other recent reviews in this area: Bhargava et al [10] and Gardner et al [11], both covering complementary aspects of the field.
Traditional visible light microscopy often requires histological staining to reveal morphological patterns in biomedical samples. This requires separate sections for each marker of interest, whereas vibrational spectroscopic imaging can provide information on myriad markers from a single section of unstained tissue. Raman microspectroscopy, although able to provide high resolution chemical mapping of cells and tissues, is either significantly slower then MIR imaging, or when used in fast nonlinear modalities [12] has less chemical information. The nonlinear modalities such as coherent anti-stokes Raman scattering or stimulated Raman scattering are mostly limited to probing only the higher wavenumber region of a vibrational spectrum, while being more complex in optical setup compared to a discrete frequency MIR imaging system. Notable however is their ability to perform better in aqueous media then MIR systems, which makes them superior for studying living organisms but less favourable for studying clinical samples. Mass spectrometry based imaging techniques [13, 14] offer a comparably good chemical contrast to MIR and Raman imaging but are significantly slower, more expensive in operation, and notably destructive. In comparison to other techniques, MIR imaging offers high sensitivity, reasonable spatial resolution (of the order of 1–10 µm), non-destructive testing and specific chemical contrast without the requirement of extensive sample preparation. The remainder of this review will focus on advanced in MIR technologies leading to feasible translation of MIR imaging for rapid non-destructive, molecular specific clinical diagnostics.
In simplistic terms, the four key components of a MIR imaging system are the light source, the imaging optics e.g. microscope, the wavelength separating unit or spectrometer, and the detector. Here, all novel developments in each of these areas will be discussed and the implications for IR hyperspectral imaging of tissue and cells considered. Here, we focus on far-field techniques, likely to be applied to large scale tissues and cells at scales of 10's μm to mm. There are many rapid developments in near-field IR techniques, beyond the scope of this review, such as scanning near-field optical microscopy or nano-IR, the reader is pointed to a review by Bazylewski et al [15] for a general overview or others for more specific nano-IR applications [16–22]. A further notable mention in this regard is photothermal infrared spectroscopy. This concept bypasses the diffraction limit of the infrared probing beam by measuring the modulation of a visible secondary beam focussed into a tighter spot. The first commercial instrument utilising this concept has just been launched while this publication was under review [23]. The authors are however unaware of any scientific publications presenting the underpinning technology or showcasing data from that instrument.
Integration of the new IR technologies into an imaging system, often using coherent light sources, can require careful consideration of the impact of the optical systems on the imaging quality achieved, particularly when trying to achieve diffraction limited spatial resolution. Designing an imaging system, is a complex task and needs to consider all requirements and components to maximise performance. The most important parameters in a spectral measurement are the spectral range (defined by the light source, optical components, and detector), spectral resolution (either defined by a spectrometer, wavelength tuning element or inherently from the linewidth of the monochromatic excitation light), spatial resolution (defined by the objective's NA) and speed (given by brightness of the light source, speed of wavelength selection and sensitivity of the camera). Here, we will discuss how each new instrumental approach is likely to affect those parameters.
2. Mid-infrared light sources
The light source is a key component of MIR imaging systems and its choice has a major influence on the rest of the system design. To date, only two types of radiation source can be seen as well-established sources for MIR spectroscopy and imaging: globar and synchrotron illumination. In recent years, additional technologies have become available in the MIR region. These include: quantum cascade lasers (QCL), MIR supercontinuum light sources and free electron lasers (FELs).
A globar is the simplest and cheapest broadband light source. It consists of a filament made of silicon carbide which is heated up to 1000 °C–1650 °C by an electric current and radiates according to Planck's law (i.e. as a black-body). The output radiation is spatially and temporally incoherent, and has very low intensity noise, being limited by the drive current and the stability of the cooling system. It has a large spectral emission range (2–25 μm) but low spectral intensity (radiant intensity per wavelength) stemming from the principle of black-body radiation.
Synchrotron radiation and FEL are easily able to cover the whole MIR spectral range with significantly higher brightness than globars. Their working principle is based on the Bremsstrahlung effect, whereby electrons accelerated to relativistic speeds while the transverse part of their momentum is modulated by a magnetic field (e.g. by an undulator or bending magnet) leading to emission of electromagnetic radiation in a cone, spanning a wide range of wavelengths. While the undulator induced radiation is inherently incoherent with arbitrary phase relation, some designs [24] can achieve coherence over certain spectral ranges in the far-IR. Free electron lasers emit coherent radiation in both spatial and temporal domain [25, 26]. The FEL from Tokyo University of Science, for example, emits a selectable wavelength in the range 5–16 μm [27]. It can operate at 5 Hz repetition frequency and macro-pulse duration of ∼2 μs, which actually consists of a set of 2 ps micro-pulses with 350 ps periodicity, delivering 6–8 mJ per macro-pulse. FELs as well as synchrotrons are extremely large and expensive to maintain; therefore, they are available only for a few experiments in the basic sciences. High costs and lack of portability of these systems make them impractical for general use. Other notable MIR light sources [28] include solid state lasers, fibre lasers and optical parametric oscillators [29] but will not be covered in this review. They can offer extremely high peak power and ultrashort (fs) pulses, but, at the expense of cost and bulk.
The most promising commercially available new technologies are MIR semiconductor lasers and supercontinuum light sources, as they combine high brightness and small size requirements. First, we will discuss the MIR semiconductor lasers, predominantly quantum cascade lasers or QCLs.
2.1. Quantum cascade lasers
Since the first demonstration of a working QCL in 1994 by Capasso et al [30] with peak power of 8 mW at 4.2 μm, the laser has been very successfully further developed. By now, the peak power has risen to over 200 W [31] and even in continuous-wave (cw) operation the average output power exceeds several watts [32, 33]. The emission spectral range has improved as well, and lasing has been demonstrated on spectral bands spanning from 2.63 μm [34–36] to 24.4 μm.
Similar to diode lasers (DL) and interband cascade lasers (ICL) [37], pumping of the laser is realised by applying a voltage across the QCL chip. Carefully designed periodic heterostructures as visualised in figure 1 enable electrons to move into an upper laser level in the conduction band, where these electrons undergo a radiative transition to a lower energy state, also within the conduction band [38]. Finally, the electrons exit the lower laser state by non-radiative transition and are re-injected into the upper laser state of the next cascade (period). After moving through all cascades, typically 30–40 within one laser structure, the electrons are collected at the positive contact. The electrons' wavefunctions are composed of spatially-modulated Bloch states of the conduction band during the entire process, so no holes are involved, which is not the case for DL and ICL.
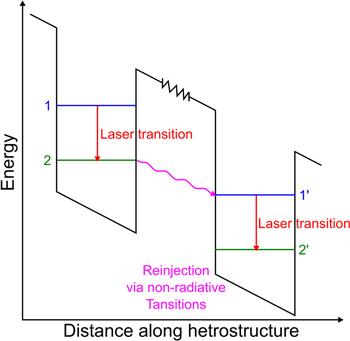
Figure 1. Simplified QCL energy schematic.
Download figure:
Standard image High-resolution imageIncreasing the number of cascades can technically archive total quantum efficiencies greater than 100% because each cascade can result in up to one photon per electron [39] and the electron can be reused by the next cascade. The power efficiency is largely independent on the number of cascades, but increases with the cascade number due to better overlap of the optical mode with the gain. For high power, it appears that having 10–15 cascades [40] is optimum because of a need to balance thermal conductance with power efficiency. One can also enhance the emission range of a single chip by heterogeneous stacking of cascades with gain centred at different wavelengths [41–44].
To achieve individual energy levels, in an otherwise continuous band of energies, quantum confinement has to be established. This is realised by surrounding a thin (∼nm) layer of low bandgap material with a different lattice matched material of higher conduction band offset. This creates a quantum hole with individual energy levels along one spatial dimension. Additional energy levels need to be introduced into the sequence for proper functioning of the laser (e.g. for efficient depopulation of the lower laser state), resulting in a set of quantum holes and barriers. Such a set is called a period or a cascade, and as is apparent from its name they can be stacked together quite easily as the major carrier are electrons. By heterogeneous stacking of periods, a gain spectrum at different wavelengths can be designed. Therefore, they can be periodically stacked. Several pairs of quantum wells and barriers on top of each other form a cascading structure enhancing the quantum efficiency of the process [39] and giving the lasers their name (QCL).
QCL chips emit a Fabry–Perot (FP) spectrum centred at a particular wavelength (design dependent) that can be broader than 10% of the central wavelength. One way to achieve single longitudinal mode lasing is to etch a diffraction grating on top of the laser stripe, which acts as a distributed Bragg reflector and provides feedback for a narrow band of wavelengths; such a laser is called distributed feedback laser (DFB). Tuning is achieved by either directly changing the temperature of the chip or by modifying its pumping current. This technique however only allows tuning of less than 1% of the central wavelength [45]. To overcome this limitation, several DFB lasers with different grating periods can be manufactured on one chip. Lasing from 5.9 to 10.9 μm with over 50 mW peak power throughout a wide range of wavelengths has been demonstrated [43].
A different approach is to use just one stripe, but use an asymmetric sampled grating DFB with an additional amplifier section [46]. With this configuration, over 5 W power in pulsed operation at 4.8 μm and tunability of 270 nm (300 nm) has been achieved, as well as 1.25 W in cw operation. By combining these two approaches [44], thereby creating a set of eight stripes with different sampled grating DFB with additional on-chip sections responsible for combining the beams, tuning from 6.2 to 9.1 μm has been demonstrated [44]. All the above mentioned designs emphasise probably the biggest benefits of semiconductor versus other laser types, i.e. small size, completely electronic tuning and enormous mass production potential.
Single mode lasing and tuning can also be achieved by mounting a FP laser into an external cavity (EC) [47]. Applying an antireflection coating on at least one facet of the QCL chip suppresses the FP modes and allows wavelength selection by tuning an optical element in the cavity. In Littrow and Littman–Metcalf configuration, a diffraction grating is utilised for this purpose, achieving laser line widths of below 1 cm−1 [48, 49]. An alternative to this is the use of interference filters and retroreflectors. This has been successfully demonstrated [50] over a wavelength range of 4–4.3 μm and shows comparable results to grating based designs. If broader emission wavelength can be tolerated, acousto-optic modulators (AOM) and simple mirrors can also be used for tuning, thus achieving switching time between wavelengths under 1 μs [51] instead of several milliseconds, typical for micro-electro-mechanical systems. Dual wavelength operation and tuning is also possible with AOM tuning [52].
EC-QCLs with tuneability in pulsed mode from 7.6 to 11.4 μm, with peak power of up to 1 W and average power of 15 mW have been realised [41]; higher powers have been achieved in the narrowed band of 7–8.9 μm with a maximum power of 200 mW [42]. Even by placing the QCL chip in these complex external cavities, the size is still reasonably small, of the order of a few tens of cm. However, the spectral range coverage of most commercially available laser chips is not sufficient to cover the full wavelength range of interest. To overcome this limitation, several individual EC-QCL chips are combined into a system with a common output port.
2.2. Supercontinuum sources
Supercontinuum sources are well known to be powerful tools for microscopy and spectroscopy applications due to their high brightness and very broad spectrum. Supercontinuum generation was first demonstrated in bulk borosilicate glass by Alfano and Shapiro [53]. In this process, narrow band optical pulses undergo significant spectral broadening through the interplay of a variety of nonlinear optical effects in the propagation medium, yielding a spectrally continuous output. Optical fibres have proven to be particularly suitable for this purpose, as the light is strongly confined over long interaction lengths, which enhances the efficiency of nonlinear effects. With the advent of fibre technologies, such as high power pump diodes and gain fibres, as well as the development of new optical fibre materials, geometries and dispersion profiles, it is now possible to design and build broadband supercontinuum sources at wavelengths from ultraviolet to the infrared [54, 55].
In recent years, a great deal of effort has been put into extending emission capability into the MIR. This pursuit requires the use of novel fluoride based fibres with transmission windows in the 2–5 μm region and chalcogenide materials that allow supercontinuum generation extending to 13.3 μm [56, 57]. In the 2–4.5 μm region, power spectral density values of several hundred μW nm−1 have been reported [56]. Beyond 5 μm, experimental demonstrations have shown power spectral density levels of 1–2 μW nm−1 [58]. Simulations of alternative conversion schemes indicate that there is potential to achieve power densities of over 10 μW nm−1 at wavelengths as long as 10 μm [59]. However, it is worth noting that current commercially available MIR supercontinuum sources do not extend beyond a wavelength of 4.5 μm (around 2200 cm−1).
Fibre based supercontinuum sources have a high inherent beam quality, enabling diffraction limited performance and high spatial coherence. Due to their large spectral bandwidth, supercontinuum sources exhibit extremely low temporal coherence effectively eliminating speckle in broadband illumination situations. However, applications that require narrow filtering of the supercontinuum may exhibit speckle [60].
Furthermore, fibre based MIR supercontinuum sources can be made compact, robust, and affordable ($50K–$100 K) thus making them very attractive for practical applications. While only just appearing on the market, commercially available MIR supercontinuum sources are relatively inexpensive and can be purchased for comparable prices to those of current commercial turn-key QCL systems in the same wavelength range.
As supercontinuum sources are inherently broadband, their direct use for hyperspectral imaging requires a spectrometer or wavelength selection element. Utilising acousto-optic tuneable filters (AOTF), they can also be operated in a narrowband imaging scheme which has been demonstrated for wavelengths up to 4.5 μm [60, 61]. Yet, at any longer wavelengths, there are currently no commercially available AOTFs. Thus, the use of longer wavelength supercontinuum source requires an interferometer, monochromator or a novel upconversion scheme [62].
In summary, globars are still the most universal low cost option available to cover the entirety of the spectral range of interest, but lacking brightness, especially for high resolution imaging. Synchrotrons and FELs are bright tuneable light sources, but very expensive and relatively inaccessible. Supercontinuum sources are close to performing as well as synchrotrons, but do not cover the full MIR spectrum with sufficient power. QCLs are becoming commercially mature (in the short wavenumbers 800–1800 cm−1) and offer spatially and temporally coherent radiation in the longer wavelength MIR range, but may require a multi-chip design to cover arbitrarily wide spectral ranges.
3. Mid-infrared detection systems
A primary limitation for widespread exploitation of the IR spectrum for imaging applications is associated with a lack of sensitive, robust and easy to operate detection systems. In comparison to visible detectors, IR detectors generally suffer from noise originating from their own components emitting room temperature black-body radiation; hence, low noise performance can only be achieved through cryogenic cooling. Cold shields can be used to minimise the contribution from black-body radiation from surrounding objects entering the detector.
Generally, light detection is based either on the absorption of photons by a sensor material resulting in a temperature increase which can then be detected (thermal detectors) or in the creation of electron–hole pairs giving rise to a current (photonic detectors). Both these principles are routinely used for IR detection and can be considered mature technologies optimised for decades. Nevertheless, these detectors are still hampered by the need for cooling resulting in high operational cost, complexity and size for low noise operation.
Recently, new types of detectors have emerged due to new technological achievements. These detectors have different working principles and can overcome traditional shortcomings for special applications.
3.1. Thermal detectors
A thermal detector is based on the temperature increase produced by absorbed incident photons, which can be detected as a change in a temperature sensitive physical property of the material. These detectors generally have slow temporal response, often in the millisecond range, set by the thermal relaxation time of the sensor material. The spectral response of thermal detectors depends on the absorption characteristics of the material used. Thermal detectors are efficient for detection of high brightness signals, and can be operated without cryogenic cooling. One of the major sources of noise in thermal detectors relates to ambient thermal fluctuations transformed into a variation in the conductance of the sensor material. In general, thermal detectors need to have a low heat capacity for fast response time and good thermal isolation from the surroundings [63, 64]. Applications of thermal detectors are generally limited by their slow response time and lack of sensitivity, due to unwanted black-body radiation from surroundings and temperature fluctuation in the detector material particularly in the non-cooled versions. Thermal detectors are divided into different categories based on the physical property responsible for generating the output signal in response to the temperature variation. Two commonly used thermal detectors are presented below.
3.1.1. Bolometers
The bolometer is a widely used thermal detector whereby the incident radiation is absorbed in the sensor material, increasing the temperature of the material relative to the surroundings. The sensor material has a temperature-dependent electrical resistance, which can be read out as a voltage when passing a current through the bolometer. The voltage can be expressed as:

where  is the temperature coefficient of resistance of the sensor material that determines the sensitivity of the bolometer. Preferred materials for bolometers should have low heat capacity, low room temperature resistance and a large thermal coefficient of resistance.
IR imaging in the long wavelength regime, e.g. 8–14 μm, can be achieved using microbolometer arrays. These arrays consist typically of 320 × 240 pixels, however larger arrays with 640 × 512 pixels are emerging. The individual pixel dimension is of the order of 20 μm × 20 μm; however, as the pixel size decreases and thus the number of pixels per unit area increases, a larger noise equivalent temperature difference results due to smaller pixels being less sensitive to IR radiation [65].
3.1.2. Thermopiles
The thermopile is another type of thermal detector, where the temperature change is measured through a series of thermocoupled devices. An infrared absorption film is deposited on one side of the junction of a thermopile consisting of a series of thermocouple pairs. Each pair has a junction of two conductors on either side of a thermal resistance layer, resulting in a voltage in the range 10–100 mV proportional to the temperature difference,

where  are the Seebeck coefficients (the magnitude of an induced thermoelectric voltage in response to a temperature difference across that material) of the two conductors forming the junction of the thermocouple pair, N is the number of thermocouple pairs and
  is the temperature difference caused by the absorbed IR radiation.
The sensitivity and the frequency response of thermopiles are inferior to bolometers, nevertheless thermopiles are cost efficient and have found several applications in the medical, farming and automotive industry [63, 64].
3.2. Photodetectors
The working principle of photodetectors is based on the photon absorption in a semiconductor material resulting in an electronic transition generating a free charge carrier. The bandgap of the semiconductor dictates the working wavelength range. Silicon (Si) is the preferred material for detectors in the visible and near-infrared (NIR) range, between 350 and 1100 nm. Moving towards longer wavelengths, indium gallium arsenide (InGaAs) is the detector material of choice covering the range between 0.85 and 1.7 μm [66]. Indium antimonide (InSb) can be used in the range 3–5 μm, whereas mercury cadmium telluride (MCT) is commonly used in the wavelength ranges 3–5 and 8–12 μm [63, 67, 68].
Generally, Si and InGaAs detectors can have very high quantum efficiency reaching more than 90%, thus approaching single photon counting sensitivity, and have a rise time in the order of 10–100 ps. In contrast, InSb and MCT based detectors typically have rise times in the order of 10–100 ns or more. The low bandgap energy of the IR detector has a great impact on the noise performance, both in terms of internal noise as well as sensitivity to black-body radiation originating from the detector surroundings. In practical applications where high sensitivity is needed, the InSb and MCT detectors are actively cooled in order to obtain low noise levels.
3.2.1. InGaAs and InSb detector
Si and InGaAs detectors are divided into PIN diodes and avalanche photodiodes (APD). In both cases the detector operates in the reverse-biased region, which is known as photoconductive mode. The APDs work in the high voltage reverse-biased region, where the signal-to-noise ratio can be improved by the internal current gain due to the avalanche effect. APDs can be applied for single photon detection when operating in the Geiger mode.
A great variety of InGaAs detectors has been developed for different applications; table 1 lists the properties of two typical APDs, working in the linear regime and Geiger mode, respectively. Generally for all detectors, there is a trade-off between high quantum efficiency, low noise and high bandwidth.
Table 1. Properties of IR detectors.
| Detector type | Wavelength range (μm) | Working temp. (K) | Quantum efficiency | Band width/maximum count rate | NEP  /dark count rate s−1 /dark count rate s−1 |
|---|---|---|---|---|---|
| InGaAs APD [69]a | 0.85–1.65 | 260 | 64%@1550 nm | 0.9 GHz | 0.24 |
| MCT [70] | 2–12 | 195 | ≥31%@6 µm | ∼20 kHz | 0.5 |
| Bolometer [71] | 15–2000 | 4.2 | N/A | 300 Hz | 0.12 |
| InSb photovoltaic detector [72] (Hamamatsu) | 1–5.5 | 77 | — | — | 1.1 |
| InGaAs APD [73]b | 0.9–1.7 | 183 | 25%@1550 nm | ∼200 KHz | <100 |
| SNSPD [74] | 0.8–1.8 | <1 | >75% | >20 MHz | ∼300 |
| Upconversion detector [75] | 1–20c | ∼300 | 93%@1550 nm | >1 GHz | 100 |
aThe detector works in the non-Geiger mode. bThe detector works in the Geiger mode. cThe upconversion detector in [26] is based on PPLN crystal, and it has only a few sub-nanometres detection range centred at 1550 nm. In order to achieve detection wavelength range from 1 to 20 μm, different kinds of nonlinear crystal should be applied, as shown in table 3.
InGaAs can also be applied for NIR imaging. Table 2 lists the parameters of an InGaAs camera provided by Hamamatsu [76]. Compared to silicon-based cameras used for visible light imaging, the InGaAs cameras suffer from higher dark current and larger readout noise as a result of the lower bandgap. InSb photovoltaic detectors reach further into the MIR then InGaAs systems and cover the wavelength range from 1 to 5.5 μm [77]. They however require to be cooled with liquid nitrogen like MCT detectors. Their noise performance is better than an MCT but as their spectral, coverage is smaller they are not used for biomedical imaging applications often.
Table 2. Properties of IR cameras.
| Detector type | Spectral band (μm) | Frame rate (FPS) | Working temp. (K) | Field of view | Dark Current (electron/pixel s−1) | No. of pixels |
|---|---|---|---|---|---|---|
| InGaAs [76] (Hamamatsu) | 0.95–1.7 | 7.2 | 203 | — | 130 | 640 × 512 |
Bolometer  [78] [78] |
8–14 | 100 | 273–323 | 30° × 23° | — | 384 × 288 |
| MCT FPA [79] | 2–12 | 1500 | 77–190 | — | 100 | 320 × 255 |
| Upconversion detector [80] | 1–20 | 25 | 300 | 20° × 20° | — | 265 × 265a |
aThe numbers mentioned are for a specific system which vary accordingly based on several parameters, such as wavelength range and nonlinear crystal used in the module.
3.2.2. MCT based detector
MCT is an alloy composed of CdTe and HgTe. The absorption wavelength is determined by the amount of Cd in the alloy. MCT detectors can cover a relatively large wavelength range (2–12 μm), which makes them good candidates for Fourier transform infrared (FTIR) spectrometers. Table 1 shows one commercial MCT detector made by VIGO System S.A. [70]. Table 2 lists the parameters of a MCT Focal Plane Array (FPA) for MIR imaging. MCT detectors have better performance than thermal detectors in terms of speed and noise, although they are still inferior to InGaAs detectors. However, MCT detectors have been the detector of choice for MIR wavelengths, to which the InGaAs detectors are insensitive. The bandgap of MCT is smaller than that of InGaAs allowing it to detect longer wavelengths; however, this is also the main reason for the higher noise level. In practical applications, MCT detectors are usually actively cooled in order to reduce the noise.
3.3. Upconversion based IR detectors
Upconversion based detection is a fundamentally different approach for IR sensing. Using upconversion the low energy IR radiation is not detected directly, rather it is mixed with a high brightness laser in a transparent nonlinear medium, shifting both the spectral and spatial information from the low energy infrared range to the NIR or visible range, for which sensitive and fast detectors exist. Using a transparent medium for the nonlinear process means that no black-body radiation from the medium is added to the IR signal, which is in strong contrast to direct detection where the medium has to be highly absorbing. Secondly the nonlinear process imposes a strong spectral and spatial filter to the upconversion process, limiting the spectral bandwidth and field of view of the detector, hence reducing the black-body noise picked up from the surroundings.
Upconversion is a parametric process and follows the principle of energy and momentum conservation (equation (3) and figure 2)

where h is the Planck constant, c is the speed of light,  i and ki are the wavelength and the wave vector for each specific photon. It should be emphasised that the phase matching condition acts in all spatial dimensions; therefore the upconversion photon preserves the spatial information of the IR photon, which makes upconversion imaging possible.
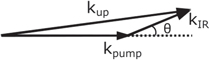
Figure 2. Non-collinear phase matching diagram.
Download figure:
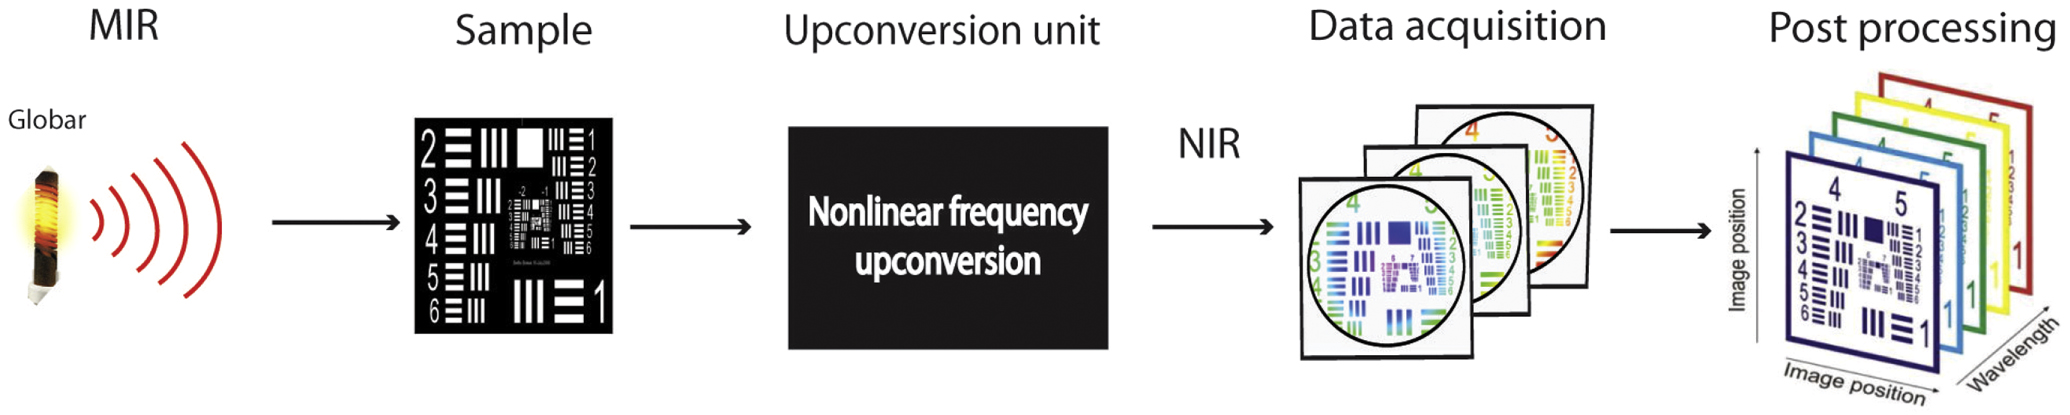
Standard image High-resolution imageUpconversion technology has been exploited for both point detection [81] and for imaging configurations [80, 82, 83]. Recently, a conversion efficiency of 20% has been demonstrated which presents the upconversion scheme as an emerging technique for MIR detection [74]. Figure 3 shows an example of upconversion-based measurement of MIR hyperspectral imaging.

Figure 3. A schematic of IR spectral imaging based on upconversion technology.
Download figure:
Standard image High-resolution imageHere, a globar is used as broadband illumination source, whilst an upconversion unit converts the transmitted radiation from the sample from MIR to NIR and a silicon-based camera captures the images. The acquired broadband images are then post processed to obtain a hyperspectral datacube made of a series of monochromatic images.
Tables 1 and 2 list the performance properties of different IR detectors including the detector based on upconversion technology. Upconversion can be used over a substantial part of the IR spectral range depending on the nonlinear crystal used. Table 3 shows the properties of some commonly used nonlinear materials for the upconversion.
Table 3. Properties of nonlinear crystals for upconversion detectors.
| Nonlinear crystals | Transparency range (μm) | Nonlinear coefficient (pm V−1) | Thermal conductivity (W m−1 K−1) |
|---|---|---|---|
| Lithium niobate (LN) | 1–4.5 | 14 | 4.6 |
| Lithium thioindate (LIS) | 1–8 | 7 | 6 |
| Silver gallium selenide (AGSe) | 1–20 | 33 | 1 |
| Silver gallium sulphide (AGS) | 2–11 | 11 | 1.4 |
The choice of the nonlinear material is very important for a given application, not only should the material be as transparent as possible to the IR wavelengths in order not to introduce thermal noise, but it should also be able to phase match the nonlinear process while preferably having a high nonlinear coefficient for efficient frequency conversion. So far lithium niobate (LN) has been the preferred material for upconversion detection. It has been used in an intracavity configuration both for spectroscopic and imaging applications, however limited by the transparency range (to below 4.5 μm). At wavelengths below 12 μm, silver gallium sulphide (AGS) has been used both for imaging [82] and spectroscopy [84]. However, other features may also be important depending on the application, e.g. AGS has very poor thermal conductivity, which means that it cannot be used in intracavity configurations for imaging applications as thermal lensing within the crystal will distort the images. Silver gallium selenide (AGSe) may be an interesting candidate even at longer wavelengths; however, AGSe can only be phase matched with relatively longer mixing wavelengths, e.g. 1.9 μm, and consequently needs to be combined with InGaAs detectors rather than Si detectors, thereby increasing the overall cost and complexity of the system.
Upconversion detection has also been demonstrated using periodically poled LN waveguides (PPLN-W). Comparing PPLN-W with upconversion in the bulk nonlinear crystals, high internal conversion efficiency in PPLN-W can readily be achieved even with modest mixing powers due to the spatial confinement of the interacting fields inside the waveguide [81, 85]. If a broadband illumination source is used, the spectral resolution of the system can be set by the phase matching properties on the nonlinear process.
Furthermore, upconversion can be used for IR imaging. In this case, the spatial resolution of an upconversion detection system is primarily determined by the beam diameter of the mixing field, which serves as a soft aperture in the imaging system. However, both the spatial and spectral resolution of the imaging system depends on the IR input wavelength [83, 86].
Upconversion detection has a very small acceptance angle, which can strongly inhibit the ambient noise. In contrast, conventional detectors need a cold shield to block the ambient radiation from almost 2 solid angle. A second source of noise is false IR photon generation through a spontaneous parametric down conversion process (SPDC). These IR photons will be indistinguishable from the signal IR photons. High pump power is usually needed to achieve high conversion efficiency, however the upconverted SPDC noise is roughly quadratically proportional to the pump power and can be considered a trade-off between high efficiency and low-noise. For some cases, the noise power can be as high as few pW. The widely used periodic poled nonlinear crystal, PPLN, is very attractive, below 4.5 μm however random duty cycle errors induced in the fabrication of the poling structure enhances USPDC noise [87] in comparison to the bulk crystal. Further techniques utilising quantum phenomena with potential to improve MIR imaging technology are induced quantum-coherence imaging [88] and field-resolved spectroscopy [89, 90], although they have not been applied to real world samples yet.
4. Mid-infrared micro spectroscopy
The magnification and spatial resolution of an IR microspectroscopy setup is defined by the wavelength and the collection optics in combination with the pixel size of the camera.
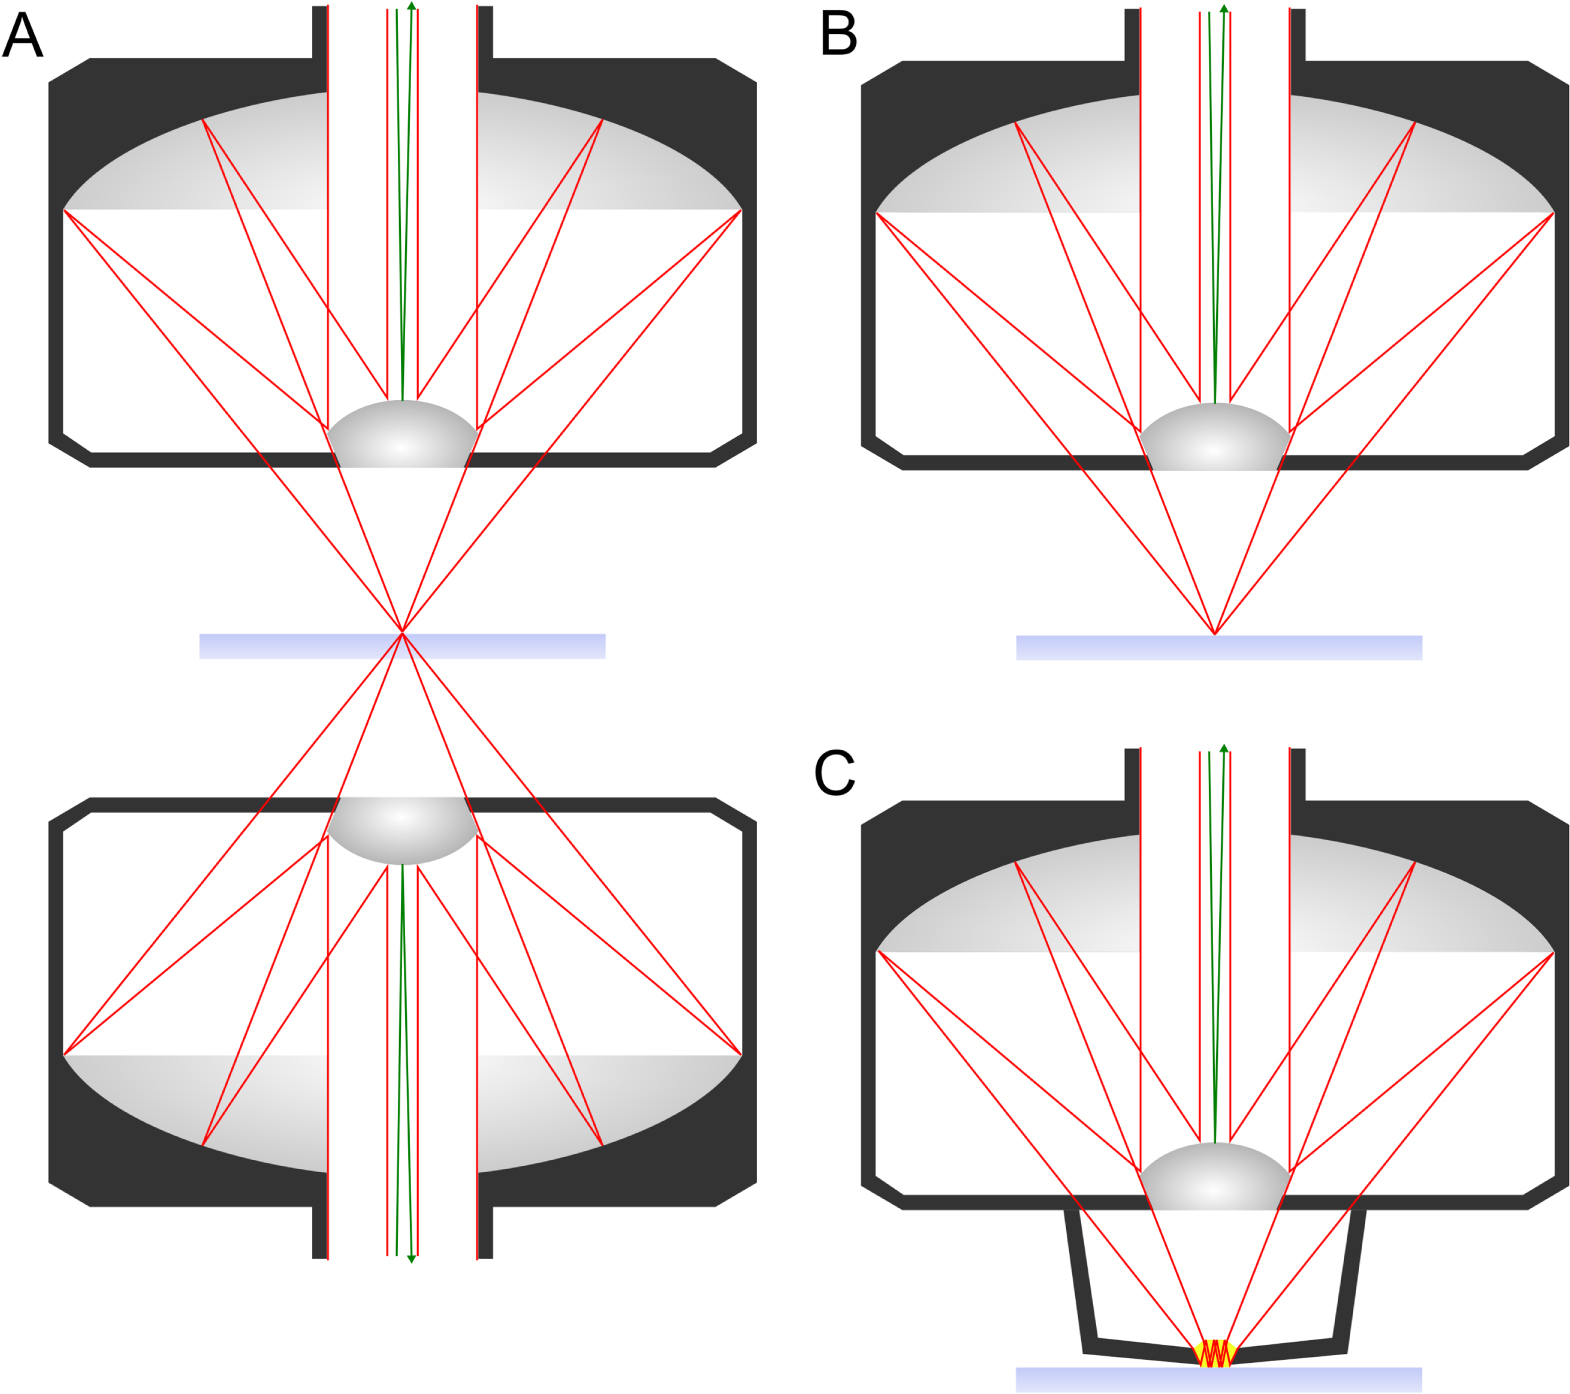
The choice of the optical setup is heavily dependent on the light source and detection system. For incoherent light sources such as a globar, the use of reflective optics is generally considered favourable. Most commercial FTIR microscopes employ Schwarzschild optics [91] which consist of a matched pair of Cassegrain objectives (figure 4(A)).
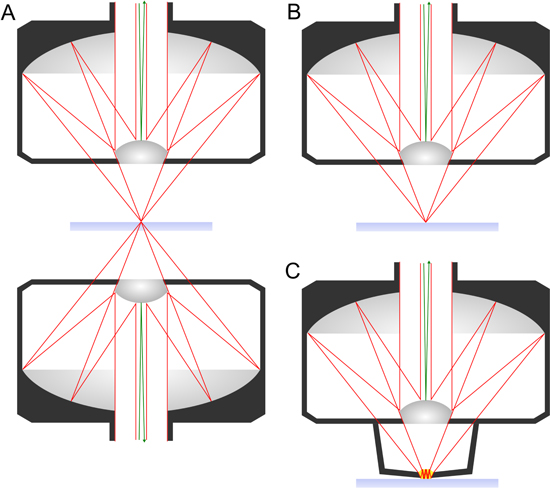
Figure 4. Schematic diagram of three distinct optical configurations for MIR hyperspectral imaging. The beam path is outlined in red lines and the central obscuration in green lines. (A) Set of Schwarzschild objectives used in transmission mode. (B) Schwarzschild objective used in transflection mode. (C) Combination of Schwarzschild objective with ATR crystal for total internal reflection mode.
Download figure:
Standard image High-resolution imageThe Cassegrain objective has a central convex mirror that is held in place by a spider mount, reflecting the incoming beam onto a secondary concave mirror above it. The secondary mirror focuses the beam onto the sample. This configuration can correct for spherical aberration, coma and astigmatism over a wide range of wavelengths [92]. Moreover, the Cassegrain objective can be used as a solid immersion objective, with higher magnification and higher numerical aperture than common lenses by the use of a high-refractive index crystal e.g. germanium (n ≈ 4), hence increasing the spatial resolution [93].
Reflective optics only suffer from minimal broadband absorptions and thus usually give higher flux than refractive optics. Furthermore they are not subject to chromatic aberrations. Therefore, Schwarzschild optics have proven to be most economical for non-coherent imaging. The central mirror and the spider legs holding it in place, however, can cause obscuration of the image, which is negligible for incoherent light sources but can be a problem with coherent ones [94]. Coherent light sources usually have higher brilliance, leading to more intense focused beams. Therefore, some losses due to lower optical throughput of refractive optics can be tolerated when considering the gain in imaging quality using these sources. Furthermore, the benefit of not having obscuration outweighs the loss of flux.
MIR microspectroscopy can be realised in three different configurations, as shown in figure 3. In the transmission mode, the sample is illuminated via a condenser and the transmitted light is collected in the forward direction by an objective (figure 4(A)). To collect light in the backward configuration, samples can be mounted onto reflective substrates, so that the one objective serves as focusing and collection optic at the same time. The beam is focused onto the sample, is reflected by the substrate, passes the sample a second time and is collected by the objective (figure 4(B)).
The third way to realise imaging is by attenuated total reflection (ATR) using a high refractive index crystal (internal reflection element, IRE). For this purpose, an ATR crystal is placed in contact with the sample, and the IR beam is directed into the crystal and is internally reflected at the interface between the crystal and the sample (figure 4(C)). This results in an evanescent wave propagating orthogonally to the surface into the sample. Some of the energy of the radiated field is absorbed by the sample, resulting in an attenuation of the light reaching the detector. When the critical angle (θc = sin−1(n2/n1), where n2 and n1 are the refractive indices of the sample and the crystal, respectively) is exceeded, a purely ATR spectrum is observed. Valuable reviews have been published by Kazarian and co-workers on advances and applications of ATR-FTIR spectroscopic imaging to biomedical samples [95, 96], and pioneering work in biomedicine [97] includes the application of this technology to the studies of atherosclerosis [98–100].
The choice of sampling mode has a major influence on the sample preparation required. Imaging in ATR mode requires the least sample preparation as the crystal is simply pressed onto the sample. The effective sampling volume depends on the internal reflection element material and incident angle but usually reaches around 1–3 μm into the sample [96]. Transmission and transflection modes however require the sample to be mounted on a transmissive or reflective substrate. For the transmission mode, monocrystalline calcium fluoride (CaF2) or barium fluoride (BaF2) slides are the optimal substrate. These substrates are expensive (>100$/slide) and brittle. Transflection measurements require reflective substrates. The most common way to achieve this is by coating glass slides with either gold or a low-emissivity (low-e) coating consisting of a very thin aluminium layer covered by a thin oxide layer. Those substrates are cheaper (<5$/slide) than the monocrystalline ones commonly used for transmission IR.
Apart from the difference in the sample preparation, the sampling geometries can also cause further different effects to the spectra. Whereas influential factors on the image itself are well understood, there are furthermore important effects with regard to the spectral domain, which are less recognised. The aim in MIR imaging is to obtain transmission/absorption spectra from the samples. In the microscopy case, this aim can be perturbed by the fact that features of interest are of the same order of magnitude in size as the wavelength used for probing. Therefore Mie scattering [101] can be observed in some cases. Bassan et al developed an algorithm to correct for spectral distortions caused by Mie scattering, also incorporating resonance effects [102, 103], i.e. related to the change in imaginary refractive index at spectral absorbance peaks. The algorithm has recently been further optimised by Konevskikh et al [104, 105].
In transflection sampling, a different type of spectral distortion first referred to as electric field standing wave effect (EFSW) was reported by Filik et al [106] and Wrobel et al [107, 108]. A rigorous investigation of the theory by Joe Lee [109] however proposes that these effects are not due to a standing wave in the classical sense but can rather be explained by interference between reflections from a variety of different sample planes.
The formation of an image can be achieved in several ways; the two most common commercially available approaches are wide field imaging and point scanning. In wide-field imaging, the image is obtained by combining optics with a camera to obtain spatial resolution [110]. Hyperspectral information can then be obtained by introducing an interferometer, or wavelength filters into the beam path or by using a tuneable monochromatic light source and collecting individual images at several wavelengths. In point scanning, the light is focused into a diffraction limited spot, which is scanned across the sample [111]. The transmitted or transflected radiation can then be recorded on a single element detector. Spectral resolution can be obtained in the same fashion as in wide field imaging as well as by using a diffraction element and dispersing the spectrum onto an array or line detector. Note that this latter approach should be described as mapping rather than imaging. For diffraction limited imaging, a wide-field approach is easier to realise and usually allows for faster data acquisition than point scanning. Point scanning systems have a much higher requirement on mechanical stability and therefore are more difficult to construct. However, if a coherent light source is used, a point scanning system is not affected by speckle, as the spatial and phase variation in the beam wavefronts and associated interference are not resolved, as it would be in a wide field imaging system.
There are major differences in the nature of data obtained by discrete frequency (or monochromatic) sources and continuous sources. Continuous or broadband sources are most often used with interferometers, to take advantage of the Felgett and Jaquinot advantages [112]. In this text and in common parlance, these systems are usually referred to as Fourier transform (FTIR) spectrometers and the resulting data as FTIR spectra or data; whereas datasets of discrete sources will be referred to as discrete frequency IR (DF-IR) data.
FTIR data are essentially hyperspectral images with over 100 bands [113]. They also have the property that the bands are highly contiguous or overlapped, while DF-IR images generally consist of images at much less than 100 discrete wavelengths. For hyperspectral images this means that each pixel can be represented as a spectrum, while for DF-IR or multispectral images this is generally not the case. A comparison between hyperspectral and multispectral images is shown in figure 5.
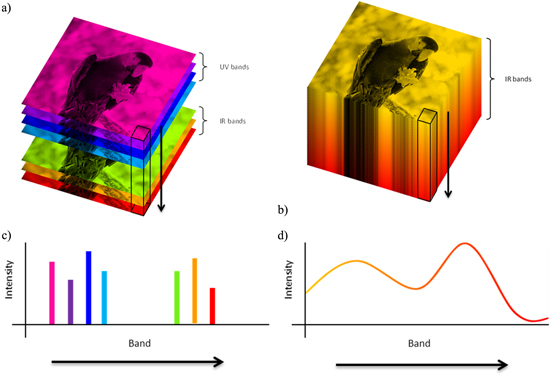
Figure 5. Illustration of (a) a multimodal multispectral image and (b) a single mode hyperspectral image. (c), (d) The intensity profiles for the pixels indicated in (a), (b), respectively.
Download figure:
Standard image High-resolution imageThe contiguous nature of the bands in IR spectra forming hyperspectral images allows application of a range of multivariate analysis techniques to extract the relevant chemical information. A hyperspectral dataset can be thought of as a data cube, with two spatial dimensions (x, y) and one spectral dimension (z). By unfolding the cube into a two-dimensional array, where each row represents the spectrum recorded for a single pixel, standard multivariate approaches can be applied. Refolding the processed array into a cube allows visualisation and interpretation of the data in the image domain that may not be possible otherwise, while the multivariate analysis allows for interpretation in the spectral domain as well.
Absorption of radiation occurs at IR frequencies that match the vibration frequency of chemical bonds in the molecules of the sample. The transmittance or proportion of light transmitted through the sample, T, is calculated as the ratio of the intensity of light passing through the sample I to the intensity of a background or blank I0. In microspectroscopy, the background is typically a clean area of the transparent slide or substrate used to hold the sample.

The transmittance is related to absorbance by a simple logarithmic transform:

For multivariate analysis it is usual to take advantage of the Beer–Lambert law, which states that the absorbance A at a given wavelength is proportional to the analyte concentration c:

where a(λ) is a wavelength dependent molar absorption coefficient and b is the optical path length. Many multivariate approaches assume linear relationships between variables, and using the Beer–Lambert law the results can be interpreted in terms of concentration.
5. Hyperspectral data analysis
5.1. General spectral preprocessing methods
A number of preprocessing steps are often required prior to undertaking detailed multivariate analysis of hyperspectral images in order to obtain meaningful results and interpretation. This section focuses on methods to analyse the spectral domain i.e. the unfolded data cube. These techniques have been developed in the context of FTIR data and some of them harness the continuous nature of the data, therefore application to DF-IR has to be considered with caution.
5.2. Normalisation
A key assumption when using the Beer–Lambert law is that the optical path length b (and molar absorption coefficient) is the same for each pixel. For histopathology applications, where the sample is a tissue section cut by microtome, variations in the sample thickness across the section result in a different path length. A normalisation step is therefore essential for comparing variations in absorption between pixels in an image. One simple approach is vector normalisation, which maps the spectra onto a unit sphere in multivariate space [114]. Other simple approaches include normalisation to constant total [114] and min–max normalisation, which scales each spectrum to between 0 and 1. Without normalisation, those pixels with lower signal because the tissue section is thinner will be given less weight in subsequent multivariate analysis, which may mask important variations due to compositional changes that may relate to pathology.
Another common approach to normalisation in IR spectroscopy is multiplicative scatter correction (MSC) [115, 116]. It attempts to account for scaling and offset effects by calculating a least squares fit of the measured spectrum to a reference spectrum. The measured spectrum is the corrected using the using the slope and offset of the fit. An extended multiplicative scatter correction (EMSC) has been described that allows for normalisation, baseline subtraction and filtering of unwanted signals in a single step [117, 118]. Examples of application of EMSC in histopathology include resonant Mie scatter EMSC (RMieS-EMSC) [119] and paraffin removal [120, 121].
Standard normal variate (SNV) has also been suggested as an alternative method for normalisation [122]. SNV centres a spectrum and scales it by its own variance. SNV gives more weight to values in the spectrum that deviate most from the mean value, which for FTIR corresponds to peaks in the absorbance spectrum. It is usually most successful when the spectra are quite similar e.g. between pathology groups. It has been shown that SNV and MSC are mathematically very similar [123, 124].
5.2.1. Baseline subtraction
In some cases there is unwanted background signal in the spectra forming an image. Specific approaches for background removal of signals due to atmospheric water vapour and resonant Mie scattering are discussed separately. For more general problems involving an undulating baseline, a polynomial subtraction approach can be used to subtract a best fit of the baseline. An iterative refinement of this approach is described in [125]. Sometimes the baseline will be too complex and a polynomial will not be capable of fitting the baseline without resorting to high orders that will over or under correct in some areas while fitting well in others. Approaches such as the rolling ball algorithm [126] and asymmetric least squares [127–129] may then be more appropriate. A comparison of various baseline methods for spectroscopic calibration has been published by Liland et al [130].
5.2.2. Derivative spectra
In microspectroscopy for histopathology, the complexity of the sample, consisting of potentially thousands of biochemical signatures, results in highly complex IR spectra with multiple overlapping peaks. A common and highly successful approach is to use derivative spectra; the use of 2nd order derivative spectra is particularly prevalent [131]. This has two advantages: firstly some baseline is removed without resorting to the methods described earlier (though this is limited to the derivative order minus one) and secondly it emphasises the shoulders of broad peaks when applying multivariate analysis. Disadvantages include making interpretation of subsequent analysis more difficult and emphasising noise. A Savitzky–Golay filter [132] is often used to calculate the second derivative and has the added advantage of smoothing at the same time, thereby reducing the impact of noise.
5.3. Specific preprocessing methods in biospectroscopy
5.3.1. Atmospheric water vapour removal
It is common practice to equip FTIR instruments with desiccant and a purge box to reduce the effect of absorption peaks from the atmosphere, in particular water vapour and carbon dioxide (CO2). Fortunately, the position of the CO2 peak at 2300–2400 wavenumbers (cm–1) is well outside the typical 'fingerprint region' and 'high wavenumber region' (1000–1800 cm−1 and 2600–3800 cm−1, respectively) and this region can simply be excluded. The effect of water vapour is however more serious as it overlaps with the fingerprint region, has numerous sharp peaks (associated with the rotational structure of the vibrational bending mode) and is highly variable. Research is ongoing to explore methods to compensate for the presence of water vapour in the spectrum [133–135], and there have been some successful applications [136]. Perkin Elmer includes a patented method for atmospheric vapour compensation in the software for their FTIR systems that is based on a simulated water vapour spectrum with very high spectral resolution [137, 138].
5.3.2. Resonant Mie scatter extended multiplicative scatter correction (RMieS-EMSC)
A known problem when using IR to examine biological samples, particularly cells, is that the light has a similar wavelength to the diameter of particles (or cells) in the sample. This causes scattering, known as Mie scattering, which appears as a strong sloping baseline in the spectra of the sample. The scattering contribution also distorts the spectral peaks (with artefacts such as derivative shaped absorbance bands) resulting in small shifts in the peak wavenumber positions of important biomolecules such as proteins, making peak assignment and interpretation unreliable. In histopathology and cytology samples, the total Mie scatter is generated by contributions from a range of particle sizes and other properties making it difficult to compensate for. Several attempts have been made to correct for Mie scattering contributions to FTIR spectra [139, 140], but the most popular approach uses a model for Mie theory that includes resonance [102]. First published in 2010 [119], the RMieS-EMSC algorithm incorporates a principal component model of resonant Mie scatter spectra generated from a theoretical basis into the standard EMSC algorithm as an interferent matrix (see below). Because the calculated scatter depends on the input spectrum, repeated applications of the algorithm have been shown to improve the correction but at the expenses of a considerable increase in computation time, particularly for hyperspectral datasets that contain tens of thousands to millions spectra. An approach using graphical processing units to parallelise the correction algorithm has been suggested as a way of mitigating this problem [141], but currently adds a level of complexity and expense that might prevent clinical uptake.
5.3.3. Paraffin removal
Motivated by the need to work with the current histological pathway, which involves formalin fixed, paraffin embedded tissues, some research groups have examined the possibility of using paraffin embedded sections. Until now most studies have used fresh frozen tissue because paraffin wax has a strong FTIR spectrum with peaks in the fingerprint region. Approaches investigated so far include chemical removal of paraffin using solvents such as xylene and hexane [142, 143] or chemometric methods that involve an EMSC step with a principal component model of paraffin wax spectrum as an interferent matrix [120]. Nallala et al demonstrated that the EMSC approach is as good as or better than the chemical removal of the paraffin contribution to FTIR microspectroscopy data of human colon tissue sections [121].
5.4. Visualisation and exploratory analysis
Although all of the multivariate methods described in this article ignore spatial information, it is still advantageous to interpret the information in the image domain in order to give some biological context. For example, it would be very difficult to identify a spectrum as being from a cell nucleus if it is not possible to see it in the context of the surrounding cell. The following methods are the most commonly applied for microspectral histopathology.
5.4.1. Intensity based images
Any approach that generates a value 'per pixel' can be used to visualise a hyperspectral image by refolding the result into an array with the same spatial dimensions as the original hyperspectral image. For example, maximum intensity, intensity at a single wavenumber or a fit coefficient from EMSC can all be used to generate intensity-based images. A false colour image can then be obtained in order to allow interpretation. Care should be taken to ensure that outlier pixels and the chosen colour table or bar do not unduly influence the visualisation and interpretation of the image [144]. Colour tables with discrete step changes in colour, rather than shade, should be discouraged for this reason.
5.4.2. Principal components analysis (PCA)
PCA is a data reduction technique that decomposes a dataset into a set of linearly uncorrelated variables called principal components (PCs) [145, 146]. PCA is useful in hyperspectral image analysis [147] because it provides information about the pixels in the form of principal component scores T, and the corresponding biochemistry in the loadings P.

where X is the unfolded array of pixel spectra. Because the scores for each component are per-pixel, they can be refolded into intensity images (see figure 5). In addition, examining the loadings for that component alongside the scores-based intensity image allows interpretation in both spectral and image domains. For histopathology applications, this enables spectral differences between pathology groups, for example, to be discussed in terms of biological structures in the tissue section. This is vital for comparison with standard histology that relies almost entirely on interpretation of the biological structures and only uses the biochemistry as a means to improve image contrast through the application of chemical stains, such as haematoxylin and eosin.
PCA outputs are the principal components listed according to a decreasing order of explained variance. Alternative approaches include minimum noise fraction [148, 149] and Min/Max autocorrelation factors [150] which order the components by signal-to-noise ratio.
PCA is applied as a processing method or, more often, as a preprocessing step before a classification method such linear discriminant analysis (LDA) or support vector machines (SVM) is applied. Including a PCA step reduces the influence of noise (by excluding components) and prevents over fitting by reducing the number of variables in the model, by combining those collinear variables found in the dataset together in one principal component, leaving only orthogonal components.
5.4.3. k-means clustering
k-means clustering is an exploratory algorithm that aims to divide the spectra into k groups, or clusters [151]. Each spectrum belongs to the cluster with the nearest mean, or centroid. Its primary use in hyperspectral imaging is as a form of visualisation. Clustering creates a new vector that contains a value indicating the cluster membership of each pixel. An image can then be generated by shading each pixel according to its cluster membership. In image processing terms, the image has been segmented and is now easier to interpret. For histopathology applications, not all of the clusters will be relevant and all spectra associated with those clusters can now easily be removed from further analysis. For example, in figure 6, an image of a human colon polyp section has been segmented by k-means clustering. It can be seen that cluster x corresponds to the substrate i.e. where there is no sample. These pixels can now be excluded from further processing e.g. by PCA, and the analysis can focus on describing the sample and not the differences between the sample and the substrate.

Figure 6. Comparison of (left panel) different visualisation methods for hyperspectral imaging versus (right panel) a standard histology stain for columnar glands.
Download figure:
Standard image High-resolution image
k-means clustering does have some disadvantages. For example, it can be difficult to choose an appropriate value for k i.e. the number of clusters. Too few and the segmented image is not informative. Too many and the clusters represent noise. Methods such as the silhouette width [152] exist to try and solve this problem but are often computationally intensive and can over, or under, estimate the number of informative clusters. In histopathology applications, in particular, the value of k that generates meaningful clusters biologically is often much larger than the number determined by the silhouette width. Other disadvantages include initialisation, which may result in different clustering each time the algorithm is applied to the same image, and the inability to use any distance measure other than the Euclidean distance. Modifications such as k-mediods [152] have been proposed to allow for the use of alternative distance measures, and other extensions are available such as fuzzy C-means (FCM) [153, 154], which allows for soft-cluster membership i.e. each pixel has some degree of membership to all clusters, and spatially-guided FCM [155] that takes into account both the spectral and spatial information during clustering. Furthermore, clustering performed on separate hyperspectral images often leads to regions with similar spectral signals being allocated to clusters with spectrally different centroids and colours in the different images. Common k-means on the whole dataset can overcome this problem at the expenses of significant computing resources. Self-organising maps, an unsupervised neural network [156], have also been used as alternative form of clustering for microspectral histopathology [157].
5.5. Predictive modelling
A long-standing goal of microspectral histopathology has been to make predictions for the diagnosis/detection of disease. In a data analysis context, this is usually framed as a classification problem. Applied approaches include LDA [114], partial least squares-discriminant analysis (PLS-DA) [158, 159], SVM [160, 161], random forests [162] and neural networks [163]. The approach taken by a number of studies is to generate healthy/normal/benign versus disease type models using pixels of interest extracted from hyperspectral images. Selection of these regions of interest is either guided by a pathologist or extracted using a technique like k-means, or by a preliminary classification model trained to identify different tissue types (e.g. stroma), or a combination thereof. The predicted pathology labels can be generated on a per-pixel basis and refolded for visualisation in a similar approach described previously for k-means. Figure 6 shows an example human colon section where the red and green pixels are the outputs of a predictive algorithm to detect cancer. Black pixels have been rejected as 'not-epithelium' and white pixels indicate the substrate, or absence of sample.
5.6. Chemometric analysis of discrete frequency IR images
Using FT-IR imaging is popular because use of the Fourier transform allows rapid collection of the entire spectrum. For biospectroscopy applications though there are regions of the spectrum that are not informative, either because they only contain noise or because they do not provide relevant information e.g. indicating the presence of disease. DF-IR has been proposed as an alternative that only collects IR images at specific ('discrete') wavelengths that are relevant to the problem being studied. In general, the number of relevant wavelengths is expected to be far lower than those in a whole FTIR spectrum, and thus using DF-IR may actually speed-up image acquisition, which is critical for translation of IR imaging into histology applications, for example. Because of the complexity of the samples in biospectroscopy, relevant targets for DF-IR imaging typically fall into bands, or blocks, covering regions of overlapping peaks that correspond to biologically important molecules, such as proteins. Thus, DF-IR imaging falls somewhere between multi- and hyper-spectral imaging. As such, many of the approaches described before, which work well for hyperspectral images, may no longer be suitable for DF-IR images. Alternative normalisation methods such as autoscaling (standardisation), or block scaling, will be more suitable due to the discrete nature of the wavelength regions being collected. Research is ongoing in this area as new instrumentation for collecting DF-IR images becomes available.
For DF-IR imaging to be successful, the right wavelengths have to be measured. The approach generally taken in the literature so far has relied on FT-IR imaging combined with variable selection methods to identify the relevant wavelengths for a particular problem. A number of variable selection methods are available for this purpose, and some recent examples for wavenumber selection in DF-IR imaging include Gini coefficients [164] and variable importance in projection scores [165]. Whichever method is used, a robust validation scheme is required to prevent overfitting and accidental selection of non-informative wavelengths, both of which would be detrimental to translation of DF-IR into clinical applications. Ultimately, the selected wavenumber targets have to be tested using a large external validation set to verify their suitability for a given problem. The problem-specific nature of wavelength selection required the selection to be applied afresh for every research question.
6. Biomedical applications
MIR transmission profiles were first considered as valuable for diagnostic purposes in 1949 by Blout and Mellors [166] who obtained bulk spectra from tissue sections and blood smears. Since then, research in this field did not really progress until the 1990s when FTIR microspectrometers became available [167]. Although tremendous progress in imaging technology has been made over the last decades [168], histopathological diagnostic routines have changed very little over the last hundred plus years [142, 169]. This could change soon with concepts of digital spectral pathology as pointed out in an excellent review by Bhargava and Madabhushi [170]. This section will provide an overview of the current research on MIR imaging technology for biomedical diagnostics. Focus lies on imaging tissue sections and cells. Further interest is increasing in the analysis of biofluids, or liquid biopsies, which is outside the scope of this article, but the reader is directed to a review by Baker et al [3] for more information on this.
6.1. Tissue imaging
As already discussed in the data processing section, IR hyperspectral images are directly correlated with the underlying biochemistry of the sample. Plotting metrics computed from IR spectra can be described as 'digital staining' i.e. an alternative to the chemical stains currently used in histopathology. Digital staining has the potential to provide more information than current chemical staining technologies. Increasingly complex information can be generated by treating three different intensity based images as a single RGB image. An example is shown in figure 6 which is the composite image of three selected principal components. One criticism of this approach is that the pseudo colour maps can be too colourful, which some pathologists may find off putting. A suggested alternative is to use approaches such as neural networks to generate images that look more like stained images and provide the equivalent of a chemically stained image without any chemical staining; so called stainless staining (124). An example using a PLS regression model to digitally stain a colon section is shown in figure 6. Advantages include visualising multiple stains for the same section and otherwise impossible stains e.g. for biomarkers or pathology indicators that do not currently have a chemical stain. The primary disadvantage is the decreased spatial resolution in IR images versus the visible, because of the longer wavelengths involved and the corresponding diffraction limit.
Digital staining, however, still relies upon a pathologist to interpret the resulting spatial distribution of biochemical signals as they would for conventional chemical staining, although each unstained section could be digitally stained for various different biomolecules of interest. The true benefit is gained by predicting pathology directly from the combined chemical and spatial information. Old et al demonstrated classification accuracies of 100% while denying decision for 30% of the samples for the diagnosis of oesophageal adenocarcinoma [171]. Tiwari et al demonstrated the use of a QCL microspectroscopy setup for the identification of infiltration and fibrosis in endomyocardial biopsy samples to assess transplant rejection, achieving 82.87% overall accuracy without neglecting samples [111]. There are numerous more examples of proof of concept experiments achieving classification accuracies between 70% and 95% [164, 172–182].
The most common problem in this research however is that sample numbers are usually relatively small which makes classification models susceptible to the curse of dimensionality [170, 183]. If a single spectrum consists of more data points than there are samples, classifiers have significant chance of picking up random variations as features for classification. This can be overcome by applying dimensionality reduction methods such as PCA or increasing the sample size. Higher sample numbers however are difficult to collect, measure and analyse. A common shortcut, here, is to utilise tissue microarrays (TMA) which are paraffin blocks consisting of selected biopsy sub-sections from different samples arranged in an array specifically used for medical research. Individual sections can then be taken that include cores of many tens to hundreds of tissues samples. This provides a good distribution of tissues, pathologies and patients, and it is simpler for the pathologist to classify each sample. The disadvantage of this is that it does not represent the large samples and variance found within individual samples that a pathologist would usually make their diagnosis from. A very good example of utilising TMAs for this purpose is given by Bhargava et al [184]. Another big challenge in the field is to find a uniform approach for data acquisition to make use of the spectral information, suppressing perturbation from individual instrument response functions [185].
6.2. Cell imaging
FTIR imaging of single cells is of interest for a number of reasons. Firstly, cultured cell lines form the basis of many enquiries in the biological sciences research field. They have proven to be robust model systems for assessing metabolic, morphological and general biochemical changes occurring both in healthy and disease states. Cultured cell lines, being clonal cells, provide high reproducibility. Furthermore, the cellular environment can be tightly controlled through media composition and CO2 incubators. This consistency is important for a valid association of spectral changes with specific biochemical processes. FTIR imaging of cultured cell lines has been used to investigate a range of cellular events, such as changes in chemical composition during the cell cycle [186–189], and changes in protein acetylation levels [190, 191]. FTIR imaging further enables label-free identification of subcellular structures as shown by Clède et al [192]. Ratios of specific IR bands were used to identify organelles such as the nucleus and the Golgi apparatus. The results were corroborated by fluorescence microscopy.
Secondly, some lines of enquiry deal with cells that naturally exist in a unicellular form. These include unicellular organisms, such as bacteria [193, 194] and yeast [195, 196], as well as highly specialised cell types from multicellular organisms, including blood cells [197, 198] and sperm cells [199]. A recent review explores the application of vibrational spectroscopy, including FTIR imaging, on microbial cells [200]. As for imaging of tissue sections, FTIR imaging of single cells also has clinical potential. For example, a label-free non-invasive method for assessing the health of single sperm cells has great potential for assisted reproduction.
Details of sample preparation vary depending on the cell type and the aim of the study. Adhesive cells can be grown directly on a FTIR suitable substrate, such as CaF2. Cells grown in suspension need to be deposited onto the substrate in a different manner. However, in broader terms, sample preparations can be divided into two main approaches: fixation of cells and live cell preparation.
6.2.1. FTIR imaging of fixed single cells
Fixation of cells aims to preserve the integrity of the subcellular biomolecules and structures after removal of the growth media. Common fixatives include solutions of formaldehyde (formalin), ethanol, and methanol. The mechanism depends on the fixative used. Formaldehyde induces covalent crosslinks between molecules. Alcohols dehydrate the sample, denaturing and precipitating proteins. Common for the fixation methods is the removal of water by letting the sample dry out, thus reducing the problem of water absorption in FTIR measurements.
Caveats on the use of FTIR imaging of fixed cells primarily relate to the often significant Mie scattering and unwanted artefacts introduced by the fixing and drying procedure which can be addressed by correction routines as discussed in the previous section.
Sample preparation artefacts can affect the interpretation of the FTIR spectra. Consistency in sample preparation is essential for valid comparison between different samples. However, interpretations concerning peak positions and intensities may not relate to the chemical composition of the live cell prior to fixation. Indeed, detection of DNA within cells is highly dependent on the hydration level of the sample, as described by Wood [201]. Upon fixation and dehydration, DNA undergoes a conformational change from B-DNA to A-DNA. As a result, the DNA peaks become harder to detect, as they broaden and appear more diffuse. Certainly, accurate peak assignments are non-trivial in complex samples such as cells. However, the identification of reliable markers for molecules of interest are essential for meaningful biological interpretations of FTIR spectra. Recently, the spectral contributions of RNA were assessed in the context of eukaryotic cells [202]. Through experimental strategies the most reliable indicators of the presence and levels of RNA were identified. Importantly, some spectral contributions known from single molecule measurements proved not too be meaningful indicators in cells because of overlaps with other cellular components.
6.2.2. FTIR imaging of live single cells
FTIR imaging of live cells circumvents the artefacts of fixation. It further allows for real-time measurements of samples as well as measurements of water in a biological context. Recently, Shinzawa et al probed protein hydration in cells using disrelation mapping with −OH and amide II bands [203]. They showed that it was possible to identify different molecular states of water within cells, and identify regions of interactions between water and protein, namely protein hydration. As such, live cell imaging means the biological relevance of the FTIR spectra are greatly enhanced. However, while the presence of water is an advantage for biological samples and its strong IR absorption can be exploited for probing protein hydration, it is generally seen as a disadvantage for the FTIR measurements. To reduce the effect of water absorption, minimisation of the optical path length in transmission mode measurements is essential.
Sandwiching cells between two substrates can reduce the optical path length, while maintaining a suitable environment for the cells, as shown by Whelan et al [189]. However, this technique is only suitable for short-term measurements, as it does not allow for maintenance of the cellular environment through replenishment of the medium. For better control, microfluidic approaches are required.
Microfluidic device architecture can be varied depending on cell type and experimental design. Choice of device material must consider biocompatibility and available microfabrication techniques, as well as transparency regions. Materials that are fully transparent in both the visible and MIR regions are arguably preferred, as they enable the combination of FTIR imaging with conventional microscopy [204]. Microfluidic devices based on transparent FTIR substrates such as CaF2 and BaF2 are therefore popular. Surface modifications (patterning of microstructures) and drilling of the windows allow for the construction of bespoke microfluidic devices [205–209]. Microfluidic devices have also been combined with reflection mode FTIR imaging, in particular ATR-FTIR [96, 210, 211]. These devices are typically open-channel, and thus come with their own advantages and disadvantages. Evaporation of the medium can be a concern, so humidity must be kept high. On the other hand, cells can be maintained within a very thin layer of medium without the induction of mechanical stress, which the flow through narrow spaces in closed devices can induce.
It is worth noting that to date, the majority of published transmission mode measurements of live cells use a synchrotron source. The high brightness of this source enables improved spatial resolution and signal-to-noise ratio compared with globar sources. A detailed review of the combination of microfluidics and synchrotron-based FTIR has been reported by Loutherback et al [212]. Transmission mode FTIR measurements of live cells using a globar source have been performed by Chan and Kazarian, achieving aberration-free spectroscopic imaging by adding a pair of CaF2 lenses to the transmission cell window [213]. Advances in laser-based high brightness sources are expected to open up the possibility of performing many more live cell studies within standard analytical laboratories, rather than national facilities.
7. Concluding remarks
Novel MIR technologies are attracting much attention in both the optics and spectroscopy communities. There are several new techniques under investigation which show promising potential for development into useful tools for rapid spectral imaging of cells and tissues. Currently QCL microscopes with bolometer array detectors appear to have the upper hand for rapid spectral histopathology, provided sparse spectral information, but dense spatial information is sufficient for discrimination of a particular disease condition or tissue type (this is not always the case). This is particularly the case as synchrotrons and supercontinuum light sources are either impractical for general use or do not reach the fingerprint region (longer wavelengths) with sufficient intensity (yet). The use of upconversion imaging shows great promise, as this will remove the need for expensive MIR sensitive cameras and open up the use of cheap silicon CCD or CMOS detector technologies with high pixel density and high sensitivity at visible wavelengths.
Acknowledgments
Funding within the scope of Horizon 2020 by the European Union is highly appreciated. This work was conducted as part of the Mid-TECH Marie Curie innovative training network [H2020-MSCA-ITN-2014-642661].