


ABSTRACT
Low-density astrophysical plasmas may be described by magnetohydrodynamics at large scales, but require kinetic description at ion scales in order to include dissipative processes that terminate the cascade. Here kinetic plasma simulations and high-resolution spacecraft observations are compared to facilitate the interpretation of signatures of various dissipation mechanisms. Kurtosis of increments indicates that kinetic scale coherent structures are present, with some suggestion of incoherent activity near ion scales. Conditioned proton temperature distributions suggest heating associated with coherent structures. The results reinforce the association of intermittent turbulence, coherent structures, and plasma dissipation.
Export citation and abstract BibTeX RIS
1. INTRODUCTION
Fundamental questions concerning the dissipation of turbulence in low collisionality astrophysical plasmas have received considerable attention, particularly regarding the heating of the solar corona, and the origin of the solar wind. Heliospheric magnetic field and plasma data verify that an MHD-Kolmogorov-like cascade of energy is found between scales of about 106 km and 100 km. Analyzing the kinetic scale cascade is more challenging in part due to increased requirements on time and space resolution. Simulations (Parashar et al. 2009; Servidio et al. 2012; Karimabadi et al. 2013; Wan et al. 2012b) and observations (Sorriso-Valvo et al. 1999; Vasquez et al. 2007; Retinò et al. 2007; Alexandrova et al. 2008; Osman et al. 2011, 2012b; Perri et al. 2012) suggest localized or intermittent heating in structures such as current sheets. A consistent picture is still emerging. Here we provide a point of contact by examining intermittency and dissipation at kinetic scales through comparison of high-resolution spacecraft data and plasma simulations.
Theory suggests that electric current density structures are characteristic of MHD intermittency (Matthaeus & Montgomery 1980; Biskamp 1986; Carbone & Veltri 1990), an attractive idea for space plasmas because it connects ideas about flux tube structure, enhanced dissipation, and magnetic reconnection. Indeed, observed solar wind inertial range statistics are consistent with an intermittent cascade (Biskamp 1993; Horbury & Balogh 1997; Sorriso-Valvo et al. 1999). Conversely, interplanetary coherent structures may be viewed as discontinuities (Vasquez et al. 2007; Greco et al. 2008; Perri et al. 2012), or remnant boundaries convecting from the corona (Bruno et al. 2001; Borovsky 2008).
The time interval between passages of solar wind discontinuities (Borovsky 2008) varies from seconds to hours. Implied thicknesses vary from 105 km to less than 102 km (Burlaga 1969; Tsurutani & Smith 1979; Vasquez et al. 2007; Perri et al. 2012), approaching electron scales. Distributions of inertial range discontinuities are similar in the solar wind and in MHD simulations (Greco et al. 2008, 2009; Zhdankin et al. 2012). Conditional statistics of proton temperature reveal that plasma is hotter at, and near, these "events" (Osman et al. 2012a, 2012b). The association of elevated plasma temperature and anisotropy with coherent magnetic structures is clearly suggestive of inhomogeneous dissipation (Servidio et al. 2012), likely extending to electron scales (Karimabadi et al. 2013; Wan et al. 2012b; Perri et al. 2012). Here we directly compare measures of intermittency in observations and simulations, near and across the nominal boundary between MHD and kinetic scales.
2. METHODS
For kinetic plasma simulation at scales ⩽ the ion inertial scale di = c/ωpi, we employ two established electromagnetic particle-in-cell (PIC) codes. The first simulation, using P3D (Zeiler et al. 2002), is 2.5D in a 25.6 × 25.6di box, with 20482 grid points. Initially, there are 300 particles per cell (21168/Debye square) with uniform density of 1. The initial temperature of ions and electrons is T0 = 1.25 (normalized to miv2A), and plasma beta =0.1. (Solar wind values of beta are broadly distributed with most values lying between 0.01 and 2. Low values are usually magnetic clouds; see Smith et al. 2006.) The Debye length, λD = 0.105, is more than 8 × grid scale. The electron mass, ion mass, and speed of light are 0.04, 1, and 15, respectively. The time step is δt = 0.0025. Initialization sets up unit total fluctuation energy, and equipartition of in-plane uncorrelated magnetic and velocity fields using a Fourier method: E(k) ∼ [1 + (k/k0)8/3]−1, for wavenumbers k = [2, 4]2π/25.6 with k0 = 6 × 2π/25.6. A strong out-of-plane guide field Bz = 5 is imposed.
The second PIC simulation (Karimabadi et al. 2013; Wan et al. 2012b) employs the VPIC code, with resolution 8192 × 16384, 150 particles per cell (253 particles/Debye square) and beta =0.1. A strong out-of-plane magnetic field is imposed. No turbulence is initially present. Fluctuations and nonlinear activity are driven by an initial large-scale velocity shear that distorts and destabilizes an initially uniform weak in-plane magnetic field. See Karimabadi et al. (2013) and Wan et al. (2012b) for details. 2D PIC simulations afford better spatial resolution, crucial in the present context, while approximating the highly oblique nature of solar wind fluctuations. Kinetic plasma simulations are supplemented by a 3D 5123 spectral method MHD simulation at moderate Reynolds number.
To analyze solar wind magnetic fluctuations at kinetic scales, we use four data intervals from the Spatio Temporal Analysis Field Fluctuations (STAFF) search coil magnetometer on Cluster (Cornilleau-Wehrlin et al. 1997), obtained in burst mode at 450 Hz (i.e., ∼0.0022 s) on the dates 2004 January 10, 2006 March 19, 2007 January 20, and 2007 January 30. The analysis is performed within calibrated time windows of ∼145.6 s. Burst mode data enables spectral resolution from < the proton cyclotron frequency to >100 Hz. We divide the STAFF data into normal-SW density intervals (∼3 cm−3) and a high-SW density interval (∼15 cm−3). Three of these intervals were investigated in (Sahraoui et al. 2009; Kiyani et al. 2009; Sahraoui et al. 2010) and (Perri et al. 2012). Using similar intervals, (Sahraoui et al. 2009, 2010) concluded that the Taylor frozen-in hypothesis is valid. Consequently, these data sample spatial scales down to the electron inertial length (Figure 1).

Figure 1. Magnetic energy spectrum from P3D simulation with wavenumber scaled to ion inertial scale kdi (first vertical dashed line); also shown—for PIC case only—are electron skin depth kde = 1 and Debye scale kλD = 1. For qualitative comparison, spectra from Cluster FGM and STAFF (only kdi = 1 is relevant), and MHD simulation (di associated to 1/10 Kolmogorov dissipation scale) are also shown.
Download figure:
Standard image High-resolution imageFor kurtosis in the inertial range, we analyzed five years (2001–2005) of ACE MAG 1s resolution and Cluster 1 FGM 22.4 Hz magnetic field measurements. FGM intervals labeled ND and HD are supersets of the STAFF data with the same labels. Interpretation of FGM data is usually restricted to frequencies <1 Hz due to data discretization. The ACE and Cluster ensemble was obtained by dividing the data into 4 hr intervals; long enough to contain several correlation times, but short enough to avoid large-scale inhomogeneities. To accept an interval, its magnetic field component kurtoses must lie within the range 2.8–4.0 (roughly Gaussian). Intervals were removed from the ensemble if they contained heliospheric current sheet crossings or foreshock contamination, or if the bad or missing data fraction exceeded 5%. The remaining intervals were examined visually for transient events. The intervals that best matched our criteria were selected for the large-scale kurtosis ensemble (Wan et al. 2012a).
To study non-uniform heating, we analyzed 17 years (1995–2011) of 3 s resolution magnetic field and proton temperature measurements from respectively the MFI and 3DP instruments onboard the WIND spacecraft. The mean gyrofrequency is 0.5 rad s−1 and the mean Alfvén velocity is 50 km s−1. Thus, the average ion inertial length is 100 km, corresponding approximately to the typical observed breakpoint in the power spectra (Leamon et al. 1998; Alexandrova et al. 2008, 2009; Sahraoui et al. 2009; Kiyani et al. 2009; Chen et al. 2011). The smallest scales in this WIND analysis correspond to ≈12 di.
3. RESULTS
To establish the context, we compute the (trace) magnetic field component spectrum using magnetic field data from PIC simulations, MHD simulation, and Cluster STAFF data. These data sets are analyzed in the spatial domain with corresponding wavenumber k scaled to the ion inertial scale di. We employ the Taylor hypothesis for the solar wind data (frequency → kVsw). For the MHD simulation, the Kolmogorov dissipation scale (where viscosity starts to dominate and the turbulent kinetic energy is dissipated into heat) is treated as 10di. The simulation and solar wind magnetic spectra are shown in Figure 1, illustrating the transitional range between the lower k MHD inertial range and kinetic scales. The steepening near the ion inertial scale (Denskat et al. 1983; Leamon et al. 1998) in both PIC simulations and data gives way to a near-power-law range extending to about the electron inertial scale, where further steepening occurs (Alexandrova et al. 2009; Sahraoui et al. 2009). The spectrum contains no direct information about coherent structures.
If present, structures imply coherent changes in the magnetic field, which can be captured by analysis of vector increments:

where b(t) is the magnetic field time series and s is the time lag. The kurtosis of the ℓ −component of increment Δb at scale s is defined as
where 〈.〉 means averaging over t.
The kurtosis of magnetic field increments, κ(s) (hereafter kurtosis), is evaluated from both kinetic and MHD simulations. It is of central interest here to examine the kurtosis at scales ranging from inertial range, beyond di, and down to scales ∼ electron inertial scale (≈di/43 for realistic mass ratio).
Figure 2 shows κ(s) calculated from Cluster FGM data, Cluster STAFF data, ACE magnetic field data, from MHD simulation, and from the two kinetic PIC simulations described above. All spatial lags are measured in units of di. There are numerous interesting and even striking features of these data, which we now discuss.

Figure 2. Kurtosis of magnetic field increments κ(s) vs. s for three components of magnetic field in mean field coordinates: (a) b∥, (b) b⊥1, and (c) b⊥2, where b∥ is the component in the mean magnetic field direction and b⊥2 is perpendicular to the mean magnetic and velocity field. Spatial lag s normalized to di is set to one-tenth of the dissipation scale for the MHD case. At smaller scales, κ(s) is computed from PIC simulations ("VPIC" and "P3D") and Cluster STAFF normal-density ("STAFF-ND") and Cluster STAFF high-density ("STAFF-HD") intervals. At large scales, κ(s) is computed from MHD simulation, ACE data, and long-time (4 hr) Cluster FGM data ("Cluster"). In addition, shorter FGM intervals probe correspondence with STAFF data in similar intervals.
Download figure:
Standard image High-resolution imageDiffering results of the two PIC simulations may be attributed to differences in their initializations. The VPIC case driven by large-scale velocity shear evolves by stretching and amplifying the magnetic field until local tearing sets in, and the system becomes nonlinear and turbulent. When the magnetic field is initially drawn out into very thin sheets, it implies a larger kurtosis at small scales. The P3D case is driven more by Alfvénic mode–mode couplings, and the velocity and magnetic fields are on more equal footing from the onset.
Figure 2 shows a tendency towards increased kurtosis at smaller scales for each data type. This general feature of intermittency in turbulence is expected based on the Kolmogorov refined similarity (Kolmogorov 1962). This property is unproven but well supported in hydrodynamics (Sreenivasan & Antonia 1997) and forms the basis of multi-fractal theories (Anselmet et al. 1984; Sorriso-Valvo et al. 1999). Generation of increasing κ(s) at smaller s appears to be a generic property of nonlinear quadratic cascades (Wan et al. 2009).
The complexity of Figure 2 suggests that standard hydrodynamic ideas may not apply in a simple way to kinetic scale plasma, where the data may be sampling the dissipative structures themselves. We also recall that we lack a closed form expression for the nonlinear couplings that might generate non-Gaussianity at these scales. Nevertheless, coherent structures in plasmas do persist at least to electron scales (Karimabadi et al. 2013; Wan et al. 2012b; Perri et al. 2012), and Figure 2 demonstrates a continued tendency to support non-Gaussian values of κ at small s. The kinetic scale increase of κ is less dramatic than at MHD scales. Perhaps more curious is that, starting from larger s, κ increases to values above ∼10 near 10di, and then for smaller s transitions back to near-Gaussian values ∼3 prior to its modest increase towards electron scales.
There are various considerations regarding this interesting behavior: for the kinetic simulations, the low κ at the largest resolved scales is clearly attributable to the small system size. For the STAFF data at scales <di, the explanation is not so clear. For example (Cornilleau-Wehrlin et al. 2003), the STAFF data stream has been high pass filtered with a roll-off at ∼0.5 Hz. This has the potential to modify values of κ at scales not too far from the filter cutoff. In other words, the STAFF intervals may also behave as a small system. Although Cluster data sometimes shows low kurtosis due to magnetospheric wave activity (Chian & Miranda 2009), we have carefully avoided such intervals here. One does find examples of STAFF data with κ ∼ 10 near s = di. This raises the question of whether the small time duration of STAFF burst mode implies a high degree of variability: Each calibrated frame of 65536 samples spans 146.6 s. Generally, one does not expect to have a stable sampling of a random signal in a period less than a correlation time, so it might not be so surprising to find small samples with either low or high kurtosis.
For the lower frequency ACE and Cluster FGM data, corresponding to scales >di, a general increase in κ moving towards smaller s is observed. However, both these data sets show "turning over" as one approaches s ∼ 10di from above. This effect appears to be real, for example, it is well separated from frequencies at which digitization errors are known to be quantitatively important for FGM (1 Hz or so Balogh et al. 1997; Perri et al. 2012). Figure 2 also includes kurtosis computed from an MHD simulation (periodic, incompressible 5123 pseudo-spectral method; see Wan et al. 2012a). In contrast to the ACE and FGM analyses, the MHD kurtosis increases monotonically approaching the dissipation scale. This is typical of fluid models with scalar dissipation coefficients.
Having considered various technical issues, and comparing results of simulations and data, we tentatively conclude that the decrease in kurtosis moving from s = 10di or s = di is a real effect. Apparently, kinetic plasmas can admit a decrease in kurtosis of physical origin, moving towards small scales in the decade above s = di. Given that we already have in hand evidence that coherent structures persist into this range (and indeed to electron scales), the explanation for this would appear to require an additional ingredient of incoherent dynamics.
The presence of incoherent wave-like activity would provide a plausible explanation for this, and indeed several numerical studies have found such evidence. For example, weak Bernstein modes have been observed in turbulence simulations, coexisting with strong current sheets (Parashar et al. 2009), although no evidence for such fluctuations has been found in STAFF data (Sahraoui et al. 2009, 2010). Analysis of the same VPIC simulation employed here (Karimabadi et al. 2013) has identified regions of plasma wave generation near strong sharp electric current structures. The presence of waves (whatever the type, e.g., Kinetic Alfvén waves, whistlers, cyclotron waves, etc.) provided that they are generated incoherently, could explain the clear difference in kurtosis seen between s > 10di and s < di. This influence may be subtle, given that the kurtosis is sensitive to non-local scale effects.
Having examined the relationship between intermittency as measured by kurtosis in fluid and kinetic scales, we examine the data for evidence of heating in the associated coherent structures, following the approach introduced by Greco et al. (2008) and Osman et al. (2011). To identify coherent (non-Gaussian) structures in the solar wind, a time series of the normalized partial variance of increments (PVI), denoted ℑ, is constructed:
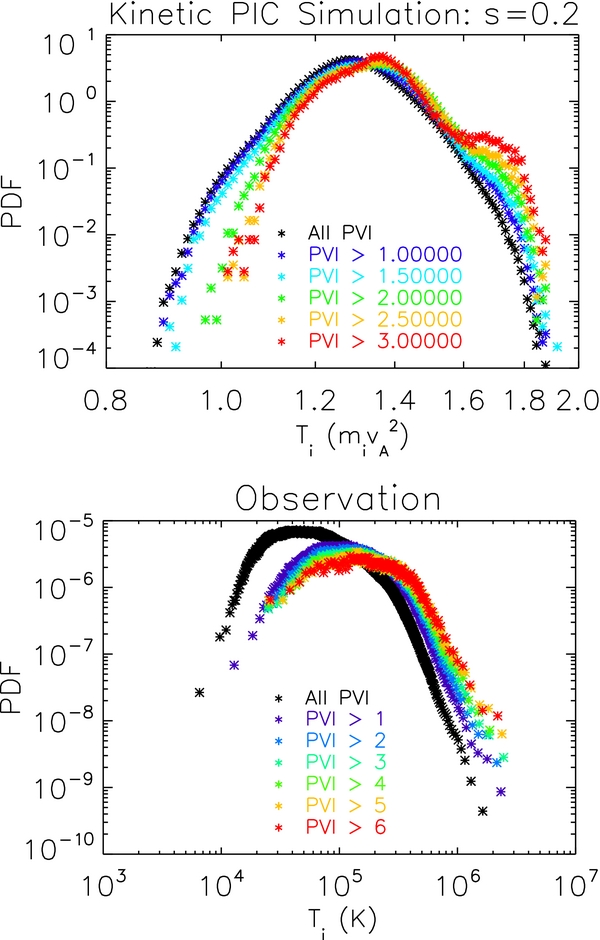
where 〈⋅⋅⋅〉 denotes an ensemble average. Events are selected by imposing thresholds on PVI, leading to a methodology that is comparable to standard methods for identification of magnetic discontinuities in both solar wind observations and numerical simulations (Greco et al. 2009). It is known, for example, that high PVI selects structures contributing to non-Gaussian statistics, that higher PVI thresholds selects stronger current sheets, and that in simulations, high PVI is correlated with active reconnection sites (Greco et al. 2008, 2009; Servidio et al. 2012). Furthermore, for inertial range lags (64 s at 1 AU), the distribution functions of solar wind proton temperature conditioned on PVI value show a systematic trend toward higher temperatures in and near (Osman et al. 2011, 2012b) higher PVI events. Here we apply this methodology to the kinetic range of scales in the PIC simulation P3D to examine whether this association of elevated temperature with coherent structures persists at smaller (inertial range) scales, and in the simulations, beyond the inertial range. The new conditional analysis of solar wind data carried out at smaller inertial range scales than previously examined, but direct examination of kinetic range is not feasible with current plasma instruments.
It is convenient to accumulate temperature statistics based on a threshold in PVI, so the conditional PDFs of interest may be denoted as PDF(Tp|PVI > θ) and the associated averages, 〈Tp|PVI > θ〉, for thresholds θ. For the PIC simulation P3D, we carry out the conditional temperature analysis using a spatial lag of s = 0.2di, which for the mass ratio employed, is also the electron inertial scale. The top panel of Figure 3 shows the results in which the distributions of proton temperatures show a clear tendency to increase in samples characterized by higher PVI threshold. Turning to the analysis of 3 s WIND data, the PVI statistic Equation (3) is computed at the fastest possible cadence, which is 3 s lag. This approaches kinetic scales. The normalization (denominator) in Equation (3) is averaged over the entire 17-year time series. Employing the same strategy of conditional sampling that was done for the simulation data, we then compute 〈Tp|PVI > θ〉 for a range of thresholds. The results are shown in the bottom panel of Figure 3. It is evident that the distribution of proton temperatures moves towards higher values with increasing PVI threshold for the upper inertial range in the solar wind. This confirms the previous report (Osman et al. 2011) of this effect at several minute scale but using three second increments remains in the inertial range. The PIC simulation results extend well into the kinetic range.
Figure 3. Top: from the PIC simulation P3D, distribution of proton temperature conditioned on PVI threshold, PDF(Tp|PVI), for increasing PVI thresholds. Bottom: same but for large samples of solar wind data from WIND spacecraft.
Download figure:
Standard image High-resolution image
4. DISCUSSION AND CONCLUSIONS
Recent interest in understanding small-scale kinetic processes that may dissipate fluctuation energy is motivated by the need to understand how the corona is heated and the solar wind is accelerated. The combined effects of MHD scale cascade and kinetic dissipative processes can strongly influence the macroscopic state of these and other astrophysical plasmas. Evidence that heating may be highly nonuniform suggests that dissipative intermittency may be generated by the cascade itself. This process is necessarily nonlocal in scale, and therefore intuition based mainly upon spectra and "Kolmogorov 1941"-style local cascade pictures cannot provide a complete picture. We have therefore been motivated to compare large-scale (MHD) and small-scale (kinetic) features, as seen in both simulations and in solar wind observations, and to study intermittency effects over scales spanning the transition to kinetic physics. In the study carried out, di corresponds to one-tenth Kolmogorov dissipation scale in MHD and ∼100 km in the solar wind near 1 AU.
For magnetic field intermittency as revealed by scale-dependent kurtosis, we find a general tendency toward more strongly coherent structures at smaller scales. In detail, two interesting features are observed. First, as the cascade nears s ∼ 10di approaching the crucial region near di, the kurtosis actually decreases. Second, moving to scales <di the kurtosis again increases, indicating continuation of kinetic scale intermittency (Karimabadi et al. 2013; Wan et al. 2012b). There is also indication of saturation at a level near κ ∼ 5–10, approaching electron scales (in agreement with the mono-scaling behavior observed in Kiyani et al. 2009).
Apparently as one approaches the ion scales from above, the well-known tendency for MHD (and hydrodynamics) to produce a monotonically increasing kurtosis as dissipative scales are approached does not carry over into kinetic physics. One does, however, see evidence for coherent structures from ion scales down to at least the electron inertial scale, in both simulations and observations. To reduce coherence and kurtosis in the observed range s = 10di to about s = di, a source of incoherency is needed and some form of wave-like plasma activity is likely responsible. The presence of such waves in simulations has already been reported (Parashar et al. 2009; Karimabadi et al. 2013).
For the distributions of proton temperature, the present analysis confirms that the inertial range continues to show enhancements of temperature at stronger coherent structures or discontinuities as revealed by the PVI method. At kinetic scales in the simulations, the same method applied to proton temperatures indicates that current sheets (Karimabadi et al. 2013) are sites of higher temperatures. Thus, even if the sharpness of the coherent structures is reduced in the kinetic range, it is still expected that these are sites of enhanced heating.
We conclude that kinetic scale intermittency shares basic properties with its MHD and hydrodynamic counterparts, but also admits interesting differences associated with plasma effects. The coexistence of dissipative coherent structures and incoherent plasma waves at kinetic scales will likely make the subject of plasma intermittency even more challenging than it is in ordinary fluids. It seems likely that the questions and suggestions discussed here may become highly relevant to both the design and scientific study in the MMS and Solar Probe Plus missions.
This research supported in part by NASA Heliophysics Theory program NNX11AJ44G, NSF Solar Terrestrial and SHINE programs AGS-1063439 and AGS-1156094, NASA MMS Theory and MMS Interdisciplinary Science programs, Solar Probe Plus Projects, DOE program DE-SC0004662, the Thailand Research Fund, POR Calabria FSE 2007/2013, and by EU project "Turboplasmas." Simulations were performed on University of Delaware clusters and on Jaguar at the Oak Ridge National Laboratory.
P.W. dedicates this paper to Dr. Nathan Avery of Flagstaff, AZ, in memory of his legacy and humanity.