


ABSTRACT
N2 is abundant in Pluto's atmosphere and on its surface, but the supply is depleted by prodigious atmospheric escape. We demonstrate that cometary impacts could not have delivered enough N mass to resupply Pluto's N2 atmospheric escape over time; thus Pluto's N2 is likely endogenous, and therefore was either acquired early in its history or created by chemistry inside Pluto. We find that cratering could excavate a considerable amount of N2 to resupply the atmosphere against escape if the near-surface N2 reservoir is deep. However, we find that this process likely falls short of that necessary to resupply the atmosphere against escape by at least an order of magnitude. We conclude that either the escape of N2 from Pluto's atmosphere was on average much lower than the predictions for the current epoch, or that internal activity could be necessary to bring N2 to the surface and resupply escape losses. Observations made by the New Horizons spacecraft in mid-2015 will yield further constraints on the provenance and evolution of Pluto's surface and atmospheric N2, and could reveal evidence for past or present internal activity.

1. INTRODUCTION: PLUTO'S N2 ATMOSPHERIC LOSS DILEMMA
In addition to Pluto's surface ice composition being dominated by molecular nitrogen (Cruikshank et al. 2015), Pluto's atmosphere consists of a >90% mole fraction of N2 (Yelle & Elliot 1997), with surface pressures estimated on the order of ∼10 μbars (Lellouch et al. 2009). Models predict the current N2 escape rate is 1027–1028 molecules s−1, or 1.5 × 10¹²–13 g yr−1 (e.g., Erwin et al. 2013; Zhu et al. 2014; Johnson et al. 2015; Tucker et al. 2015). For comparison, the estimated global atmospheric mass of Pluto, based on pure N2 of 10 μbars at 35 K, is ∼3 × 10¹⁶ g, demonstrating that the entire atmospheric N2 reservoir will be lost in a tiny fraction of the age of the solar system. It is unknown if Pluto's atmosphere collapses over the course of Pluto's orbit (Hansen et al. 2015; Olkin et al. 2015 and references therein). If the atmosphere exists for as little as 20% of Pluto's orbit, the escape rate would be reduced by a factor of 5. However, the higher solar ultraviolet fluxes in the past may have produced higher escape rates by a factor of several (Johnson et al. 2015).
A linear extrapolation of the above escape rates indicates a total of 7 × 10²¹–22 g N2 has been lost over 4 billion years. This is equivalent to a condensed global N2 surface layer on Pluto ∼0.3–3 km in depth (Stern et al. 2015b). Chondritic abundances of nitrogen (N) in all forms (N2, NH3, organics) are 3180 ppm or less (Lodders & Fegley 1998), with CI chondrites containing the highest values. Pearson et al. (2006) give values for three CI chondrites that range between ∼2000 and 5200 ppm; we adopt Lodders & Fegley (1998) as the middle of that range. Applying the same fractional N abundance (∼0.0032) to the total mass of Pluto (1.3 × 1025 g) scaled by the rock mass fraction of Pluto of 0.65–0.7 (McKinnon 2015), one predicts a total Pluto N reservoir of 3 × 10²² g. This N estimate is close to or lower than what is necessary to supply N2 escape, if the escape rates have been similar to those stated above for the past 4 billion years. However, if Pluto's nitrogen abundance in all forms is instead on the one to several percent level (up to fractions of 0.02) as some sources suggest is the case with comets (e.g., Jessberger et al. 1989; Crovisier et al. 2006; Mumma & Charnley 2011), and this N has been primarily converted to N2 through chemical processes and given access to Pluto's surface, this could provide enough total N2 mass to supply the atmosphere against escape.
Where did Pluto's N2 originate from? To address this, we proceed as follows: in Section 2 we evaluate whether N2 delivered by comets to Pluto can resupply the nitrogen; in Section 3 we explore potential excavation of endogenous N2 by these same impactors. In Section 4 we summarize our findings and briefly discuss the potential role of geologic activity for atmospheric resupply.
2. CAN DELIVERY BY COMETS-RESUPPLY THE N2?
2.1. Predicted Impactor Populations
Using observations of current KBO populations (Schlichting et al. 2012), typical KBO impact velocities onto Pluto of ∼1–2 km s−1 (e.g., Zahnle et al. 2003; Bierhaus & Dones 2015), and Pluto's cross section, one of us, Stern et al. (2015a), estimated ∼14,000 comets 1 km in diameter or larger would impact Pluto over 4 billion years (comparable to an earlier estimate by Durda & Stern 2000). The rates derived in Zahnle et al. (2003) yield a similar order of magnitude estimate of ∼11,200 impactors larger than 1 km in diameter over 4 billion years. Both Bierhaus & Dones (2015) and Greenstreet et al. (2015) conducted detailed analysis of KBO sub-populations and their estimates are 1840–5600 impactors >1 km in diameter (nominal to maximum case), and 1400–8440, respectively. These estimates are based on what is known about the present-day impactor population and are taken to be valid for ∼the past 4 billion years (starting after any Late Heavy Bombardment period and Charon's formation). Greenstreet et al. (2015) estimate a factor of a few is necessary to account for collisional and dynamical erosion of the Kuiper Belt over the past 4 billion years (e.g., Stern & Colwell 1997; Weissman & Levison 1997; Farinella et al. 2000). The impact flux model given by Bierhaus & Dones (2015) assumes the decay factor was outweighed by other uncertainties, and thus it is not considered in the model. Taking into account the maximum estimate of their model, it is possible that the uncertainties in the impactor flux could be up to an order of magnitude.
Adopting the Bierhaus & Dones (2015) estimate of impactor flux at Pluto (their Table 8, nominal case), a cumulative rate of a given size impactor and larger per year can be written as

where impactor diameter (d) is in km. The corresponding characteristic timescale between impacts of a certain size and greater, τimpact, is rate(>d). To estimate the number of impactors as a function of size, we differentiate 1-rate(>d) to obtain


Integrating this function between 1 m impactors and a hypothetical largest impact of ∼60 km, we find that over 4 billion years there have been ∼6 × 10⁸ total impactors on Pluto, the majority of which would be in the smallest size range. Equation (2) further allows us to predict 1.2 × 10⁵ impactors between 100 m and 1 km in diameter over 4 billion years, with only ∼1810 between 1 and 10 km, 26 between 10 and 60 km, and 1 impactor that is 60 km or larger. Because we do not know the actual size of the largest impactor, for the following calculations we will assume the largest impactor in the past 4 billion years was 100 km as a reasonable upper limit. Multiplying Equation (2) by the volume of a spherical impactor and an estimate of overall comet density (1000 kg m−3), and integrating from 1 m to 100 km impactors, yields a total mass of 3 × 10²⁰ g delivered to Pluto. An independent calculation of total mass delivered by comets to Pluto by L. Dones (2015, private communication) found 3.7 × 10²⁰ g, in good agreement with the estimate presented here.

2.2. N Delivery by Comets
Stern et al. (2015a) estimate an N2 mass of 5 × 10¹⁰–11 g in a 1 km comet with a 50:50 ratio of volatiles to refractories, an overall density of ∼1000 kg m−3, and typical cometary N2 volatile fractions of 0.002 to 0.0002 (Crovisier 1994; Rubin et al. 2015). However, given that N2 is quite volatile, this specific molecule may be depleted in comets. In this paper we will consider the total nitrogen mass (i.e., N in all forms) per impactor by simply multiplying the volume of a spherical impactor , by the overall density (1000 kg m−3), and the highest N fraction estimates (0.02), for an upper limit (Figure 1(a)). We then estimate the mass of impactor-delivered N to Pluto per year (Figure 1(b)), by multiplying Equation (2) by the N mass per impactor:

where M and d are in g and km, respectively. Integrating Equation (3) from 1 m up to an assumed largest impactor of 100 km (and multiplying by 4 billion years), would result in 6 × 10¹⁸ g N delivered to Pluto over the past 4 billion years.
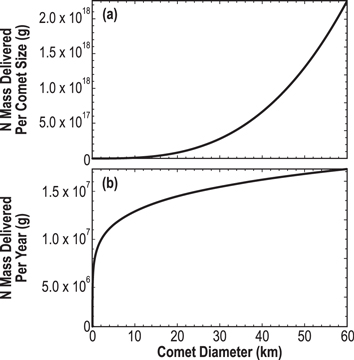
Figure 1. N delivered by comets to Pluto. (a) The total delivered N per impactor size assuming an N fraction of (0.02), which gives an upper limit to what may be converted to N2 on Pluto. (b) Results from Equation (3) showing N delivered per year as a function of comet size. Integrating over comet size yields the total mass delivered per year.
Download figure:
Standard image High-resolution imageFrom these considerations we conclude that the N mass delivered by comets is three-to-four orders of magnitude less than the 7 × 10²¹–22 g N2 lost by atmospheric escape over this same time period (the last ∼4 billion years). We conclude that even given uncertainties in the impactor flux (up to an order of magnitude), it does not appear that comets can deliver enough N to supply Pluto's N2 atmosphere. The material influx onto Pluto during the first ∼0.5 billion years of its history would contribute additional N, but this influx would need to be 3–4 orders of magnitude higher than that of the last 4 billion years, and remain near Pluto's surface, to supply the atmosphere at current escape rates. Hence, except in the extremely improbable scenario that a recent, relatively large impact is supplying the current atmosphere, these calculations imply that either escape rate models overestimate total N2 losses over time or endogenic sources must be responsible for replenishing Pluto's N2.
3. CAN EXCAVATION BY CRATERING RESUPPLY THE N2?
Cratering on Pluto may contribute to the resupply of atmospheric N2 in two main ways: (1) cratering can excavate N2 formerly thermally sequestered below inert lag deposits onto the surface as ejecta deposits, and (2) craters may directly (or indirectly) expose N2 ice surfaces.
3.1. Lag Deposits on Pluto
The surface and subsurface layers of Pluto likely contain a mixture of materials that are less volatile than N2 (e.g., H2O, CH4, and other hydrocarbons). As N2 sublimates from Pluto's surface, a lag deposit of these more refractory components is likely to build up and will tend to choke off Pluto's N2 layer. The thickness Tlag of a lag deposit can then be calculated by , where Hsub is the height of the sublimated layer, finvol is the involatile fraction of the surface (involatile/N2), which we assume for simplicity to be identical everywhere, and is the density ratio of the volatile to involatile materials. The distribution of materials of the surface and near-surface layers is not well known, thus we present a range of scenarios for finvol in Figure 2. It is unknown at this time if this N2 ice detected on Pluto's surface is a thin veneer, or a deeper layer, or how thick of lag deposits may have built up over time. We take of ∼one for N2 mixed with involatile ices, and for N2 with a component.


Figure 2. Lag deposit thicknesses as a function of the depth of the sublimated N2 layer (Hsub) and for varying involatile/N2 fractions for the surface and near-surface layers.
Download figure:
Standard image High-resolution imageWe thus calculate that if ∼0.3–3 km of N2 have been lost to escape (the thickness of a globally averaged surface layer), this loss could leave a total lag deposit built up over 4 billion years of ∼0.15–1.5 km (Figure 2) for an involatile fraction of 0.5. Although this estimate is crude, it serves for subsequent analysis we will use to explore how lag deposits would affect N2 resupply against escape. We expect such a lag deposit to lie beneath a thin veneer of N2 deposited by the most recent seasonal atmospheric deposition cycle (Stern et al. 1988). Pluto's complex seasonal cycles (Young 2013), potential polar caps (Olkin et al. 2015), and varied surface albedo patterns (Buie et al. 2010) suggest the surface ices are heterogeneously distributed. If the N2 must be supplied by a smaller percentage of Pluto's surface area then sublimation would need to proceed to larger depths to supply the same N2 mass, hastening the development of lag deposits.
3.2. N2 Excavation by Cratering
The N2 mass excavated by impacts reaching below Pluto's lag deposit would be available to resupply the atmosphere. For simple craters on Pluto (less than 4 km in diameter; Moore et al. 2015) the final crater diameter, Df, is taken as 1.2*Dtr based on lunar data (Pike 1977). For the final diameter of complex craters we use McKinnon & Schenk (1995; their Equation (1)). Using this, a 5 km impactor makes an ∼32 km final crater (scaling explained below), and excavates to a depth of ∼2 km. This crater excavates ∼3 × 10¹⁷ g of material, which is similar to Pluto's current atmospheric mass (see Table 1 for additional examples).
Table 1. N2 Excavated by Cratering
| Impactor | Transient | ∼Final | ∼Excavation | Excavated | τimpacte | Number |
|---|---|---|---|---|---|---|
| Diameter | Crater | Crater | Depthc | N2 Massd | (year) | This Size |
| (km) | Diametera | Diameterb | (km) | (g) | and Larger | |
| (km) | (km) | in 4 Gae | ||||
| 0.01 | 0.15 | 0.18 | 0.015 | 1.4 × 10¹¹ | 4.6 × 10² | 8.6 × 10⁶ |
| 0.05 | 0.54 | 0.65 | 0.05 | 6.0 × 10¹² | 8.9 × 10³ | 4.5 × 10⁵ |
| 0.1 | 0.92 | 1.1 | 0.09 | 3.1 × 10¹³ | 3.2 × 10⁴ | 1.3 × 10⁵ |
| 0.5 | 3.3 | 3.9 | 0.33 | 1.4 × 10¹⁵ | 6.1 × 10⁵ | 6.6 × 10³ |
| 1 | 5.6 | 6.8 | 0.56 | 6.9 × 10¹⁵ | 2.2 × 10⁶ | 1.8 × 10³ |
| 5 | 20 | 32 | 2 | 3.1 × 10¹⁷ | 4.2 × 10⁷ | 95 |
| 10 | 34 | 59 | 3.4 | 1.6 × 10¹⁸ | 1.5 × 10⁸ | 26 |
| 20 | 59 | 108 | 5.9 | 8.0 × 10¹⁸ | 5.3 × 10⁸ | 8 |
| 40 | 102 | 197 | 10 | 4.1 × 10¹⁹ | 1.9 × 10⁹ | 2 |
| 60 | 140 | 280 | 14 | 1.1 × 10²⁰ | 4.0 × 10⁹ | 1 |
Notes.
aScaling from Equation (4). bConversion from transient to final diameter described in Section 3.2. cExcavation depth taken as ∼1/10th the transient crater diameter (Melosh 1989). dSee Equation (5). eMean time between impacts and number in 4 billion years (for the given size and larger) from Bierhaus & Dones (2015), nominal rates from their Table 8.Download table as: ASCIITypeset image
To calculate the total N2 excavated by cratering on Pluto, we use Equation (2), which gives the cratering rates per year, multiply it by an estimate of the N2 excavated by a given size impact (derivation below), sum over all impactor sizes, and multiply by 4 billion years. This involves scaling from the impactor size to the crater size (e.g., Holsapple 1993). Little data exist on the mechanical behavior of N2 ice, so we follow the example of previous authors in using H2O ice as an order of magnitude estimate (e.g., Bierhaus & Dones 2015; Stern et al. 2015b). N2 ice is a weaker material, thus in theory craters would scale differently in the strength regime. This would only affect craters on Pluto smaller than a few hundred meters, which are created by impactors smaller than a few tens of meters. For larger impacts in the gravity regime, the density contrast between the impactor and target plays a role, but the density of N2 is similar to that of H20 ice at Pluto temperatures (Scott 1976). The scaling formula derived for primary craters for cometary impactors into water ice in the gravity regime with a 45° impactor (details in Singer et al. 2015) is


where Dtr is the transient crater diameter, g is surface gravity (0.66 m s−2 on Pluto), U is the impact velocity (we use 2 km s−1 as a typical speed), and all variables are in MKS units. Here we use a paraboloid of revolution as the crater shape, where the volume is . Rtr and Htr are the transient crater radius and depth, respectively, and both can be written in terms of Dtr and thus the impactor diameter (d) through Equation (4).

Using the scaling in Equation (4), half the transient crater volume as the approximate amount of excavated material, N2 ice density of 1000 kg m−3 (Scott 1976), and for an upper limit assuming an 100% N2 ice layer, we arrive at the mass in grams excavated per impact size (Figure 3(a)) of

where again d is in km. Multiplying Equation (5) by Equation (2), we derive an equation for the N2 mass (g) excavated per year (Figure 3(b)) as

The negative exponent on impactor diameter in Equation (6) reflects the fact that both the cratering efficiency and the number of impacts decreases as impactor size increases. Integrating from 0 to 100 km for impactor diameters results in a total of 5 × 10²⁰ g N2 excavated over 4 billion years. The low primary impact speeds on Pluto mean only a small fraction of the ejecta, less than 1% of the impactor mass, will have velocities higher than Pluto's escape speed, and not much material is vaporized (Bierhaus & Dones 2013).

Figure 3. N2 excavated by cratering. (a) Mass of N2 excavated (g) per impact size assuming a near surface layer of solid N2 at least as thick as the excavation depth of the impact (up to 14 km deep for the largest impactors) as given by Equation (5). (b) The result of evaluating Equation (6) showing N2 excavated per year as a function of impactor size. Integrating over impactor size yields the total mass delivered per year. See Table 1 for conversion of impactor size to crater size and approximate excavation depth.

Download figure:
Standard image High-resolution imageEven with uncertainties in the impactor flux, and the extremely conservative assumption that all excavated material is pure N2, excavation from cratering does not seem to be a likely source for supplying all of Pluto's atmospheric mass loss over time. In fact, it apparently falls short by an order of magnitude or more.1
3.3. Sublimation of N2 Through Crater Floors and Walls
Cratering can also contribute new N2 to atmospheric resupply by exposing buried N2 next to crater walls/floors and as the thermal wave from solar insolation drives subsurface N2 sublimation. We use 2 times the annual thermal skin depth as a rough upper limit length scale over which this sublimation is likely to occur. The thermal skin depth, or LT, is given by , where κ is thermal conductivity, τ is the thermal variation timescale (conservatively we adopt the annual solar insolation on Pluto of 248 years), ρ is material density, and cp is heat capacity. For a pure slab of N2 ice, we estimate that LT, or one e-folding depth of the annual wave would be ∼20 m.

The N2 mass sublimated from the ice near a crater cavity is estimated by taking the volume of a paraboloidal shell with an inner radius of Df/2 and an outer radius of Df/2 + 2LT, where 2LT is 0.04 km in this case (note the use of final, rather than transient, diameter here). Multiplying the volume of the paraboloidal shell by Equation (2) gives

(d in km) and integrating over all 1 m to 100 km diameter impactors results in 8 × 10²¹ g N2 lost through crater wall and floor sublimation over 4 billion years, assuming pure N2 under the cavity of each crater. In this simple upper limit calculation, the sublimation contribution is ∼one order of magnitude higher than that excavated by cratering due to the fact that the amount excavated by small craters (of which there are many) is less than the amount sublimated. This simple estimate does not attempt to take into account the actual composition of subsurface materials, any lag deposits (discussed below), the actual final shape of large versus small craters, or any effects of the varying insolation that would be received by a crater cavity at different latitudes on Pluto (there are no crater shadows in this model). These additional effects would work to reduce the amount of N2 sublimated. It is possible that impact heating or other effects could enhance sublimation temporarily at the impact site, but we consider this is to be a second order effect because of the low impact velocities found at Pluto.
If a lag deposit is present, smaller craters would not expose fresh N2 surfaces. To calculate the effect of a lag deposit, we assume that the excavation depth plus 40 m (2LT for pure N2) must be greater than the lag deposit thickness. For the lower limit lag deposit of 0.15 km, craters smaller than ∼1.3 km in final diameter will not punch through. Integrating over impactors from 125 m to 100 km, the material sublimated is considerably reduced, down to 4 × 10¹⁹ g N2 sublimated over 4 billion years (for a pure N2 surface). For a 1.5 km lag deposit, again integrating from 3.5 to 100 km in impactor diameter, the mass sublimated is reduced to 5 × 10¹⁷ g N2 over 4 billion years.
All of these various estimates of exposed N2 based on the presence of a lag deposit fall short by two-to-five orders of magnitude of the amount necessary to resupply atmospheric escape.
4. SUMMARY AND EVIDENCE FOR THE POSSIBILITY OF INTERNAL ACTIVITY ON PLUTO AND N2
Based on the first-order analysis conducted here, it is does not seem that either cometary import or cratering-related effects can resupply Pluto's atmospheric N2 escape losses. Given the also demonstrated difficulty of delivering enough N2 with comets, we suggest that either atmospheric escape rates have been overestimated or cryovolcanism or another tectonic or geodynamic means of N2 resupply may be necessary to resupply Pluto's atmosphere against escape and the buildup of an involatile lag deposit resulting from the escape process. The volumetric resupply rate for Pluto's atmosphere is 0.0015–0.015 km3 yr−1. This value is ∼30–13,000 times lower than Earth's resurfacing rates of ∼0.4–20 km3 yr−1, where the range is for intraplate volcanism versus total intrusive plus extrusive volcanism (Strom et al. 1994; Crumpler et al. 1997; Smrekar et al. 2014). The higher Pluto rate is similar to estimated resurfacing rates for Triton of 0.01 km3 yr−1 (Stern & McKinnon 2000), implying this rate of activity on Pluto is possible. Evidence of subsurface activity on Pluto could reveal itself in images returned by New Horizons.

We thank an anonymous reviewer for helpful comments that improved and clarified this manuscript. We also thank Luke Dones, Randy Gladstone, Leslie Young, and Eliot Young for helpful discussion on this manuscript. This work was supported by NASA's New Horizons mission contract NASW-02008 to the Southwest Research Institute.
Footnotes
- 1
This result is further strengthened by noting that only craters that are deep enough to punch through the lag can excavate N2. Using 0.15–1.5 km as a range of possible lag deposit thicknesses means craters smaller than ∼1.5–15 km (corresponding to impactors of ∼0.2–3.5 km) will not punch through. If we take a second integration of Equation (6), this time from 3.5 to 100 km impactors, the mass excavated only changes by a small fraction to 4.0 × 10²⁰ g N2 over 4 billion years, as the larger craters play a more significant role in this calculation and the effect of a lag deposit is second order.