


Abstract
Using the Mars Atmosphere and Volatile Evolution Neutral Gas and Ion Mass Spectrometer data, we investigate the possible impact of crustal magnetic fields on the thermal structure of the Martian upper atmosphere. Our analysis reveals a clear enhancement in temperature over regions with strong crustal magnetic fields during two deep dip campaigns covering the periods of April 17–22 and September 2–8, both in 2015. Several controlling factors, such as solar EUV irradiance, relative atomic O abundance, and non-migrating tides, do not help to explain the observed temperature enhancement, and a magnetically driven scenario is favored. We evaluate the roles of several heating mechanisms that are likely modulated by the presence of crustal magnetic fields, including Joule heating, ion chemical heating, as well as electron impact heating via either precipitating solar wind electrons or locally produced photoelectrons. The respective heating rates of these mechanisms are substantially lower than the solar EUV heating rate, implying that none of them is able to interpret the observations.
Export citation and abstract BibTeX RIS
1. Introduction
The thermal structure of the dayside Martian upper atmosphere is controlled by solar EUV heating, radiative cooling via CO2 emission at 15 μm, and thermal conduction (e.g., Bougher & Roble 1991; Bougher et al. 1999, 2000). The role of solar forcing has been confirmed by a number of authors using the data from the drag experiments made on board Mars Global Surveyor (Forbes et al. 2008; Krasnopolsky 2010), and the data acquired by the Neutral Gas and Ion Mass Spectrometer (NGIMS), the Accelerometer, as well as the Imaging Ultraviolet Spectrograph on board the Mars Atmosphere and Volatile Evolution (MAVEN) spacecraft (Jain et al. 2015; Mahaffy et al. 2015a; Bougher et al. 2017; Zurek et al. 2017).
In addition to solar EUV radiation, solar wind (SW) electron precipitation likely provides an additional heat source for regions with open magnetic field lines. This implies that the temperature in the Martian upper atmosphere is potentially modulated by the strong crustal magnetic fields over the southern hemisphere of the planet (Acuna et al. 1999). Crustal magnetic fields may also affect the local thermal balance either via Joule heating (Vasyliunas & Song 2005) or via trapping of photoelectrons (Harada et al. 2016). The latter occurs through the magnetic field control of the route along which the photoelectron energy is degraded via collisions with ambient neutrals. In addition, crustal magnetic fields likely affect local plasma distribution (Andrews et al. 2014) and accordingly local heating via exothermic ion chemistry (e.g., Fox 1988). Search for the impact of crustal magnetic fields on the thermal structure of the dayside Martian upper atmosphere was attempted based on the dayglow emission data acquired by the Mars Express (MEx) Spectroscopy for the Investigation of the Characteristics of the Atmosphere of Mars (SPICAM), but no firm conclusion was reached (Leblanc et al. 2006; Stiepen et al. 2015).
At the nightside, the thermal structure of the Martian upper atmosphere is less constrained by observations (Schofield et al. 1997). Analysis of the Mars Pathfinder Atmospheric Structure Investigation data yielded a peak nightside temperature of 153 K at 134 km (Magalhães et al. 1999). Measurements made with several instruments on board MAVEN, such as NGIMS, should be able to provide statistical results on the nightside thermal structure, but these results are not yet available when this article is being prepared. SW electron precipitation likely plays an essential role as the dominant heating mechanism, replacing solar EUV heating at the dayside, as motivated by numerous studies of the nightside ionosphere of Mars, both observationally (e.g., Withers et al. 2012) and theoretically (e.g., Lillis et al. 2009). Energy deposition by precipitating electrons may also be accomplished via the transport of dayside photoelectrons to the nightside under favorable magnetic field configurations (Xu et al. 2016). In both cases, an impact of crustal magnetic fields on nightside temperature is expected.
With the aid of the extensive measurements made by the MAVEN NGIMS instrument, we examine in this study whether the observed temperature variability in the Martian upper atmosphere could be magnetically driven. We describe in Section 2 the procedure used for extracting temperature profiles from the CO2 density data. The temperature variability revealed by these data is then presented in Section 3. Specifically, our analysis reveals that neutral temperature over regions with strong crustal magnetic fields tends to be enhanced over regions without. In Section 4, several mechanisms are proposed to interpret the observations. Finally, we provide concluding remarks in Section 5.
2. Extraction of Temperature Profiles
The present study relies exclusively on the NGIMS level 2 data in the closed source neutral mode publicly available at the MAVEN Science Data Center.7 The NGIMS is designed to measure the ambient densities of both neutrals and ions in the Martian upper atmosphere over the mass range of 2–150 Da with a resolution of 1 Da (Mahaffy et al. 2015b). An example is presented in Figure 1 (left) for the CO2 density as a function of altitude from the inbound portion of orbit No. 1821.
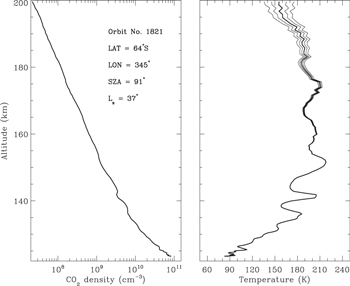
Figure 1. Left: the CO2 density as a function of altitude in the Martian upper atmosphere based on MAVEN NGIMS measurements made during the inbound portion of orbit No. 1821. Right: several temperature profiles derived from the CO2 density data from the same orbit assuming various upper boundary conditions. The thick solid line in the middle corresponds to the case with the optimal upper boundary temperature of 156 K, derived from a Chamberlain model fit to the CO2 density data above 200 km. The thin solid lines cover a range of upper boundary temperatures shifted from the optimal value by −20, −10, +10, and +20 K, respectively.
Download figure:
Standard image High-resolution imageThe temperature profile shown by the thick solid line in Figure 1 (right) is extracted from the CO2 density data by downward integrating the hydrostatic balance equation, given by

from the exobase, placed at a fixed altitude of 200 km throughout this study (e.g., Chaffin et al. 2015). In Equation (1), r is the planetocentric radius, n the CO2 number density, m the CO2 molecular mass, T the neutral temperature, kB the Boltzmann constant, and g the local gravity. Here, we have implicitly assumed that the measured density variation along any MAVEN trajectory is vertical. Meanwhile, we have excluded the outbound CO2 data to minimize contamination by possible reactions on the NGIMS antechamber walls, a well-known feature that also occurs on other mass spectrometers with a similar design (e.g., Cui et al. 2009). The effects of horizontal variation and wall chemistry have been carefully evaluated based on a comparison between the NGIMS CO2 and Ar data (to be reported in an independent paper) and the crucial results addressed in Section 3 below are found to be unaffected by these effects.
In Figure 1, the optimal upper boundary temperature of 156 K is obtained by fitting the CO2 density above 200 km with the traditional Chamberlain model (Chamberlain 1963). We do not choose to determine the upper boundary temperature by assuming zero topside temperature gradient because it could be either positive or negative due to the omnipresence of gravity waves (England et al. 2017; Terada et al. 2017). For a small portion of the orbits considered here that are exclusively at the nightside (see below), publicly available NGIMS CO2 measurements do not extend to altitudes above 200 km, and accordingly we assume a common upper boundary temperature of 140 K for this specific campaign as motivated by existing measurements reported in Schofield et al. (1997) and Magalhães et al. (1999). For comparison, the thin solid lines in Figure 1 (right) are obtained by adopting a range of upper boundary temperature shifted from the optimal value by −20, −10, +10, and +20 K, respectively. All temperature profiles converge at sufficiently low altitudes, typically below 170 km.
The CO2 density data from the inbound portion of each MAVEN orbit provide a unique temperature profile from the exobase down to the periapsis. For the purpose of the present study, only the NGIMS measurements made during deep dip (DD) campaigns with periapsis altitudes below 135 km are included for further analysis. This choice allows an examination of the Martian upper atmosphere as close to the ionospheric peak as possible where the impact of crustal magnetic fields is likely prominent. The sample used here includes the NGIMS data from 65 orbits covering the periods of February 12–17 (hereafter DD1, including 15 orbits), April 17–22 (hereafter DD2, including 14 orbits), July 8–14 (hereafter DD3, including 20 orbits), and September 2–8 (hereafter DD4, including 16 orbits), all in the year of 2015. Detailed information on various geophysical parameters for each campaign is provided in Table 1, including latitude (LAT), solar zenith angle (SZA), local solar time (LST), solar longitude (Ls), and 10.7 cm solar radio index (F10.7) at 1 au and in solar flux units (SFU; 10−22 W m−2 Hz−1). These parameters cluster tightly around the tabulated mean values. The entire sample spans roughly one third of a Martian year from northern winter to northern spring.
Table 1. Information on Geophysical Parameters for the Four Deep Dip Campaigns (DD1, DD2, DD3, and DD4), Including Latitude (LAT), Solar Zenith Angle (SZA), Local Solar Time (LST), Solar Longitude (Ls), and 10.7 cm Solar Radio Index (F10.7) at 1 au and in SFU (10−22 W m−2 Hz−1)
| Campaign | Dates | LAT | SZA | LST | Ls | F10.7 |
|---|---|---|---|---|---|---|
| DD1 | 2015 Feb 12–17 | 40°N−44°N | 108° | 18.3 | 291° | 119 |
| DD2 | 2015 Apr 17–22 | 2°S-6°S | 10° | 11.9 | 329° | 152 |
| DD3 | 2015 Jul 8–14 | 60°S−65°S | 110° | 3.6 | 11° | 123 |
| DD4 | 2015 Sep 2–8 | 62°S−66°S | 91° | 16.0 | 37° | 87 |
Download table as: ASCIITypeset image
3. Temperature Variability
In Figure 2 (left), we compare the mean temperature profiles for all four DD campaigns. The DD3 temperature profile is shown up to an altitude of 170 km to avoid uncertainties related to the choice of the upper boundary condition (see Section 2). The exobase temperature, Texo, is estimated to be 230 K for both DD1 and DD2, 110 K for DD3, and 190 K for DD4, respectively. The subsolar temperature of Texo ≈ 230 K from DD2 is consistent with our current understanding of the solar cycle and seasonal variations of the Martian upper atmosphere. For comparison, the empirical relation of  given by Forbes et al. (2008) predicts Texo ≈ 220 K when the mean values of F10.7 and Ls appropriate for DD2 are used (see Table 1). However, a large temperature variability is clearly seen in Figure 2 (left) both near the terminator (DD4) and at the nightside (DD2, DD3). For example, Texo for DD1 is higher than Texo for DD3 by as much as 120 K, despite that the two campaigns having a similar SZA coverage and being subject to a similar level of solar EUV irradiance.

Figure 2. Left: the mean temperature profiles for the four DD campaigns. Right: a comparison of the mean temperature profile between regions with strong crustal magnetic field (CF; given by a solid line) and regions without (NCF; given by a dashed line), for each campaign sampling the southern hemisphere of Mars. The shadowed regions indicate the ranges of the mean temperature profile estimated from a simple bootstrapping analysis (see the text for details). In the panel for DD3, the left end of the dark CF region is also indicated for clarification. The figure reveals a statistically significant temperature enhancement over regions with strong crustal magnetic fields for DD2 and DD4.
Download figure:
Standard image High-resolution imageFor the purpose of the present study, we note from Table 1 that a portion of the available orbits from DD2, DD3, and DD4 cover regions over the southern hemisphere of Mars with strong crustal magnetic fields, allowing their impact on neutral temperature to be scrutinized. Here, we organize all orbits from each campaign into two samples, one characterizing regions with B400 > 20 nT, hereafter denoted as CF, and the other one with B400 < 20 nT, hereafter denoted as NCF, where B400 is the mean magnetic field strength at 400 km taken from Lillis et al. (2010). Specifically, CF includes orbit Nos. 1059, 1065, 1071, 1077, and 1081 for DD2; orbit Nos. 1501, 1507, 1511, 1517, 1523, 1529, and 1533 for DD3; and orbit Nos. 1807, 1813, 1823, and 1829 for DD4, respectively. In Figure 2 (right), a comparison of the mean temperature profile between CF and NCF is presented for each campaign, showing that the CF temperature tends to be enhanced over the NCF temperature within a limited altitude range.
To ensure that the above feature does not rely on the observation from any single orbit, we perform a simple bootstrapping analysis by which the data from any orbit within either the CF or NCF sample is discarded successively and the same procedure outlined above is repeated on the reduced sample. The range of the average temperature profiles for each case is indicated by the shadowed region in Figure 2 (right), dark for CF and light for NCF. The figure reveals that except for DD3, the temperature enhancement is a statistically significant result, reaching 40 K at about 155 km for DD2 and reaching 20 K at about 170 km for DD4.
Previous attempts to search for the impact of crustal magnetic fields on neutral temperature were made by Leblanc et al. (2006) and Stiepen et al. (2015), both using the dayglow emission data acquired by the MEx SPICAM instrument. Leblanc et al. (2006) reported a very large temperature enhancement of 100 K over strong crustal magnetic fields, essentially based on a single observation made over the southern hemisphere. Such a conclusion was not confirmed by the more recent study of Stiepen et al. (2015) using a much larger data set covering 10 years of SPICAM observations of dayglow emission in the Martian upper atmosphere. We caution that these early results are based on the scale heights derived from observed emission features of CO2+ or CO, and therefore reflect change in mean isothermal temperature rather than the change in temperature profile. Since the modulation of neutral temperature by crustal magnetic fields likely occurs over a limited altitude range as implied by Figure 2 (right), we suspect the assumption of an isothermal temperature in previous studies to be the reason for the non-detection of the magnetic field effect.
The thermal structure in the Martian upper atmosphere is controlled by a number of factors, and a careful examination of these factors is required to validate the conclusion that the difference in temperature is indeed related to the difference in magnetic field. Table 1 shows that SZA, Ls, and F10.7 are constrained within limited ranges for each campaign, implying that the observed temperature difference is unlikely caused by solar cycle, diurnal, and seasonal variations (e.g., Forbes et al. 2008; Jain et al. 2015; Bougher et al. 2017; Zurek et al. 2017). Meanwhile, the difference in relative O abundance is negligible in most cases based on the NGIMS measurements, which implies comparable CO2 cooling between CF and NCF. The largest difference is seen for DD2 with the mean O mixing ratio for CF depleted by as much as 20% above 180 km relative to NCF, but cooling at such high altitudes is dominated by thermal conduction and horizontal advection, rather than CO2 emission (e.g., Bougher et al. 2009). Finally, non-migrating tides, which originate in the lower atmosphere and owe their existence to the topography of Mars (e.g., Forbes & Hagan 2000), provide a source of longitudinal variability in the Martian upper atmosphere (Lo et al. 2015; Medvedev et al. 2016). Such a possibility is also easily ruled out since the temperature variations produced by topography and crustal magnetization have different longitudinal patterns.
4. Discussions
Using the MAVEN NGIMS data from DD2 and DD4, we show in Section 3 that the neutral temperature in the Martian upper atmosphere tends to be enhanced over regions with strong crustal magnetic fields as compared to regions without. Such a feature, if indeed controlled by magnetic field, could be interpreted by several mechanisms including Joule heating, electron impact heating, and ion chemical heating, which we discuss in turn below.
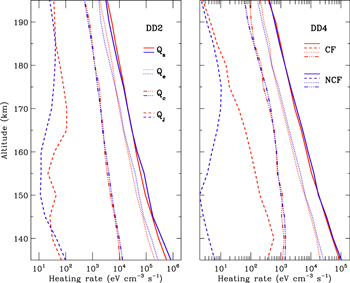
A baseline model for the mean solar EUV energy deposition rate is constructed for each campaign. The NGIMS measurements of both CO2 and O are adopted in the calculation. The relevant photoabsorption cross-section data are taken from our previous compilation in Cui et al. (2011). For the solar EUV irradiance, we use the appropriate level 3 solar spectral model at Mars, constructed from the Flare Irradiance Spectral Model—Mars and calibrated with the MAVEN Extreme Ultraviolet Monitor band irradiance data (Eparvier et al. 2015). The solar energy deposition rate is then multiplied by a constant heating efficiency of 0.2 appropriate for the Martian upper atmosphere (e.g., Fox et al. 2008), to obtain the solar EUV heating rate, hereafter denoted as Qs. The variations of Qs as a function of altitude are shown with the solid lines in Figure 3 for DD2 (left) and DD4 (right). The figure reveals that CF (red) and NCF (blue) are characterized by a similar Qs for each campaign.
Figure 3. Comparison of various heating rates in the Martian upper atmosphere for DD2 (left) and DD4 (right), including the solar EUV heating rate (solid), the electron impact heating rate (dotted), the ion chemical heating rate (dashed–dotted), and the Joule heating rate (dashed). Results for regions with strong crustal magnetic fields (CF; red) and regions without (NCF; blue) are shown separately.
Download figure:
Standard image High-resolution image
4.1. Joule Heating
A crude estimate of the Joule heating rate, QJ, is made based on the common expression

where σp is the Pedersen conductivity and E is the electric field in the reference frame of the neutrals. σp could be obtained from known information of the ion–neutral and electron–neutral collision frequencies based on the NGIMS CO2 measurements and the electron temperature measurements made by the MAVEN Langmuir Probe and Waves instrument (Ergun et al. 2015), the ion and electron conductivities based on the NGIMS  measurements in the open-source ion mode (Benna et al. 2015), and finally the ion and electron gyrofrequencies based on the magnetic field measurements made by the MAVEN Magnetometer (Connerney et al. 2015). Detailed calculations yield Sp below 0.02 S m−1 for DD2 and below 0.01 S m−1 for DD4, both over regions with strong crustal magnetic fields. These are to be compared with a much larger range of Sp found in regions without strong crustal magnetic fields, which is (0.02–0.06) S m−1 for DD2 and (0.01–0.07) S m−1 for DD4. The ranges of Sp quoted above are in harmony with existing results (Opgenoorth et al. 2010).
The electric field in Equation (2) is more difficult to estimate due to the poor knowledge of ion flow velocity in the Martian upper atmosphere. Assuming 200 m s−1, which characterizes ionospheric electrodynamics driven by neutral winds (Fillingim et al. 2010), we find a maximum electric field of E ∼ 10–30 μV m−1 for DD2 and E ∼ 30–200 μV m−1 for DD4 over regions with strong crustal magnetic fields, to be compared with E ∼ 10–20 μV m−1 for DD2 and E ≲ 5 μV m−1 for DD4 over regions without. The corresponding mean Joule heating rates are shown with the dashed lines in Figure 3, red for CF and blue for NCF, which are substantially lower than the respective solar EUV heating rates in all cases. We conclude that, despite a clear magnetically controlled enhancement in Joule heating is implied by the MAVEN data, this heating mechanism falls short by 2–3 orders of magnitude to account for the observed temperature difference. However, we caution that the near-terminator ion flow velocity could be as high as 2 km s−1 (Cui et al. 2015). If this is the case, the enhanced Joule heating rate over regions with strong crustal magnetic fields likely reaches several 104 eV cm−3 s−1, which is a non-negligible fraction of the near-terminator solar EUV heating rate.
4.2. Electron Impact Heating
Energetic electrons within the Martian upper atmosphere, including both precipitating SW electrons and photoelectrons, are able to deposit energy and cause heating via inelastic collisions. To evaluate the role of energy deposition from these electrons, we retrieve the calibrated differential energy fluxes from the MAVEN Solar Wind Electron Analyzer level 2 survey data (Mitchell et al. 2016) and calculate the mean electron energy spectrum as a function of altitude for both DD2 and DD4. The electron impact heating rate, Qe, is then calculated via

where E is the incident electron energy, Φe is the angularly averaged differential electron flux, N is the CO2 density,  is the electron impact heating efficiency, and the summation is over all collisional energy loss processes with cross-section, σi, threshold energy, Wi, and electron energy loss per collision, δi. Various electron impact cross-sections are taken from Cui et al. (2011), including 18 channels of electronic or vibrational excitation and 7 channels of (dissociative) ionization. For excitation processes, δi is taken as Wi, whereas for ionization processes, δi includes the contributions from both threshold energy and kinetic energy of the secondary electron, of which the latter is calculated with the aid of the experimental results of Opal et al. (1971). is very poorly constrained and likely to be very small (Fox & Dalgarno 1979). For illustrative purpose, we assume that solar EUV heating at the lower boundary of 130 km and under subsolar conditions is the sum of photoelectron impact heating and chemical heating via
  dissociative recombination (DR; see Section 4.3), as motivated by the modeled thermal balance of the Venusian upper atmosphere (Fox 1988). This yields an electron impact heating efficiency of 0.035, which is adopted throughout this section. The absolute value of this efficiency is unimportant for the purpose of the present study.
The electron impact heating rates for both DD2 and DD4 are shown with the dotted lines in Figure 3, again red for CF and blue for NCF. The differential electron flux is nearly identical between the two cases. Accordingly, the difference in electron impact heating between CF and NCF is negligible, over both the energy range characteristic of locally produced photoelectrons and the range characteristic of precipitating SW electrons (e.g., Peterson et al. 2016). This implies that neither enhanced SW electron precipitation nor photoelectron trapping is able to account for the NGIMS observations.
4.3. Ion Chemical Heating
It is well known that the presence of strong crustal magnetic fields causes localized upwelling in the dayside Martian ionosphere (Andrews et al. 2014 and references therein), which is attributed to the natural outcome of field-aligned plasma diffusion (Matta et al. 2015). This means that various exothermic ion chemical heating rates, which depend on the plasma distribution within the ionosphere, are magnetically controlled. Here, for illustrative purpose, we evaluate the role of both  and CO2+ DR as two of the most important chemical heating channels (Fox 1988), with the respective rate coefficients, branching ratios, as well as exothermicities adapted from Fox (2012) and Fox (2004). The sum of the
  and CO2+ DR heating rates is shown with the dashed–dotted line in Figure 3, red for CF and blue for NCF. For both campaigns, these heating rates are substantially lower than the solar EUV heating rates at all altitudes of interest. Meanwhile, no evidence of enhanced ion chemical heating over strong crustal magnetic fields is seen.
5. Concluding Remarks
The thermal structure of the dayside Martian upper atmosphere is well known to be controlled by solar EUV heating, radiative cooling via CO2 emission, and thermal conduction (e.g., Bougher et al. 1999, 2000), but whether or not strong crustal magnetic fields have an impact as well remains unclear (Leblanc et al. 2006; Stiepen et al. 2015). By analyzing the MAVEN NGIMS measurements of CO2 during several DD campaigns that sample the southern hemisphere of Mars, we are able to compare the mean temperature profiles obtained over regions with strong crustal magnetic fields and those obtained over regions without. We observe clear temperature enhancement over crustal magnetic fields for one subsolar campaign (DD2) and another near-terminator campaign (DD4). The temperature enhancement is manifest over a limited altitude range, centered around 155 km for DD2 and 170 km for DD4. Several controlling factors, such as solar EUV irradiance, relative atomic O abundance, and non-migrating tides, do not help to explain the observed temperature enhancement, and a magnetically driven scenario is favored.
We evaluate the roles of several heating mechanisms that are likely modulated by the presence of crustal magnetic fields by calculating the respective heating rates and comparing them to the solar EUV heating rates. These mechanisms include Joule heating, ion chemical heating, as well as electron impact heating via either precipitating SW electrons or locally produced photoelectrons. None of these mechanisms is able to interpret the NGIMS observations. Despite this, we caution that the influence of near-terminator Joule heating could be large if the horizontal plasma flow velocity reaches ≳1 km s−1 as implied by some previous studies of day-to-night transport in the Martian ionosphere (Cui et al. 2015).
Conclusions made in the present study rely exclusively on the NGIMS measurements made during two DD campaigns. Further support is clearly required to confirm the impact of crustal magnetic fields on neutral temperature, as well as to identify the responsible mechanism when more data become available. For this purpose, the data from the MAVEN nominal science orbits may not be very useful since the impact of magnetic field is likely manifest at altitudes below their periapses. This is in contrast to the recent finding that a similar impact on electron temperature is manifest above 200 km (Flynn et al. 2017).
The authors acknowledge support from the National Science Foundation of China (NSFC) through grants 41525015, 41774186, and 41504133. J.C. and L.L.Z. are also supported by the Science and Technology Development Fund of Macau SAR (FDCT) through grants 039/2013/A2 and 082/2015/A3.