
Abstract
As-synthesized ZnS:Cu,Al nanocrystals with average size of 2–3 nm show abroad emission band peaking at 445 nm (blue) and a shoulder at around 540 nm (green). Annealing the nanocrystals in nitrogen gas results in a reduction in the intensity of the blue emission while enhancing the intensity of the green emission band. The maximum of the green emission is first redshifted to around 590 nm when the annealing temperature is increased to 400 °C, and later blueshifted to 564 and 500 nm for the samples annealed at 500 °C and 600 °C for 1 h, respectively. The lower phase-transition temperature (from zinc blende to wurtzite) and the donor–acceptor pair luminescence process in nanocrystals are discussed.
Export citation and abstract BibTeX RIS

Content from this work may be used under the terms of the Creative Commons Attribution-NonCommercial-ShareAlike 3.0 licence. Any further distribution of this work must maintain attribution to the author(s) and the title of the work, journal citation and DOI.
1. Introduction
Materials based on the host lattice of ZnS doped with transition-metal or rare-earth ions are a class of particularly luminescent materials and they have been recognized as an efficient electroluminescent phosphor. In 1994, Mn-doped ZnS nanocrystals were synthesized for the first time by Bhargava et al [1]. They found that doped nanocrystals of semiconductors can yield both high luminescent efficiencies and lifetime shortening at the same time. Thereafter, transition-metal and rare-earth doped and co-doped ZnS nanocrystals have received increasing interest. Different ZnS-doped nanocrystals have been synthesized, including ZnS:Cu [2–5], ZnS:Mn [1, 6], ZnS:Pb, ZnS:Pb,Cu [7], ZnS:Eu [8], ZnS:Sm [9], ZnS:Co,Cu [10] and ZnS:Mn,Cd [11]. Among these doped ZnS nanocrystals, ZnS activated with Cu ions is the most efficient cathodoluminescence phosphors. The ZnS co-doped with Cu, Al is well known as a very important green phosphor for cathode ray tubes (CRTs) [12]. It also plays an important role in multicolor electroluminescent devices [13]. Direct evidence for high efficiency was reported using the infrared absorption spectrum induced by ultraviolet irradiation and the characteristic decay curve [14]. In practice, the origin of the luminescence of the ZnS phosphor is interpreted as due to the electron-hole recombination of donor–acceptor pairs. The luminescent mechanisms of ZnS:Cu,Cl and ZnS:Cu,Al phosphors has been reported by Chen et al [12]. The mechanisms of concentration quenching of the green-Cu luminescence in ZnS:Cu,Al under cathode-ray were discussed by Kawai et al [15]. However, for Zn:Cu,Al phosphor, most of the previous studies were on micron or submicron powders. Only a limited number of papers have been reported for ZnS:Cu,Al nanocrystals, and in different environments. Morita et al [16] reported a luminescence and ultrafast decay profile of nanosize ZnS:Cu,Al in sol–gel silica glasses. The space-resolved photoluminescence (PL) of ZnS:Cu,Al nanocrystals fabricated by sequential implantation of Zn +, S +, Cu + and Al + ions into Al 2 O 3 matrices has been reported by Ishizumi et al [17]. In this paper, luminescence characteristics of as-synthesized (with sizes of 2–3 nm) and of annealed Cu,Al co-doped ZnS nanocrystals were measured. The dependence of PL spectra on Cu, Al doping concentration as well as the luminescent behavior of annealed ZnS:Cu,Al phosphors were investigated and are discussed.
2. Experimental
ZnS nanocrystals co-doped with Cu,Al were synthesized by a chemical method based on the co-precipitation reactions in polymeric networks. The basic sample preparation procedure is similar to those reported for the synthesis of nanocrystalline ZnS:Mn 2+ and ZnS:Cu 2+ [2, 18], but with different dopants. The detailed process can be described as follows. 10.2 g Na(PO 3)n was totally dissolved in 70 ml of de-ionized water. Next 10 ml Zn(CH 3 COO)2 1 M, x ml CuBr 2 0.1 M and x ml Al(NO 3)3 0.1 M (x=0.04, 0.06, 0.08, 0.1 and 0.12) were added to that aqueous solution and continuously stirred. After about 30 min of stirring, 10 ml of a 1 M Na 2 S·H 2 O solution was added drop-wise to the above solution while the reactants were continuously stirred. The final volume after the addition was about 100 ml. The solution was continuously stirred for 2 h. Immediately after injection of the Na 2 S solution, a turbid fluid was obtained. The precipitation was well separated from the solution by centrifuging at 12000 rpm, rinsed several times with de-ionized water to eliminate sodium polyphosphate (PP), washed with ethanol, and finally dried in vacuum. A dried fine white Cu,Al-doped ZnS nanopowder was obtained. All steps of the synthesis were performed at room temperature and under ambient conditions. To study the influence of total volume on particle size, different samples were synthesized with different total volume. For annealed samples, as-synthesized nanopowders were heat-treated in nitrogen gas in the temperature range from 200 to 600 °C for 1 h. The PL spectra of Cu,Al-doped ZnS nanopowder were recorded with a JOBIN YVON SPEX FL-3-22 and Spex1250 fluorescence spectrophotometer. X-ray powder diffraction was performed on a SIEMENS (D5000) diffractometer using CuKα with λ=0.154 06 nm. All measurements were carried out at room temperature.
3. Results and discussion
X-ray diffraction (XRD) patterns of as-synthesized and annealed ZnS:Cu,Al nanopowder samples are shown in figure 1. This reveals that as-synthesized ZnS:Cu,Al nanoparticles (figure 1(a)) exhibit a cubic-zinc blende crystal structure, which is the stable phase for room temperature bulk ZnS. The three diffraction peaks correspond to (111), (220) and (311) planes of the cubic crystal ZnS, respectively. Due to the size effect, the XRD peaks broaden and their widths become larger as the crystals become smaller. No characteristic peaks of doping impurity Al, Cu phases or other phases were observed in the XRD pattern. The crystallite size of the as-synthesized sample (calculated from XRD) was about 2–3 nm. Annealing the particles at temperatures of 200 and 300 °C had little effect on the XRD pattern; this only slightly increased the intensity and slightly narrowered the diffraction peaks (not shown). The wurtzite structure appeared (not clearly) on the sample that was annealed at 450 °C (figure 1(b)) and was clearly visible on the sample annealed at 500 °C (figure 1(c)). In figure 1(c), the wurtzite (100) and (101) peaks are clearly visible next to the zinc blende (111). It is known that the corresponding bulk zinc blende-to-wurtzite phase transition temperature is 1020 °C. This value is much higher than the transition temperature of 450–500 °C observed for the nanocrystals in this study. For ZnS phosphor, it is reported that greater luminance is often obtained for the high temperature phase [19]. The lower phase transition temperature of the ZnS:Cu,Al nanocrystals indicates potential advantages of these materials for glass-based optoelectronic device fabrication.
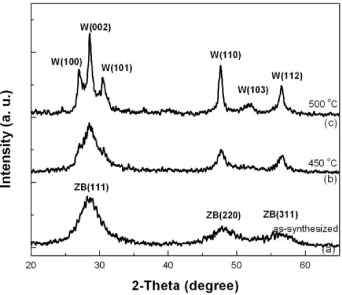
Figure 1 XRD patterns of as-synthesized and of ZnS:Cu,Al nanocrystals annealed at 450 and 500 °C for 1 h in a nitrogen-gas environment. Peak assignments for zinc blende (ZB) and wurtzite (W) structures are shown. The wurtzite structure appeared (not clearly) on the sample that was annealed at 450 °C and was clearly visible on the sample annealed at 500 °C.
In figure 2, the emission spectra of the as-synthesized ZnS:Cu,Al (2.5 nm) sample with a Cu,Al doping concentration of 0.1 mol% are depicted. The emission spectrum of the sample doped with Cu only (Cu 0.1 mol%), synthesized in similar conditions and with average sizes of 2.5 nm, is also shown in figure 2 for comparison. For the ZnS:Cu,Al sample, upon 353 nm excitation, a broad emission band peaking at 445 nm (blue) and a shoulder at around 540 nm (green) were observed. For the Cu-doped sample, two broad emissions with peaks at 442 and 570 nm were seen. It is interesting to note that the PL spectrum of the ZnS:Cu sample observed in our study is very similar to those reported in [2, 18]. The only difference is that both the blue and green emissions have blueshifted to a shorter wavelength due to the smaller crystal size of the ZnS nanocrystals [2].
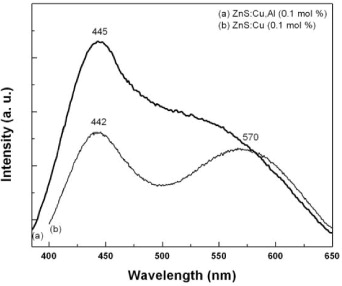
Figure 2 Typical room-temperature photoluminescence spectra of (a) ZnS:Cu,Al (0.1 mol%) and (b) ZnS:Cu (0.1 mol%) samples.
Figure 3 represents the photoluminescence spectra of as-synthesized ZnS:Cu,Al nanocrystals with various Cu, Al-doping concentrations. It is shown that the PL intensity increased with increasing Cu,Al doping concentration and reached the maximum at the Cu,Al concentration of 0.1 mol%. At higher concentrations, the intensity of both PL bands quenched. However, one should note that at the Cu, Al doping concentration of 0.12 mol%, the intensity ratio between the red and green emission became smaller, and the green emission band appeared more as an individual peak rather than a shoulder, as observed in the samples with lower doping concentration. Previously, the intensity of the cathodoluminescence spectra of ZnS:Cu,Al was found to depend on the Cu concentration [12]. For a Cu concentration above 300 ppm, the blue emission (450 nm) is significantly dominant, while the green emission is dominant in the sample doped with a lower Cu concentration (150, 200 and 250 ppm). Van Gool [20] when studying the discolor mechanism in ZnS:Cu,Cl and ZnS:Cu,Al proposed that the luminescence color difference with copper activator concentration is due to the ratio of the activator (Cu) and the coactivator (Al or Cl). The different wavelengths emitted are attributed to the copper activator concentration. In another study, Kawai et al [15] explained the concentration dependence of the luminescence intensity by a model assuming complete pairing of the donor and acceptor. The concentration quenching of the green-Cu luminescence in ZnS:Cu,Al is observed if the interstitial Cu + ions act as recombination centers for free carriers and provide the dominant non-radiative path for excitation energy when the Cu concentration is much greater than that of Al. In our study, as the Cu and Al doping concentrations are changed equally, i.e. Cu and Al were equally doped in all cases, we did not observe the interchange of the PL intensity between the blue and green emission bands. The intensity of both the blue and green emission bands first increased with increasing Cu,Al concentration and later decreased at concentrations higher than 0.1 mol%. The concentration quenching of both the green and blue luminescence in ZnS:Cu,Al is therefore due to the excess Cu dopant that generates a non-radiative path for excitation energy at high Cu concentrations.
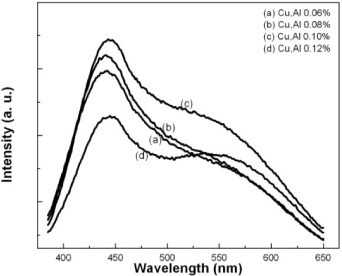
Figure 3 Al, Cu-doping concentration dependence of the photoluminescence spectra of as-synthesized ZnS:Cu,Al samples.
Figure 4 shows the PL spectra of as-synthesized samples annealed at 200, 400, 500 and 600 °C (Cu, Al doping concentration of 0.08 mol%). As can be seen from the figure, the PL intensity of the blue emission strongly decreases when the annealing temperature increases to 400 °C. At the same time, the intensity of the green emission band substantially increases and seems to red-shift to a longer wavelength region (maximum at around 590 nm). At a higher annealing temperature, only a much broader emission band is observed. The maximum of this emission is strongly blue-shifted to 564 nm at 500 °C and to 500 nm after annealing for 1 h at 600 °C.
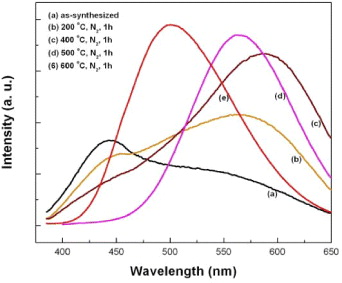
Figure 4 Annealing temperature dependence of the photoluminescence spectra of the ZnS:Cu,Al (Cu,Al 0.1 mol%).
ZnS:Cu,Al phosphor has two main, well-known emission bands, namely blue and green bands [21]. Manzoor et al [13] reported a blue emission at 462 nm and a green emission at 530 nm by electroluminescence measurements. Using PL, Ishizumi et al [17] observed a strong green band at ∼516 nm and a weaker blue band from ZnS:Al,Cu nanocrystals fabricated by sequential ion implantation. Cathodoluminescent studies by Chen et al [12] and Li et al [22] revealed blue emissions, respectively, at 450 and 449 nm, and green emissions, correspondingly, at 506 and 525 nm. The origin of both the blue and green emissions of the ZnS:Cu,Al phosphor were interpreted due to the electron–hole recombination of donor–acceptor pairs. However, the green emission was assigned directly to the Al Zn –Cu Zn pair, while the blue emission was often explained due to the self-activated center (in the presence of surface-modified defects centers) such as sulfur or zinc vacancies [12, 13, 17]. The competition between the two donor–acceptor (D–A) type emission processes results in the different intensity of the blue and green emissions as observed in different experiments. In our study, the appearance of the stronger blue emission for the as-synthesized nanocrystals with such a small size of 2 nm indicates the dominance of the self-activated emission mechanism. The fact that the average size of the as-synthesized nanocrystals used in this study is only about 2 nm (i.e. high surface to volume ratio, larger surface-modified defects) supports this observation. Upon annealing in nitrogen gas, the average size of the nanocrystals increased, leading to a reduction of the surface-modified defects, at the same time to better incorporation of both the Cu and Al ions into ZnS crystals by thermal diffusion, as has recently been reported for annealed Mn-doped ZnS nanoribbons [23]. All of these result in a decrease in the PL intensity of the blue band while the intensity of the green band is enhanced substantially. The observation of the redshift of the maximum of the green emission with the increase in the annealing temperature from as-synthesized to 400 °C and later blue-shift when further increasing the temperature to 600 °C reveals a very complicated luminescence mechanism for the ZnS:Cu,Al. The XRD result of figure 1 showed that the increase in the nanocrystal size upon annealing is accompanied by a phase transition from the low-temperature cubic-zinc blende phase to the high-temperature hexagonal-wurtzite phase. At annealing temperatures below 400 °C, the cubic ZnS is the dominant phase. The portion of hexagonal phase increases with increasing annealing temperature and becomes dominant at 500 °C and higher. Due to the existence of both cubic and hexagonal ZnS crystals in the sample, a complicated energy level structure of Cu and Al impurities in ZnS is expected (due to the slightly different band gap of the hexagonal and cubic phases). The redshift of the green emission observed for the annealing temperature up to 400 °C may therefore be directly related to the change in band-gap value of ZnS nanocrystals due to quantum size effect as the crystal size increases (in cubic phase). At higher temperature, as the hexagonal phase becomes the dominant phase, the PL emission mechanism is then only governed by the energy levels of shallow donor and acceptor centers in ZnS crystals. This change results in the observation of the very strong and incredibly broad green emission with a peak at around 500 nm from the 600 °C annealed sample, as shown in figure 4(e).
4. Conclusion
ZnS:Cu,Al nanocrystals were synthesized in polymeric networks via a chemical co-precipitation reaction. XRD results demonstrated that as-synthesized ZnS:Cu,Al nanocrystals have a zinc blende crystal structure and transformed to the wurtzite crystal structure at an annealing temperature of 450–500 °C. A broad PL emission band peaking at 445 nm (blue) and a shoulder at around 540 nm (green) were observed from ZnS:Cu,Al nanocrystals under the excitation wavelength of 353 nm, and they reach maximum intensity at a dopant concentration of 0.10 mol%. It is observed that PL properties of ZnS:Cu,Al nanocrystals depend strongly on the annealing temperature. The intensity of the blue emission decreases while the intensity of the green emission increases when increasing the annealing temperature. The maximum of the green emission is first redshifted to around 590 nm when the annealing temperature increasesto 400 °C, and then blueshifted to 564 and 500 nm, respectively, for the samples annealed at 500 and 600 °C for 1 h. The redshift of the green emission observed for the annealing temperature up to 400 °C is interpreted as due to the change in band-gap value of ZnS nanocrystals due to the quantum size effect. At higher temperature, the PL emission mechanism is only governed by the energy levels of shallow donor and acceptor centers in high temperature wurtzite ZnS crystals.
Acknowledgments
This work was financially supported by the National Foundation for Science and Technology Development (NAFOSTED), Vietnam, under project No. 103.02.102.09 and the VLIR's Own Initiatives' Program 2010, project ZEIN2010RIP07.