

Abstract
Oligomerization plays a crucial role in the function of nucleophosmin (NPM), an abundant nucleolar phosphoprotein. Two dual-color methods based on modern fluorescence confocal microscopy are applied for tracking NPM aggregates in live cells: cross-correlation Number and Brightness analysis (ccN&B) combined with pulsed interleaved excitation (PIE) and fluorescence-lifetime imaging microscopy (FLIM) utilizing resonance energy transfer (FRET). HEK-293T cells were transfected with mixture of plasmids designed for tagging with fluorescent proteins so that the cells express mixed population of NPM labeled either with eGFP or mRFP1. We observe joint oligomers formed from the fluorescently labeled NPM. Having validated the in vivo methods, we study an effect of substitutions in cysteine 21 (Cys21) of the NPM N-terminus on the oligomerization to demonstrate applicability of the methods. Inhibitory effect of mutations of the Cys21 to nonpolar Ala or to aromatic Phe on the oligomerization was reported in literature using in vitro semi-native electrophoresis. However, we do not detect any break-up of the joint NPM oligomers due to the Cys21 mutations in live cells. In vivo microscopy observations are supported by an in vitro method, the GFP-Trap immunoprecipitation assay. Our results therefore show importance of utilizing several methods for detection of biologically relevant protein aggregates. In vivo monitoring of the NPM oligomerization, a potential cancer therapy target, by the presented methods offers a new way to monitor effects of drugs that are tested as NPM oligomerization inhibitors directly in live cells.
Export citation and abstract BibTeX RIS
Abbreviations
| AML | acute myeloid leukemia |
| ccN&B | cross-correlation N&B analysis |
| FFS | fluorescence fluctuation spectroscopy |
| FLIM | fluorescence lifetime imaging microscopy |
| FP | fluorescent proteins |
| FRET | Förster (fluorescence) resonance energy transfer |
| NCL | nucleolin |
| NPM | nucleophosmin |
| PIE | pulsed interleaved excitation |
1. Introduction
Nucleophosmin (NPM) is an abundant nucleolar phosphoprotein with strong expression in proliferating cells [1–3]. NPM, similarly to another abundant nucleolar phosphoprotein nucleolin (NCL), is thought to function as a hub protein. NPM is thus capable of interacting with other nucleolar assembly proteins [4]. They are involved in various types of cancer. NPM is frequently overexpressed in solid tumors [5, 6]. NPM is upregulated in relapsed/refractory acute leukemia as shown by proteomic analysis [7]. Moreover, NPM is mutated or fused to other proteins in hematological disorders [6, 8]. The NPM1 gene mutation resulting in changes of the NPM C-terminus is the most frequent genetic aberration in the acute myeloid leukemia (AML) [9]. These changes cause relocation of the C-terminus-mutated NPM (NPMc+) from the nucleolus into the cytoplasm [10, 11]. In the cells expressing the NPMc+, NPM-interacting tumor supressors such as p53 or ARF are readily dislocated to the cytoplasm bound to NPMc+, which interferes with their proper regulative and anti-malignant action [12–14].
Oligomerization state of the NPM is critical for its function and dynamics [15–17]. NPM, a member of nucleoplasmin family of proteins [18, 19], forms pentamers in a ring-like configuration [20, 21]. Current models of the pentameric NPM arrangement are based on x-ray crystallography of the core oligomerization domain without protein C-terminus [22]. NPM N-terminus domain is reported to be responsible for the oligomerization [23, 24]. Cysteines Cys21 and Cys104 present in the N-terminus were identified to play important role in the NPM oligomerization [16, 25]. Formation of the NPM pentamers was inhibited by mutation of Cys21 to Ala or to aromatic hydrophobic residues (Phe or Tyr). The C21F mutant expressed in MCF7 cells did not oligomerize with endogenous wild-type (WT) NPM [16]. Conserved tyrosine 67 in β-hairpin was also found to affect the NPM oligomerization in dominant-negative fashion [26]. On the other hand, the NPMc+ keeps its ability to form oligomers [25, 27].
The NPM oligomerization, specifically the N-terminus of NPM responsible for the oligomerization, is being considered a promising target for the cancer therapy [28, 29]. Though only the Phe and not the Tyr substitution of Cys21 drastically inhibited chaperone activity of NPM [16], it is supposed that the oligomerization of NPM is linked to its molecular chaperon activity [1]. Furthermore, it is supposed that the ability of NPM to interact with the tumor suppressors depends also on its oligomerization status [6, 30, 31]. Targeting the NPM interaction ability via modulation of its oligomerization should help to re-localize the tumor suppressors back to the nucleus. Their pro-apoptotic activity should be restored there, possibly in cooperation with WT NPM resting in the nucleus. The small molecule inhibitor NSC348884 was identified to interfere with the oligomerization thereby affecting differentiation and apoptosis in leukemic cells [15, 32, 33]. Treatment with cytotoxic agents such as actinomycin D did not affect the NPM oligomerization in HeLa cells [34]. The oligomerization was changed during apoptosis induced by tumor necrosis factor [35].
The oligomerization of NPM has been extensively studied in vitro. Various methods, such as PAGE [16, 31], native electrophoresis [17, 34], sedimentation in saccharose gradient [1, 34, 36], co-immunoprecipitation with epitope tags [27, 36, 37], deuterium exchange mass spectrometry (DXMS) [26], size exclusion chromatography [1] and split synthetic Renilla luciferase protein fragment-assisted complementation (SRL-PFAC) [38], were used. However, our ability to understand oligomerization processes in cells is still limited [39]. Data on the NPM oligomerization in vivo are mostly missing. Fusing NPM with colored variants of fluorescent proteins (FP) enables application of fluorescence-based methods to monitor protein-protein interactions in vivo. Classical one-color Number and Brightness (N&B) is a fluorescence fluctuation spectroscopy (FFS) method [40], in which a number of fluorescing molecules and their brightness are statistically evaluated for each pixel along series of images. This enables to estimate the aggregation state of the fluorescing species [41, 42]. N&B method was reported to provide reliable information on molecular aggregation in vivo, including additional spatial information contained in 2D brightness maps [41]. Standard transfection protocols provide relatively high expression levels of fluorescently labeled proteins which is ideal for imaging but unfavorable for one-color N&B, because fluctuations of the fluorescence intensity of individual molecules are difficult to resolve against a relatively high signal. Based on a simultaneous two color detection, dual-color FFS techniques, such as fluorescence cross-correlation spectroscopy (FCCS) [43, 44] or cross-correlation Number and Brightness analysis (ccN&B) [40, 45], offer convenient tools to detect protein aggregates in live cells. Having cloned plasmids for expression of NPM fused with eGFP and mRFP1 [46], we apply the ccN&B [47] to monitor joint aggregates formed by NPM tagged with both FP variants. The ccN&B is combined with a pulsed interleaved excitation (PIE) [48, 49], which enhances the method sensitivity by suppressing spectral cross-talk caused by bleeding of eGFP fluorescence to mRFP1 detection channel. We validate the method in live cells by using appropriate controls.
The FFS-based methods can be complemented by the Förster resonance energy transfer (FRET) reporting on proximity of the FP-tagged proteins. In FRET, transfer of excitation energy from donor, e.g. eGFP, to acceptor, e.g. mRFP1, depends strongly on their distance in the nm range. As FRET also manifests in shortening of the donor fluorescence lifetime [50, 51], proximity of the tagged proteins can be effectively monitored by fluorescence lifetime imaging microscopy (FLIM). We observe shortening of eGFP fluorescence lifetime in a mixture of eGFP- and mRFP-tagged NPM and we attribute this shortening to FRET by acceptor photobleaching. The FLIM-FRET can therefore instantly monitor the co-localization of the FP-tagged NPM in aggregates formed in live cells [50–53]. In agreement with the ccN&B method, FLIM-FRET experiments verify our observations made when studying NPM substituted in the Cys21. Finally, we confirm the unexpected stability of the Cys21-mutated NPM aggregates also with an in vitro method, co-immunoprecipitation GFP-Trap assay.
2. Material and methods
2.1. Cell cultivations
Adherent cell line HEK-293T (a gift from Š Němečková's lab, Institute of Hematology and Blood Transfusion) was cultured under standard cultivation conditions in DMEM (SIGMA) supplemented with 10% FBS (SIGMA), 37 °C and 5% CO2 atmosphere.
2.2. Flow cytometry
Co-transfection efficiency was tested by flow cytometry (LSR Fortessa, BD Biosciences). Cells were detached from cultivation dish with Trypsin (SIGMA), dissolved in DMEM medium to block Trypsin, span down and then resuspended in PBS. Fluorescence originating from eGFP and mRFP1 tags was registered in FITC and PE channels, respectively. Green and red -positive events were assessed for at least 20 000 cells for each sample.
2.3. Co-immunoprecipitation GFP-Trap assay
Transfected cells expressing fluorescent proteins were processed after 40h-incubation. GFP-Trap_A system (Chromotek) was used following the manufacturer's instructions as described in [27]. Briefly, eGFP expressing adherent cells were scrapped from dish in ice-cold PBS and extensively washed with PBS. The cell pellet was lysed in the lysis buffer (10 mM Tris/Cl pH 7.5, 150 mM NaCl, 0.5 mM EDTA, 0.5% NP-40, protease and phosphatase inhibitors) on ice for 30 min and centrifuged at 20.000 g/10 min/4 °C. The lysate was applied on the GFP-Trap_A beads and rotated for 1 h at 4 °C. Then the samples were centrifuged and extensively washed in the diluting buffer (10 mM Tris/Cl pH 7.5, 150 mM NaCl, 0.5 mM EDTA) to be resuspended in 2xSDS-sample buffer (100 mM Tris pH 6.8, 4% SDS, 200 mM DTT, 20% glycerol), boiled for 10 min and centrifuged at 2.500 g/2 min/4 °C. Supernatant was stored at −20 °C until used for SDS-PAGE. Western blotting was carried out according to [27]. Mouse monoclonal antibodies against GFP and NPM (clone 3F291) were from Santa Cruz Biotechnology and they were used at a dilution 1:500. Anti-mouse HRP-conjugated secondary antibody was purchased from Thermo Scientific and used at concentrations 1:50 000. Blots were visualized with ECL Plus Western Blotting Detection System (GE Healthcare) and evaluated by G-box iChemi XT4 digital imaging device (Syngene Europe).
2.4. Plasmid construction and cell transfection
Plasmids for expression of fluorescently tagged proteins were constructed by standard molecular cloning techniques (cutting with restriction enzymes (Thermo Scientific) and ligation (NEB)). Plasmids for NPM and NCL expression were prepared as described in [46]. Fragments, PCR-amplified from cDNA library (Jurkat cells, Origene), were subcloned to vectors peGFP-C2 or pmRFP1-C2 (originally Clontech) using XhoI and BamHI unique restriction sites. Mutations of Cys21 were introduced to the sequence of WT NPM using merged primers containing appropriate mutation and XhoI restriction site (table 1). Following PCR amplification, the resulting fragments were subcloned into the peGFP-C2 and the pmRFP1-C2 as in the case of the WT NPM form.
Table 1. Primers used in plasmid construction for PCR amplification.
| G_NPM forward | aaaaaactcgagcatggaagattcgatggacatg |
| G_NPM(C21A) forward | aattaactcgagcatggaagattcgatggacatggacatgagccccctgaggccccagaactatcttttcggtgctgaactaaaggc |
| G_NPM(C21F) forward | aattaactcgagcatggaagattcgatggacatggacatgagccccctgaggccccagaactatcttttcggtttcgaactaaaggc |
| G_NPM reverse | aaaaaaggatcccttaaagagacttcctccactgc |
The constructed plasmids were amplified in E. coli and purified with PureYield Plasmid Miniprep System (Promega). For transfection, cells were seeded to 1 × 10⁵/ml cell density 24 h prior transfection. Expression plasmids were transfected into HEK-293T cells using jetPrime transfection reagent (Polyplus transfection) according to manufacturer's protocol. Growth medium was replaced 4 h after transfection and cells were then grown 40 h prior analysis.
The NPM constructs and their combinations which were prepared or used in this study are summarized in table 2. In addition, combination of NCL constructs is mentioned.
Table 2. Coding of constructs and their combinations (symbol '/' denotes mixture of constructs).
| R_NPM_G | positive control, bi-colored NPM with mRFP1 and eGFP attached on N- and C-terminus, respectively |
| G_NPM/R_NPM | two color NPM (mixture of NPM tagged with eGFP or mRFP1, both from the N-terminus) |
| G_NPM | NPM tagged with eGFP from the N-terminus |
| G_NPM/R | negative control (mixture of NPM tagged with eGFP from the N-terminus and free mRFP1) |
| G_NCL/R_NCL | two color NCL (mixture of NCL tagged with eGFP or mRFP1, both from the N-terminus) |
| G_NPM-C21A | NPM C21A mutant tagged with eGFP from the N-terminus |
| G_NPM-C21F | NPM C21F mutant tagged with eGFP from the N-terminus |
| G_NPM-C21A/R_NPM-C21A | two color C21A NPM mutant (mixture of G_NPM-C21A tagged with eGFP or mRFP1, both from the N-terminus) |
| G_NPM-C21F/R_NPM-C21F | two color C21F NPM mutant (mixture of G_NPM-C21F tagged with eGFP or mRFP1, both from the N-terminus) |
2.5. Live cell imaging
The cells were grown on glass bottom Petri dish (Cellvis). Fluorescence experiments were carried out at a room temperature after sealing the Petri dish with parafilm to prevent CO2 leakage. One Petri dish sample was measured typically within 1 h. The subcellular distribution and colocalization of eGFP- or mRFP1-fused NPM variants were observed under a confocal laser scanning microscope FluoView FV1000 (Olympus Corporation) as in [46]. Fluorescence images were processed by FluoView FV10-ASW 3.1 software and by ImageJ-FiJi.
2.6. PIE-ccN&B data acquisition and analysis
PIE-ccN&B cross-correlation experiments utilized dual-color laser excitation set-up with a pulsed 'blue' source (Picoquant, LDH-DC-470, 470 nm) and a 'green' continuous wave source (Uniphase, He-Ne laser, 543 nm). The excitation beam of both wavelengths was guided into the sample via 488/543/633 dichroic mirror (Olympus) and water immersion objective (Olympus 60x, NA 1.2). The emitted fluorescence was then guided through a pinhole (120 μm), coupled into the multimode optical fiber and at its exit it was split into two detection channels separated by a 535 DCXC dichroic mirror (Chroma filters). The 'blue' and 'green' emission channels were equipped with the bandpass filters transmitting wavelengths of 515 ± 15 nm and 605 ± 20 nm (Chroma filters), respectively. Signal was detected with two single photon counting modules (tau-SPAD, Picoquant) and the arrival times were recorded with multichannel event timer with TCSPC option (Hydraharp 400, Germany) synchronized with the Galvo scan unit (Fluoview 1000, Olympus). This arrangement enabled us to operate the experiments in the PIE mode adjusted for the combination of pulsed and continuous wave laser. Specifically, the 'blue' pulsed laser was operated at 10 MHz repetition rate (i.e. approximately 100 ns temporal spacing between the adjacent pulses). As the lifetime of the eGFP fluorophore is about 2.5 ns, the mRFP1 emission excited exclusively by the continuous wave 'green' source can be extracted by means of the time-gating (i.e. the signal coming in last 50 ns within the TCSPC histogram was taken), which suppressed completely the undesired cross-talk artifact. For the PIE-ccN&B cross-correlation experiments, we adapted the protocol originally developed for the Raster image correlation spectroscopy (RICS) [54]. For each experiment, 100 frames consisting of 84 × 82 pixels were collected. The scanner was operated at the speed of 100 μs/pixel with a step of 50 nm. The image stacks were taken only from the nucleoplasm which displayed relatively uniform fluorescence intensity.
The values of eGFP and mRFP1-brightness (B1 and B2, respectively) and cross-brightness (Bcc) can be calculated for each pixel within the recorded set of images as described in [55, 56]. In brief, prior to the brightness calculation the images were corrected for bleaching by a detrend procedure accounting for the Poissonian distribution of the recorded signal. The cross-variance σcc of the fluorescence signal, and subsequently the cross-brightness Bcc, were then evaluated for the eGFP and mRFP1 channels as follows:


where  and
and  stand for the fluorescence intensity in the eGFP and mRFP1 channel, respectively,
  and
and  stand for their means and K is the number of evaluated frames.
2.7. FLIM—data acquisition and analysis
FLIM experiments were carried out on an inverted IX83 microscope with FV1200 confocal scanner (Olympus). The microscope was equipped with a FLIM add-on comprising picosecond semiconductor lasers, fibre-coupled GaAsP hybrid detectors, and TimeHarp 260PICO TCSPC detection electronics (all PicoQuant, Berlin, Germany). The instrument was complemented with frequency-doubled OPO (Chameleon compact), laser (Coherent, Santa Clara, USA) for tunable VIS excitation used in photobleaching experiments. Specifically, cellular FLIM experiments were performed with a UPLSAPO 60x NA 1.2 water immersion objective (Olympus). eGFP fluorescence was excited at 485 nm by a LDH-DC-485 laser head (PicoQuant), emission decays were collected on the pixel-by-pixel basis in the epi-fluorescence mode using combination of 560 nm short-pass dichroic and Semrock 520/35 bandpass filters in the descanned detection path. To avoid pile-up, the data collection rate was kept below 5% of the laser repetition rate. FLIM data were analyzed by the SymPhoTime64 software (PicoQuant). The lifetime images were generated by a robust 'fast-FLIM' approach when mean pixel lifetimes were calculated by a method of moments [57]. Specifically, the mean lifetime τav for each pixel was determined as the difference between the barycentre of the fluorescence decay recorded at one position of the scanner and the offset toffset at the steepest uprise of the decay curve:

where Ii stands for the intensity recorded in time ti. Least-squares reconvolution was applied for accurate analysis of cumulative decays from larger ROIs (cell, nucleus, nucleolus). Fluorescence of eGFP was assumed to decay bi-exponentially [53, 58]:

where τi are lifetime components and ai stand for corresponding amplitudes. The intensity-weighted mean fluorescence lifetime was calculated as:

where fi are intensity fractions of the ith lifetime component. Correlation plots were done in Matlab.
2.7.1. Statistical analysis
Statistical analysis was performed using the GraphPad Prism software. Student's t test was performed for statistical analysis, p values of p < 0.05 were deemed statistically significant. Asterisks are used to denote statistical significance: *, p < 0.05; **, p < 0.01 and ***, p < 0.001.
3. Results
3.1. Expression of dual-color labeled NPM variants in HEK-293T cells
Methods for the NPM oligomerization monitoring based on the cross-correlation FFS (ccFFS) require dual-color labeling. We transfected HEK-293T cells with 1:1 mixtures of plasmids (table 2), as in [46], to ensure simultaneous expression of eGFP- and mRFP1-tagged NPM inside the cell. Typical confocal images of cells expressing NPM variants labeled with both colors are shown in figure 1.

Figure 1. Cellular localization of NPM variants tagged by fluorescent proteins; Localization of G_NPM and R_NPM corresponds to the natural nucleolar localization of WT NPM (row A). C21A and C21F NPM mutants exhibit a similar nuclear localization (row B and row C, respectively). All NPM forms, regardless of the fluorescent protein variant used for their labeling, are located mainly in the nucleolus. Co-localization of the colored forms is shown in the merge images. Minor nucleoplasmic localization of NPM is shown in the enhanced merge images acquired with augmented excitation. The Cys21 mutations do not significantly affect nucleoplasmic NPM levels. Bars represent 20 μm.
Download figure:
Standard image High-resolution imageGood controls are an essential prerequisite for reliable identification of interacting proteins by means of the ccFFS methods. In cross-correlation experiments based in the PIE-ccN&B, we used cells expressing R_NPM_G (table 2) carrying both eGFP and mRFP1 on the same protein as a positive control and cells expressing combination of G_NPM (table 2) with free mRFP1 as a negative control. Confocal images of these controls are presented in figure 2. The eGFP and mRFP1 proteins bound within the R_NPM_G should drift together in the cell nucleus. R_NPM_G was found to be localized both in the nucleus and the nucleolus (figure 2(A)), with weaker preference for the nucleolus compared to the WT NPM (figure 1(A)). The common movement should result in positive value of cross-brightness Bcc obtained by the ccN&B (see equation (2)). For the negative control we used the G_NPM complemented with free mRFP1 expressed from the empty cloning vector. To compensate for higher expression of mRFP1 compared to G_NPM, either cells with lower mRFP1 signal were selected for the experiment or cells were transfected with lower amount of the mRFP1 plasmid.

Figure 2. Dual-color labeling of cells expressing controls for the PIE-ccN&B and labeling of cells expressing the G_NPM/R_NPM mix are tested by microscopy imaging and by flow cytometry; (row A)—Cells expressing the R_NPM_G construct are used as a positive control. Presence of the bi-colored NPM in nucleoplasm is stronger compared to the WT NPM in figure 1. (row B)—Cells expressing G_NPM/R mix serve as a negative control. Free mRFP1 spreads throughout the cell. Co-localization with G_NPM in the nucleoplasm is displayed in the merge image where the G_NPM nucleoplasm localization is enhanced by augmented excitation. Bars represent 20 μm. In C and D, HEK-293T cells co-transfection by red and green fluorescent tags was evaluated by flow cytometry with simultaneous detection of green and red fluorescence. (C)—Flow cytometry data of the cells expressing the R_NPM_G construct exhibit diagonal distribution (○) which shows simultaneous labeling of the cells with both fluorescent tags. Data of cells expressing single tags only, i.e. G_NPM (△) and R_NPM (▽), and background signal of unlabeled cells (□) are included to illustrate thresholding of the dual-color events. The R_NPM_G events are fitted with a polynomial curve. (D)—Events registered for the cells expressing the G_NPM/R_NPM mix (○) are distributed along the polynomial curve fitted to the R_NPM_G events in C. Dual labeling was confirmed also for the NPM_G/R negative control (△).
Download figure:
Standard image High-resolution imageThe dual labeling of cells was verified by flow cytometry (figures 2(C), (D)). Cells expressing the R_NPM_G served as a reference. Since each fused protein carries pair of the flurescent proteins each cell expressing the bi-colored NPM should contain the same amount of eGFP and mRFP1. Indeed, events detected for cells expressing the R_NPM_G lay approximately on a diagonal (figure 2(C)). Additionally, events registered for cells expressing G_NPM/R_NPM mixture (1:1) exhibit broad intensity distribution along a curve fitted to the R_NPM_G events (figure 2(D)). This confirms simultaneous expression of both eGFP- and mRFP1-tagged NPM which is a good prerequisite for successful application of the ccN&B in detection of bi-colored aggregates.
Inhibition of the NPM oligomerization by mutation of Cys21 to Ala or Phe was already reported [16, 25]. To have a possibility to test NPM oligomerization monitoring by the PIE-ccN&B, NPM gene in plasmids for FP-tagged expression was mutated by molecular cloning to provide the Cys21-mutated NPM variants. HEK-293T cells were transfected with 1:1 mixtures of the plasmids to express the WT NPM and the NPM mutants fused either with eGFP or mRFP1. Localization of the two color NPM mutants in cells was verified by the confocal fluorescence microscope compared to WT NPM (figure 1). The WT NPM localizes preferentially to the nucleolus as expected (figure 1(A)). Compromising the oligomerization by the substitutions in the Cys21 should result in delocalization of NPM to the nucleoplasm [31]. However, we observed that all the NPM variants labeled with eGFP or mRFP1 are localized mainly in nucleoli (figures 1(B), (C)). Hence, contrary to the expectations, the Cys21 mutants do not show any signs of delocalization from the nucleolus to the nucleoplasm. The tagged mutants are matching the tagged WT NPM in their localization and nucleoplasma levels. Therefore, the inhibition effect of the Cys21 substitutions on the NPM oligomerization is challenged by these microscopy observations in live cells.
3.2. PIE-ccN&B -based monitoring of the NPM oligomerization
Provided that joint aggregates consisting of both eGFP- and mRFP1-labeled NPM are formed in transfected cells, the aggregates emit green and red fluorescence simultaneously. Therefore, green and red fluorescence signals that originate from double illuminated confocal volume should fluctuate simultaneously in separate detection channels as the two-color aggregates drift in and out the volume. The cross-correlation between the signals can be obtained e.g. from equation (2). The FFS-based methods can see exclusively the oligomerization of the mobile fraction of the NPM, which is a source of the fluctuation in the signal. To eliminate any crosstalk between channels, we collected the data in the PIE mode that enables entire separation of eGFP and mRFP1 signals. The measuring frame of 84 × 82 pixels was positioned in the nucleoplasm to obtain as homogenous distribution of the fluorescence signal as possible. The cross-correlation brightness Bcc was calculated for each pixel in a series of raster images using equation (2). The mean Bcc value was then determined across the whole measuring frame. The controls were used for validation of the PIE-ccN&B protocol in live cells. Typical pixel-based distribution of Bcc in a cell expressing the R_NPM_G construct is demonstrated in figure 3(A). Typical Gaussian fits obtained for the controls and the G_NPM/R_NPM mix are shown in figure 3(B). Results clearly indicate that the distribution of Bcc corresponding to the G_NPM/R_NPM can be found between the distributions corresponding to the positive and the negative controls, being close to the positive one. Mean Bcc values calculated for individual cells of the controls and the G_NPM/R_NPM mix (n = 9 for the R_NPM_G, n = 7 for the G_NPM/R_NPM, n = 4 for G_NPM/R) are shown in figure 3(C). The positive control R_NPM_G and the G_NPM/R_NPM mix are significantly separated from the negative control G_NPM/R. The elevated mean Bcc values calculated for the G_NPM/R_NPM mix point to formation of drifting two-color NPM aggregates.
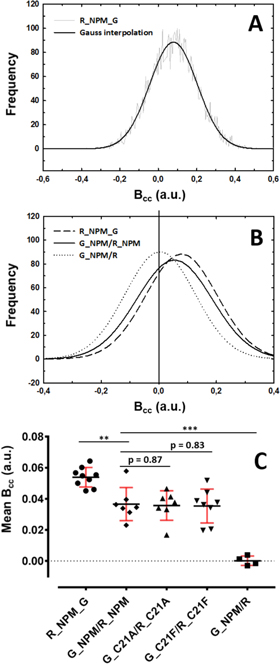
Figure 3. PIE-ccN&B monitoring of the NPM oligomerization; (A)—Typical pixel-based Bcc distribution of the R_NPM_G construct (positive control) in a single cell. (B)—Comparison of typical Gaussian fits of the single-cell distributions acquired for the G_NPM/R_NPM mixture and positive and negative controls. Compared to the negative control G_NPM/R, the G_NPM/R_NPM and the G_NPM_R distributions exhibit significant shift to positive values. (C)—Mean Bcc values acquired for individual cells expressing the two-color mixtures of WT NPM and the Cys21 mutants are compared with respect to the positive and the negative controls.
Download figure:
Standard image High-resolution imageData acquired for the dual labeled Cys21 NPM mutants in the PIE-ccN&B experiments are presented together with data for the WT NPM in figure 3(C). There is no statistically significant difference between Bcc values acquired for the two-color mixtures of NPM mutants and Bcc values of the WT protein mixture (p = 0.83 for C21A and 0.87 for C21F). The points obtained for all mixtures are clearly separated from the negative control G_NPM/R. Also this result undermines the inhibitory effect of the Cys21 substitutions on the NPM oligomerization in live cells.
3.3. FLIM-based monitoring of nucleophosmin oligomerization
We applied FLIM-FRET for tracking donor-acceptor proximity in mixed NPM oligomers to confirm independently the oligomerization of the FP-tagged NPM observed in live cells. The proximity should be manifested by shortening of eGFP fluorescence lifetime since excitation is then transferred from the donor eGFP to the acceptor mRFP1. A typical result obtained measuring cells expressing the G_NPM/R_NPM mix is presented in figure 4. NCL like NPM localizes preferentially into the nucleolus [46]. It exhibits also comparable fluorescence intensities in the nuclei of transfected cells. So NCL was used for comparison with NPM in the FLIM-FRET experiments (figures 4(A), (B)). In FLIM images (figures 4(C), (D)), we can clearly see significant shortening of the eGFP lifetime in cells expressing the G_NPM/R_NPM compared to the G_NCL/R_NCL. Pixel-by-pixel correlation analysis of the FLIM images is shown in figure 4(E). Pixel-based average eGFP lifetime τav is plotted against the corresponding fluorescence intensity. G_NPM/R_NPM τav values are well below G_NCL/R_NCL values. Therefore the G_NCL/R_NCL mix is used as a negative dual-color reference which helps to demonstrate presence of FRET in the case of the G_NPM/R_NPM.
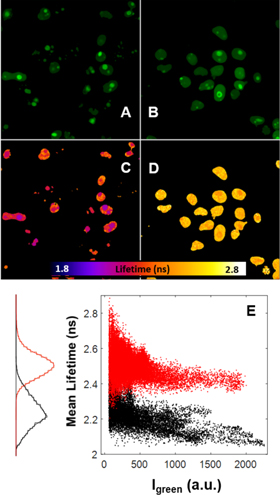
Figure 4. FLIM-FRET monitoring of the NPM oligomerization; Cells expressing G_NPM/R_NPM (A) and G_NCL/R_NCL (B) were imaged in green channel and their fluorescence was analyzed by the fast-FLIM (C), (D). The two-color NPM exhibits systematic shortening of the eGFP lifetime (C) compared to the two-color NCL (D). Pixel-by-pixel correlation analysis of the FLIM images is presented in (E). τav was correlated with fluorescence intensity reflecting eGFP concentration. G_NPM lifetimes (black dots) are significantly below those of G_NCL (red dots). Only pixels with sufficient fluorescence intensities were used for the analysis.
Download figure:
Standard image High-resolution imageAn alternative analysis of the same data is shown in figure 5. Fluorescence decays were averaged across individual nuclei and rigorously analyzed by least-squares reconvolution analysis yielding nucleus-based mean fluorescence lifetime τmean. This analysis confirmed significant shortening of the eGFP lifetime in cells expressing the G_NPM/R_NPM mix compared to control cells expressing G_NPM only, i.e. without presence of the acceptor. eGFP lifetimes observed for the G_NCL/R_NCL reference are even slightly longer compared to the G_NPM control. The absence of lifetime shortening comparable to the G_NPM/R_NPM in the G_NCL/R_NCL case indicates that FP crowding in a dense nucleolus environment does not necessarily mean marked eGFP lifetime decrease due to nonspecific FRET.

Figure 5. Comparison of eGFP fluorescence lifetimes averaged across the whole nuclei; Individual cells expressing the G_NPM/R_NPM mix are compared to those expressing the G_NCL/R_NCL and G_NPM. FRET is demonstrated by shortening of the eGFP lifetime in cells expressing the G_NPM/R_NPM while the G_NCL/R_NCL reference is close to the G_NPM only.
Download figure:
Standard image High-resolution imageFor further confirmation of the FRET, we performed acceptor photobleaching, which is expected to restore the donor lifetime (figure 6). Two similar dual-color G_NPM/R_NPM cells exhibiting shortened eGFP lifetime were imaged. The mRFP1 acceptor in one of the cells was photobleached by a high-intensity laser light (550 nm) (figure 6(A)). The eGFP lifetime was restored from ∼2.2 ns to ∼2.4 ns as seen in the FLIM images (figure 6(B)), which corresponds to the lifetimes presented in figure 5. The pixel-by-pixel analysis of eGFP lifetimes in dependence on acceptor/donor intensity ratio (figures 6(C), (D)) and in dependence on eGFP intensity (figures 6(E), (F)) clearly shows that donor lifetimes and intensities shifted after the acceptor bleaching, which indicates FRET confirming the donor/acceptor proximity. Therefore in accordance with the PIE-ccN&B data, the observed FRET points to proximity of the labeled NPM in hetero-aggregates formed in live cells. We attribute the observed aggregates to the NPM oligomerization expected in live cells.
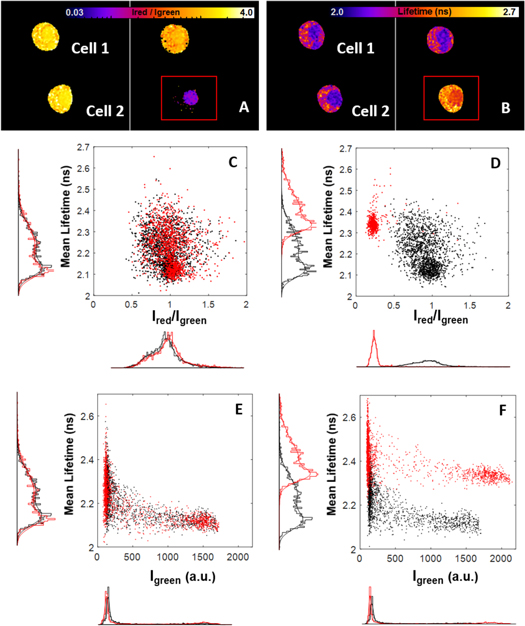
Figure 6. FRET in the G_NPM/R_NPM mix is confirmed by acceptor photobleaching; Two G_NPM/R_NPM cells with similar green and red fluorescence were selected. (A)—The red channel intensity in the Cell 2 was reduced during acceptor photobleaching by a strong 550 nm illumination in the area bordered by the red rectangle. (B) FLIM images of the cells were measured before and after the photobleaching. Pixel-by-pixel correlation between τav and red/green intensity ratio before and after photobleaching (C, D, respectively) and pixel-by-pixel correlation between τav and eGFP fluorescence intensity before and after photobleaching (E, F, respectively) was analyzed. Black and red colors correspond to the Cell 1 and the Cell 2, respectively. τav decreases significantly with increasing Ired/Igreen ratio for both cells prior to photobleaching, which indicates FRET. Then τav shifts to longer values in the Cell 2 after the photobleaching, which is accompanied by increase in the eGFP fluorescence intensity. This indicates successful FRET disruption.
Download figure:
Standard image High-resolution image3.4. Effect of Cys21-mutations on the NPM oligomerization
Having validated the in vivo FLIM-FRET method with the WT NPM, we used it to investigate the influence of the Cys21 substitutions on the NPM oligomerization in live cells. Pixel-by-pixel correlation analysis of FLIM images showed that eGFP lifetimes have similar distribution in cells expressing the WT and the Cys21-mutated NPM (figures 7(A)–(C), respectively). The significant lifetime decrease with increasing donor/acceptor ratio points to FRET in mixed oligomers regardless from what FP-tagged NPM variant the oligomers are formed.
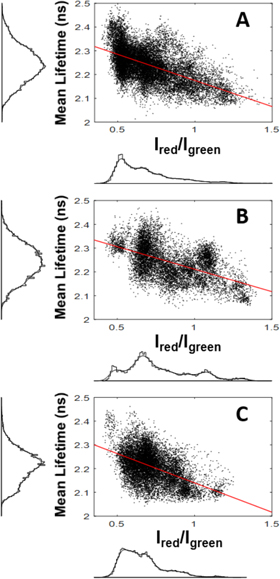
Figure 7. Oligomerization of the Cys21-NPM mutants in live cells observed by the FLIM-FRET; Lifetime correlation plots and corresponding histograms for cells expressing the two-color mixtures of WT NPM (A), NPM-C21A (B) and NPM-C21F (C) are shown. FP-tagged proteins were localized in cells as shown in figure 1. Intensity-thresholded FLIM images were analyzed pixel-by-pixel to correlate τav with the ratio of fluorescence signals registered in the red and the green channel, the Ired/Igreen corresponds to acceptor/donor ratio. Red lines are linear fits visualizing slope in the plots.
Download figure:
Standard image High-resolution imageBoth the FLIM-FRET and the PIE-ccN&B experiments reveal that the Cys21-mutants exhibit oligomerization behavior in vivo similar to the WT NPM. To further support these findings, we applied in vitro co-immunoprecipitation utilizing a pull-down of eGFP-labeled proteins by the GFP-Trap beads [27]. The co-immunoprecipitation can be used for identification of interaction partners of the eGFP-labeled NPM. It should therefore detect endogenous NPM co-residing in the hetero-oligomers.
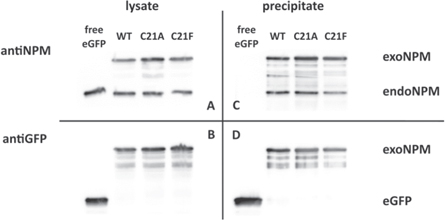
We transfected cells with plasmids for expression of free eGFP, G_NPM, G_NPM-C21A and G_NPM-C21F. The eGFP-labeled proteins are co-immunoprecipitated with their interaction partners (figure 8). The endogenous NPM is detected in each precipitate which points to tight interaction of the native NPM with the G_NPM and with both of the eGFP-tagged Cys21-NPM mutants. No interaction is found in the control sample containing free eGFP. The GFP-Trap proves that the eGFP-labeled NPM is able to form complexes with the endogenous NPM irrespective of the Cys21 mutations, which were expected originally to inhibit the NPM oligomerization.
Figure 8. GFP-Trap assay; HEK-293T cells were transfected with plasmids for expression of G_NPM, G_NPM-C21A and G_NPM-C21F. Cells expressing free eGFP served as a control. Cell lysates were tested for NPM by anti-NPM antibody (A) and for GFP by anti-GFP (B). GFP-pulled immunoprecipitates were tested for the endogenous NPM (C). Free eGFP in control lane and GFP-tagged NPM in other lanes were detected by the anti-GFP antibody (D). Endogenous NPM co-precipitates with all the eGFP-tagged NPM variants indicating formation of hetero-complexes. No NPM is detected in the control lane.
Download figure:
Standard image High-resolution image
4. Discussion
With an aim to study a role of the NPM oligomerization in cell response to cytotoxic drugs and in launching the apoptosis, we apply gentle noninvasive dual-color confocal microscopy techniques, ccN&B and FLIM-FRET, for detection of NPM oligomers. The ccN&B was combined with the PIE to suppress the spectral cross-talk caused by bleeding of the eGFP fluorescence to the mRFP1 detection. However, use of this combined approach meant longer time spent on one pixel (100 μs/pixel) during scanning, which is needed for acquiring a sufficient number of photons to calculate a cross-correlation parameter (Bcc) with lower experimental dispersion. Even after prolonging the dwell time, the number of photons was not high enough to perform brightness-based analysis in both colors, e.g. Bcc plots in dependence on values of one-color brightness corresponding to the green and the red channels [42]. Additionally as mentioned in the Introduction, it is impossible to guarantee single-molecule conditions with standard fluorescent proteins and transfection protocols in live cells, which impedes the proper FFS-based analysis. Moreover, marked photobleaching together with FRET further disqualify the quantitative ccN&B analysis in the herein presented system. Therefore, by using the reliable positive and negative controls, we show qualitatively that the PIE-ccN&B detects reliably joint diffusion of green and red tags residing in mixed aggregates (figure 3).
The PIE-ccN&B experiments are complemented with the FLIM-FRET method to confirm the detection of the FP-tagged NPM mixed aggregates. Shortening of the eGFP lifetime is observed in cells expressing the G_NPM/R_NPM mix. Appearance of FRET is verified by measuring reference not-exhibiting FRET (G_NCL/R_NCL) with very similar cellular expression and localization (figures 4, 5) and by acceptor photobleaching (figure 6). FRET indicates proximity of eGFP and mRFP tags in the mixed aggregates. Therefore, the Bcc elevation indicating joint diffusion observed in the PIE-ccN&B and the eGFP lifetime shortening due to FRET monitored by the FLIM are attributed to formation of oligomers in the G_NPM/R_NPM-expressing cells. The PIE-ccN&B experiments monitored the oligomerization in nucleoplasm where NPM is in a dynamic equilibrium with the nucleolus [30, 59]. In FLIM, the NPM oligomerization was detected both in the nucleoplasm and in the nucleolus.
Having validated the in vivo fluorescence-based methods, we planned to investigate response of these methods to the oligomerization inhibition. Among artificial drugs, NSC348884 was reported to inhibit the NPM oligomer formation [33]. However, massive apoptosis was induced by the NSC348884 concentrations inhibiting the oligomer formation [33], which impeded its use for reduction of the oligomerization. The affected cells detached from the bottom cover glass (our observation) making it inappropriate reference for the dual-color FFS monitoring of oligomerization in the adherent live cells. Moreover, identical drug dosage induces the apoptosis also in peripheral blood lymphocytes of healthy donors (our unpublished results) making it inappropriate for use in cancer treatment. Therefore, we investigated the influence of Cys21 mutations that were also reported to inhibit the NPM oligomerization in vitro [16, 25].
A crucial role of the Cys21 located in the N-terminus of NPM for oligomerization has been suggested by in vitro SDS-PAGE electrophoresis substituting the Cys21 with Ala or Phe [16, 25]. In parallel, preferential localization of WT NPM to the nucleolus was shown to be affected by its oligomerization status. The correlation between the NPM oligomerization and its localization to the nucleolus was postulated using Myc-tagged mutants and immunofluorescence staining [31]. Hence, compromising the oligomerization with the substitutions in Cys21 should lead to delocalization of NPM to the nucleoplasm. Surprisingly, we have not observed the expected delocalization of the NPM-C21A and NPM-C21F FP-tagged mutants. The localization of these mutants was indistinguishable from the localization of the tagged WT NPM (figure 1). This suggests that either the inhibition does not occur or the inhibition does not result in delocalization of NPM to the nucleoplasm.
In agreement with the localization microscopy, the herein presented advanced confocal microscopy methods, the PIE-ccN&B (figure 3) and the FLIM-FRET (figure 7), confirm that the NPM-C21A and the NPM-C21F mutants can reside in joint oligomers under physiological conditions in live cells. All these experiments thus indicate that the Cys21 mutations do not inhibit the NPM oligomerization in live cells. In our laboratory, we came to similar conclusion also in experiments addressing the delocalization of the Cys21 NPM mutants to the cytoplasm driven by interaction with the FP-tagged NPMc+ (data not shown). The NPMc+ induced partial cytoplasmic delocalization of WT NPM [27] but also of the Cys21 mutants. The delocalization indicates that all the investigated variants of NPM interact with the NPMc+ probably in mixed aggregates that facilitate joint drifting inside the cell.
For verification whether the eGFP-tagged Cys21 mutants as well as the WT NPM interact with the endogenous unlabeled protein, we applied in vitro co-immunoprecipitation using the pull down of eGFP-labeled proteins by the GFP-Trap beads [27]. The immunoprecipitation confirms the interaction (figure 8). This result together with the results obtained by the in vivo methods explain why the nucleolar localization of the NPM Cys21 mutants was not compromised in our experiments.
In our opinion, the in vitro SDS-PAGE electrophoresis used for detection of the oligomers in [16, 25] provides information on oligomer instability under rather harsh conditions of the SDS-PAGE. It would not be surprising if the presence of the detergent affects preferentially the stability of the oligomers formed from the mutated NPM. Thus, the electrophoresis can yield biased results on the NPM oligomers formation since the observed instability might have no obvious consequence under the physiological conditions inside live cells.
5. Conclusions
We adopted dual-color methods based on modern fluorescence confocal microscopy, the PIE-ccN&B and the FLIM-FRET, for monitoring of the NPM oligomerization in live cells expressing dual-color NPM. We observed that Cys21 substitutions do not necessarily inhibit the oligomerization under physiological conditions. The results obtained by the in vivo approaches were independently supported in vitro by the GFP-Trap immunoprecipitation assay. Application of the FLIM- and the FFS-based methods for monitoring of the NPM oligomerization is our original innovation and should have deeper consequences in understanding of AML-related cell biochemistry. The in vivo monitoring of potential targets for the anticancer therapy [28, 29] is of high importance and should offer a way to study the effect of targeted anticancer drugs directly in live cells. The approaches presented here should be of general utility in studying oligomerization and interactions of nuclear and nucleolar proteins.
Acknowledgments
This work was supported by the Ministry of Health, Czech Republic, project No. 00023736 (BB, AH) and No. 16-30268A (KK, BB, AH) and by the Czech Science Foundation, project 16-06096S (JS). PH and DG acknowledge EU Operational Program OP VaVpI No. CZ.1.05/4.1.00/16.0340 and Center of Nano- and Bio-Photonics UNCE/SCI/010. MH thanks the Czech Academy of Sciences for the Praemium Academiae award.