


Abstract
Microbial decomposition of thawed permafrost carbon in thermokarst lakes leads to the release of ancient carbon as the greenhouse gas methane (CH4), yet potential mitigating processes are not understood. Here, we report δ13C–CH4 signatures in the pore water of a thermokarst lake sediment core that points towards in situ occurrence of anaerobic oxidation of methane (AOM). Analysis of the microbial communities showed a natural enrichment in CH4-oxidizing archaeal communities that occur in sediment horizons at temperatures near 0 °C. These archaea also showed high rates of AOM in laboratory incubations. Calculation of the stable isotopes suggests that 41 to 83% of in situ dissolved CH4 is consumed anaerobically. Quantification of functional genes (mcrA) for anaerobic methanotrophic communities revealed up to 6.7 ± 0.7 × 10⁵ copy numbers g−1 wet weight and showed similar abundances to bacterial 16S rRNA gene sequences in the sediment layers with the highest AOM rates. We conclude that these AOM communities are fueled by CH4 produced from permafrost organic matter degradation in the underlying sediments that represent the radially expanding permafrost thaw front beneath the lake. If these communities are widespread in thermokarst environments, they could have a major mitigating effect on the global CH4 emissions.
Export citation and abstract BibTeX RIS
1. Introduction
Permafrost contains about 1307 Pg carbon (C), with a substantial amount (450 Pg C; >25% of thaw-susceptible C) found in the Yedoma regions (Walter Anthony et al 2014, Strauss et al 2017). Most of the C is stored in deep layers of undisturbed permafrost soils and organic-rich thermokarst (thaw) lake sediments (Strauss et al 2013, Walter Anthony et al 2014). Thermokarst lakes are estimated to cover 1.3 × 10⁶ km2 and store 102 Pg carbon (Olefeldt et al 2016). In the Northern Hemisphere, thermokarst lakes are hotspots of methane (CH4) emission (Walter et al 2006) through multiple gas transport modes (Sepulveda-Jauregui et al 2015), and are estimated to emit 4.1 ± 2.2 Tg CH4 per year (Wik et al 2016). Emissions from thermokarst lakes are expected to increase five-fold by 2100 (Schneider von Deimling et al 2015, Walter Anthony et al 2018). For better projections of CH4 fluxes from high-arctic thermokarst lakes, we have to understand the molecular processes affecting CH4 during its migration from deeper sediment layers to the atmosphere.
Evidence suggests a portion of CH4 produced in thermokarst lakes is oxidized to the less potent greenhouse gas CO2 prior to emission. A previous study of 30 Alaskan thermokarst lakes showed that aerobic CH4 oxidation takes place in the water column of lakes in the Yedoma region, and is significantly higher in Yedoma lakes than in non-Yedoma thermokarst lakes (Martinez-Cruz et al 2015). Aerobic methanotrophs have also been identified to oxidize CH4 in near surface sediments (He et al 2012, Martinez-Cruz et al 2017). Even though the process of aerobic CH4 oxidation seems to be wide spread in thermokarst lakes, little is known about the responsible microorganisms that control the CH4 mitigation in the oxygenated lake habitats.
Notably, mitigating processes in the form of anaerobic oxidation of methane (AOM) in the deeper anoxic thermokarst lake talik (thaw bulb) sediments have not been previously studied. However, recent findings of AOM-related microorganisms in deep submarine permafrost point towards a potential role in similar habitats (Winkel et al 2018). Hitherto, there is only one study on AOM in permafrost (Winkel et al 2018) besides detection of sequences from anaerobic methanotrophic (ANME) (Kao-Kniffin et al 2015, Shcherbakova et al 2016) in permafrost environments. It is important to understand both aerobic and anaerobic oxidation of methane in this high methane emitting ecosystems to calculate fluxes and completely project C budgets that can be integrate it into new climate models.
AOM in marine environments is commonly performed by (ANME) archaea of the clades ANME-1a/b, −2a/b, −2c, and −3 (Ruff et al 2015). AOM is often coupled to sulfate reduction, hence ANME are found in consortia with deltaproteobacterial sulfate-reducing bacteria of the genera Desulfococcus, Desulfosarcina, or Desulfobulbus (Knittel and Boetius 2009). Beyond marine sediments the occurrence and activity of AOM performed through archaea has mainly been shown in anthropogenic influenced freshwater habitats (Raghoebarsing et al 2006, Vaksmaa et al 2016), while reports for pristine environments are rare (Schubert et al 2011. Gupta et al 2013, Timmers et al 2015, Weber et al 2017). In pristine, terrestrial environments, ANME of the GoM Arc I/AOM-associated archaea/ANME-2d lineage likely perform AOM. Genomes of this cluster originating from Methanoperedens spp. enrichments showed genes for denitrifying-driven (Haroon et al 2013) and iron-driven AOM (Ettwig et al 2016). Marker gene sequences of Methanoperedenaceae were also detected in permafrost environments (Kao-Kniffin et al 2015, Winkel et al 2018), but their activity remains to be proven.
To understand if CH4 mitigation by AOM occurs in proximity of the permafrost thaw front at cold, near-zero temperatures, we sought AOM and the associated organisms by analyzing sediment samples from a depth profile in a well-characterized thermokarst lake, Vault Lake (Heslop et al 2015, Sepulveda-Jauregui et al 2015, Martinez-Cruz et al 2017). Sediment pore water CH4 concentrations and 13C–CH4 ratios were determined along a ∼6 m sediment core, which extended through the talik into the underlying thawing permafrost. Further, we conducted potential AOM rate measurements of sediments using 13C–CH4 isotopic tracer experiments and analyzed the in situ microbial community using 16S rRNA gene sequencing. We quantified anaerobic methanotrophic communities via quantitative PCR of the functional marker gene methyl-coenzyme M reductase, subunit alpha (mcrA) with specific primer for the Methanoperedenaceae cluster (Vaksmaa et al 2017). Additionally, ebullition bubbles emitted from the drilling boreholes and natural ebullition events were collected at Vault Lake and analyzed for CH4 concentrations, isotopes (δ13C–CH4 and δD), and radiocarbon age (14C–CH4).
2. Materials and methods
2.1. Sampling and physicochemical analysis
We collected ca. 6 m core from the center of Vault Lake (65.029 N°, 147.699 W°) during Spring 2013; a detailed description of the sampling procedure can be found in Heslop et al (2015). Studies of potential CH4 production, biogeochemistry and soil organic carbon (SOC) quality from the same core were performed by Heslop and colleagues (2015). Briefly, Vault Lake is a thermokarst lake thought to have formed within the last 400 yr in a Yedoma-dominated region (Heslop et al 2015). Vault Lake is situated in an ecological area of northern boreal forest near Fairbanks, Alaska, USA, characterized by discontinuous permafrost. Limnologically, Vault Lake is considered a small shallow mixotrophic thermokarst lake with an area of 3,200 m2, 3.7 m average depth, slightly alkaline, and black water (Heslop et al 2015, Sepulveda-Jauregui et al 2015). We collected sediment subsamples along the length of the core through the full talik profile, covering five major facies described by Heslop et al (2015): (i) organic-rich mud (0–152 cm), (ii) lacustrine silt (155–330 cm), (iii) taberite (331–508 cm), (iv) most recently-thawed taberite (509–555 cm), and (v) the transitional (thawing) permafrost (556–590 cm). We measured CH4 concentration and δ13C–CH4 in 38 core sediment subsamples. Several sections (20 samples) were used to explore potential AOM. Additionally, a few samples (5 samples) from representative horizons were used to analyze the microbial community via 16S rRNA gene sequencing (table S1 is available online at stacks.iop.org/ERC/1/021002/mmedia). Representative subsamples for each of the 5 different facies were analyzed for possible electron acceptors such as nitrate (detection limit ´dt´ 0.3 μM), nitrite (dt 0.03 μM), and sulfate (dt 1 μM) in pore water. Nitrate and nitrite were measured using a colorimetric technique (Clescerl et al 1999) while sulfate was measured with ion chromatography (ED40, Dionex, USA). We also analyzed sediment samples of a CH4 seep (Doughnut Lake) and a mud volcano (Obrien Pond) to explore how widespread CH4 oxidation communities may be.
2.2. Concentration and stable isotope signatures of CH4 measurements
CH4 concentration and δ13C–CH4 ratios of pore water were measured from duplicate sediment plugs (n = 76) using a 5 ml polyethylene syringes with the end cut off, similar to Hoehler et al (2000). The 5 ml subsamples of sediment were immediately transferred into 20 ml serum vials containing 10 ml of CH4 and CO2-free water, closed with butyl rubber stoppers (Bellco) and aluminum crimp caps, and stored at −8 °C until their gas analysis to prevent oxygen interference.
In the laboratory, we thawed the subsamples at room temperature (21 °C) then vigorously shook each serum vial for 60 s to reach equilibration between the slurry and the gas headspace. Total CH4 concentration in the headspace was promptly measured by gas chromatography with a flame ionization detector (FID, Shimadzu GC-2014). Simultaneously, measurements of δ13C–CH4 ratios were determined by Cavity Ring-Down Spectroscopy (CRDS) using referenced standard of Vienna Pee Dee Belemnite-VPDB (G2201-i, Picarro, precision ±0.55‰ δ13VPDB for CH4) coupled to a Small Sample Isotope Module (SSIM2, Picarro). SSIM2 was used to dilute the headspace samples with Zero Air. We determined CH4 concentrations in the slurry using Henry's law following Sepulveda-Jauregui et al (2012). Henry's law constants for CH4 at 298.15 K (1.4 10−3 mol L−1 Bar−1) and its temperature dependence coefficient (2400 K) were determined according to Sepulveda-Jauregui et al (2012) using NIST database (2014). All CH4 concentrations are expressed in micromolar concentrations.
2.3. Gas composition and isotopes from natural ebullition events and borehole bubbling
We directly collected natural ebullition event gas from both pockets of gas trapped in lake ice and from fresh ebullition events using submerged bubble traps placed near the surface of the water column above ebullition seeps. In addition to collecting gas from natural ebullition events, we collected four samples of free-phase ebullition bubbles emitted from the base of three boreholes drilled through the unfrozen sediments overlying permafrost at three separate locations (from the drilled sediment core, from a borehole directly next to the sediment core and one borehole from the margin of the lake) in Vault lake. These bubble samples rising from the base of the thaw bulb at 5.5, 7.0 and 8.8 m sediment depths in the three boreholes were collected using submerged umbrella-style traps deployed directly below the lake water surface above the boreholes. All bubble gas was collected into 20-ml or 60-ml glass serum vials. CH4 and CO2 concentrations were measured as described previously (Walter Anthony et al 2016). Radiocarbon age of CH4 was determined in a subset of the lake bubble samples by the 14C/12C isotopic ratio of CH4 following methods described previously (Walter Anthony et al 2016).
2.4. Anaerobic oxidation of methane (AOM) stable isotope incubation
We estimated the potential AOM using incubations of core subsamples from 20 depths. Subsamples were diluted (1:1 v/v) in triplicate with sterile, CH4 and CO2-free anaerobic distilled water. Briefly, we transferred 50 ml of the slurry to 100 ml serological bottles under continuous flushing with ultra-high purity (UHP) N2 (Air Liquide, Houston, TX, USA). After 5 minutes of additional flushing, the serological vials were sealed with blue butyl rubber stoppers (Bellco) and crimped with aluminum caps. We injected L-cysteine in each vial to a concentration of 0.025% to reduce anoxic media. Each vial was pre-incubated for five days to ensure the absence of oxygen, which we also confirmed by headspace measurement using a gas chromatograph equipped with a thermal conductivity detector (Shimadzu GC-2014). After pre-incubations, we added 2 ml of 13CH4 (99 atom % 13C, Sigma Aldrich) to the headspace of each incubation vial. We determined potential AOM rates as previously described by (Beal et al 2009, Blazewicz et al 2012). The concentrations of 13C–CH4 were determined from the isotopic fractions and the total CH4 concentration determined by gas chromatography (described in above section). For our calculations, AOM was conservatively determined from 13C–CH4 oxidation. We calculated AOM rates from the linear decrease against time (ca. 200 days) in 13C–CH4.
2.5. DNA extraction, 16S rRNA gene Illumina HiSeq sequencing and analysis
We extracted genomic DNA of 4.7–13 g sediment using procedures described in Zhou et al (1996). Afterwards, we quantified DNA concentrations with Nanophotometer® P360 (Implen GmbH) and Qubit® 2.0 Flurometer (Thermo Fisher Scientific).
Amplification of bacterial and archaeal 16S rRNA genes, were performed separately for a better depth resolution of archaea and have been described previously (Winkel et al 2018). Briefly, we amplified bacteria with the primer combination S-D-Bact-0341-a-S-17 and S-D-Bact-0785-a-A-21. Archaea were amplified with a nested PCR using the primer S-D-Arch-0020-a-S-19 and S-D-Arch-0958-a-A-19 for the first PCR with 40 cycles and S-D-Arch-0349-a-S-17 and S-D-Arch-0786-a-A-20 for the second PCR with 35 cycles, respectively. All PCR conditions can be found in Winkel et al (2018). We pooled 3 individual PCR products per sample to reduce the bias. We pooled equimolar concentrations of PCR products from each sample for the sequencing run. Archaeal and bacterial runs included positive controls (Escherichia coli and Methanobacterium lacus) and negative PCR controls to estimate a sequencing run error.
Sequencing was performed on an Illumina HiSeq 2500 sequencer using the HiSeq Rapid Run 300 bp PE sequencing mode (GATC Biotech, Germany). The library was prepared with the MiSeq Reagent Kit V3 for 2 × 300 bp paired-end reads. To introduce sequence diversity in this low-complexity library, 20% PhiX control v3 library was used.
We used a customized QIIME pipeline to analyze the quality and taxonomic classification of the sequences as described previously (Winkel et al 2018). Briefly, the quality of the sequences was analyzed with the fastqc tool (http://bioinformatics.babraham.ac.uk/projects/fastqc/ by S Andrews). Raw reads of sequences were de-multiplexed and barcodes were removed with the CutAdapt tool (Martin 2011). The subsequent steps included merging of reads using overlapping sequence regions using PEAR (Zhang et al 2014), standardizing the orientation of the nucleotide sequence, and trimming and filtering sequences with low quality by Trimmomatic (Bolger et al 2014). All parameters are the same as described previously (Winkel et al 2018). Subsequently, we clustered sequences into operational taxonomic units (OTUs) at a nucleotide cutoff level of 97% similarity and taxonomically assigned employing the Silva database release 128 (Quast et al 2012) using the pick_open_reference approach of the QIIME pipeline (Caporaso et al 2010). Singletons, chloroplasts and mitochondrial sequences were excluded from the OTU table. Older taxonomic assignments for archaea and bacteria were corrected manually after (Rinke et al 2013, Castelle et al 2015, Adam et al 2017) e.g. Miscellaneous Crenarchaeal Group (MCG) was renamed to Bathyarchaeota. OTUs with relative abundance lower than 0.1% for the individual libraries were not analyzed.
2.6. Quantification of bacterial 16S rRNA genes, ANME-2d mcrA and methanogens mcrA
Diluted DNA (1:1000) was used to eliminate inhibition effects in the quantitative PCR. Quantitative PCR has been described previously (Winkel et al 2018). Briefly, we amplified bacterial 16S rRNA genes, methanogenic mcrA and specific ANME-2d mcrA by primer combinations found in table S2. The PCR reagents and conditions are described in (Winkel et al 2018). For standards we used cloned products of know size and concentrations. Specificity of the PCR products were checked by a melt analysis against products of the standard. The efficiency of the qPCR varied between 90 and 100% and the R2 values of the standard dilutions (5 serial dilutions in triplicates) was 0.996.
2.7. Calculating of CH4 fraction that got oxidized based on 13C–CH4 changes
We used highest changes in stable isotope signatures of dissolved CH4 in the cores to calculate the fraction of produced CH4 that got oxidized (fox,i). Therefore we used equation after Liptay et al (1998):
where δo and δp are the δ13C values (in ‰) of CH4 in different horizons of the taberite layers. αox and αtrans are fractionation factors for AOM and CH4 transport, respectively. Percentage of oxidized CH4 is than calculated. (fox × 100).
We assumed CH4 to be transported mainly by diffusion and therefore used a soil fractionation factor of αtrans = 1.001 after Preuss et al (2013). Different fractionation factors (αox) for AOM in freshwater system were used mainly for sulfate-dependent AOM (αox = 1.031) (Schubert et al 2011), iron-dependent AOM (αox = 1.030) (Norði et al 2013), and nitrate-dependent AOM (αox = 1.032) (Norði and Thamdrup 2014).
3. Results
3.1. Pore water and bubble methane analysis
Radiocarbon dating of CH4-rich bubbles from the borehole that reflects the transitional permafrost (mean CH4: 79.82 ± 24.8%, CO2: 0.81 ± 1.1%) revealed a C age of 21.1 ± 0.08 kyr, in comparison to CH4 of bubbles from natural ebullition events (mean CH4: 73.6 ± 23.1%, CO2: 0.53 ± 0.4%) that showed a mixture of old and young carbon (mean: 9.7 kyr, range 2.2–28.5 kyr table 1).
Table 1. Composition of CO2, CH4 and N2 in gas bubbles and isotopic signatures of CH4.
| Natural ebullition events | Bubbles released from deep boreholes following drilling | |||||
|---|---|---|---|---|---|---|
| mean | stdev | n | mean | stdev | n | |
| CO2 (%) | 0.53 | 0.38 | 35 | 0.81 | 1.12 | 9 |
| CH4 (%) | 73.61 | 23.11 | 35 | 79.82 | 24.79 | 9 |
| N2 (%) | 25.40 | 22.43 | 23 | 12.72 | 8.26 | 5 |
| δ13C CH4 (‰) | −67.67 | 3.42 | 20 | −72.67 | 4.35 | 4 |
| δD CH4 (‰) | −382.90 | 12.43 | 20 | −390.41 | 15.96 | 4 |
| 14C–CH4 (fM) | 0.30 | 0.26 | 9 | 0.07 | 1 | |
| 14C–CH4 (yrs BP) | 9,715 | 2,190–28,500a | 9 | 21,068 | 80 | 1 |
aThe range of 14C–CH4 measurements for natural ebullition events was given to account for the large variability.
δ13C–CH4 and δD-CH4 values of gas bubbles (n = 4) emitted from the base of the drilling boreholes (e.g. transitional permafrost facie) were highly depleted (−72.7 ± 4.4‰ and −390.4 ± 16.0‰, respectively, table 1). Bubbles collected from natural ebullition events showed slightly enriched δ13C–CH4 values (−67.7 ± 3.4‰) but were still highly depleted in δD-CH4 (−382.9 ± 12.4‰, table 1). Mean values are plotting in the mixed zone of microbial methane production (figure S1).
The transitional permafrost, located at the base of the radially expanding talik directly above the thaw boundary, showed the highest in situ sediment pore water CH4 concentrations (mean 134 ± 8 μM) with depleted δ13C–CH4 between −75‰ and −73‰ (figure 1(a)), similar to borehole methane values. The recently-thawed taberite showed a slight enrichment in δ13C–CH4 (−69 to −50‰) and a decrease in CH4 concentration (figure 1(a)). In striking contrast, the taberite layers, located above the recently-thawed taberite, were characterized by large δ13C–CH4 fractionation (−63 to −40‰) and low CH4 concentrations (down to 28 μM, figure 1(a)). Based on the range of AOM fractionation factors (1.030–1.032, Schubert et al 2011, Norði et al 2013, Norði and Thamdrup 2014) reported for freshwater systems, our calculations (Liptay et al 1998) of large isotopic changes (becoming more enriched in δ13C–CH4) - expecting CH4 to diffuse upwards - suggested that 41% to 83% of the in situ CH4 fraction in the taberite and upper recently-thawed taberite layers (311 to 532 cm, figure 1(a)) got oxidized. With a few exception (right above the taberite), CH4 concentration in the lacustrine and organic-rich facie scattered around 43 ± 19 μM with δ13C–CH4 of −65.5 ± 1.8‰ (figure 1(a)).

Figure 1. Pore water CH4 chemistry, AOM rates and archaeal diversity in sediments of the Vault Lake, Alaska, USA. The different colors in panel A and B show the five defined facies by Heslop et al (2015) with blue being organic-rich mud (0–152 cm), red being lacustrine silt (153–330 cm), green being taberite (331–507 cm), yellow being most recently-thawed taberite (508–555 cm) and purple being transitional permafrost (556–590 cm). (A) Methane concentration (white circles) and corresponding δ13C- CH4 values (black circles) are plotted along the depth. Standard deviations of δ13C- CH4 values of methane are based on 6 measurements. (B) AOM rates for 13C–CH4 tracer incubations. Rates are mean rates of triplicates run for approximately 200 days. (C) Relative abundances of archaeal sequences based on 16S rRNA gene from two technical replicates of Illumina HiSeq sequencing. Taxonomic levels are shown from phylum to genus if possible. Abbreviations are as follow: ANME—ANaerobic MEthanotroph, DHVEG—Deep-Sea Hydrothermal Vent Euryarchaeotal Group, MBG-D—Marine Benthic Group D, and MCG—Miscellaneous Crenarchaeotal Group.
Download figure:
Standard image High-resolution image3.2. Potential AOM rates and possible electron acceptors
Our 13C–CH4 tracer incubations showed low AOM rates in the transitional permafrost (∼ 0.9 pmol cm−3 d−1) that doubled in the recently-thawed taberite. Even though potential AOM rates were scattered, we observed the highest rates for the whole core in the taberite layer (up to 2.88 pmol cm−3 d−1; mean 1.7 ± 0.7 pmol cm−3 d−1, figure 1(b)). Potential AOM rates decreased towards the surface of the core but started to increase again above 100 cm, and showed 2.3 pmol cm−3 d−1 in the upper most surface sample (figure 1(b)).
Nitrate concentrations in all taberite layers were below the detection limit (<0.3 μM), and only measurable in the lacustrine and organic-rich facies (39.8 ± 30.5 μM and 58.2 ± 3.7 μM, respectively). Interestingly, the concentration of nitrite increased just above the transitional permafrost (554.4 cm) showing extremely high in situ concentration (∼660 μM) in the transitional permafrost. Sulfate showed extremely high concentration (up to 35 ± 2 mM) in the taberite layers and also showed high concentrations (3 ± 0.2 mM) in the surface facie (table S4).
3.3. Microbial community structure
Microbial community analyses revealed high archaeal diversity (highest invers Simpson 6.33 to 7.90, table S3) at the permafrost thaw front (i.e. transitional permafrost and base of recently-thawed taberite) that cluster together with archaeal community of the surface sediment (figure S2(a)) and included many representative OTUs related to methanogens (Methanosaeta 12%–68%, Methanosarcina 9%–16%, and Methanoregulaceae 3%–18%). The transitional permafrost showed the highest occurrence of Planctomycetes sequences of all bacterial communities (figure 2). Other bacterial sequences fell into dominant taxa of Alphaproteobacteria (Caulobacteraceae, Rhizobiales, Rhodospirillaceae, Sphingomonadace), Betaproteobacteria (Burkholderiales), Saccharibacteria (TM7), Firmicutes (Bacillales), Actinobacteria (Actinomycetales, Acidimicrobiales), and Chloroflexi (Ellin6529). The bacterial communities of the transitional permafrost cluster together with most surface sample (10–20 cm) (figure S2(b)). In contrast to the archaea, the bacterial communities of all taberite layers cluster together (figure S2(b)) and show an increase in taxa of Betaproteobacteria (Rhodocyclaceae/Dechloromonas) and different Firmicutes. For detailed microbial descriptions, please see the supplementary information.

Figure 2. Relative abundance of bacterial sequences based on 16S rRNA gene in the sediments of the Vault Lake, Alaska, USA. Number on the left refer to the exact depth interval in the core. Taxonomic levels are shown from phylum to family if possible.
Download figure:
Standard image High-resolution imageThe archaeal communities of the taberite layer cluster together were almost exclusively represented by ANME-2d sequence of the Methanoperedenaceae (figure 1(c)). Phylogenetic analysis of the Methanoperedenaceae-related OTUs showed an affiliation with two different freshwater clusters (figure 3) mainly comprised of sequences from lake, river, permafrost, iron-rich mat habitats and a Methanoperedens sp. that uses nitrate and iron as electron acceptor (Ettwig et al 2016). Quantification of Methanoperedenaceae (ANME-2d) using specific primers for their functional mcrA, revealed 5.7–6.7 × 10⁵ ± 0.7–1 × 10⁵ copy numbers g−1 wet weight. While bacterial 16S rRNA gene copy numbers in the taberite layer showed similar values (table S2), methanogenic mcrA copy numbers were below the detection limit (<102 copy numbers g−1 wet weight, table S5) and methanogenic 16S rRNA sequencing revealed only poor contribution to the overall archaeal abundance (<0.02%). Additional analysis of a methane seep and a mud volcano from two other lakes revealed a low abundance (∼1%) of Methanoperedenaceae sequences (figure S3).
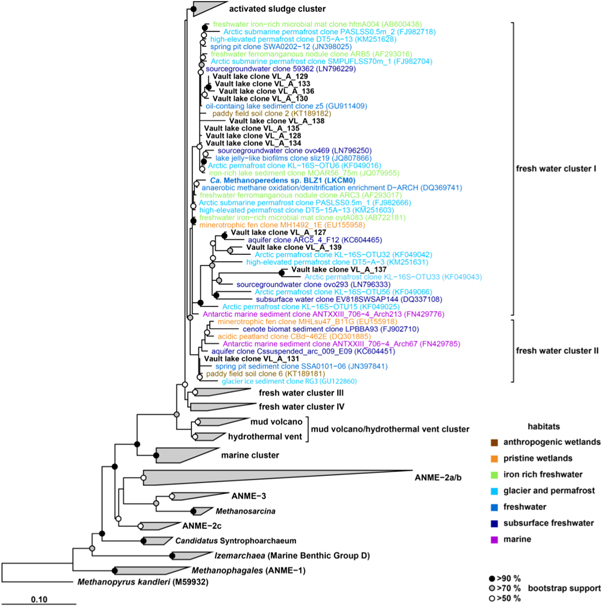
Figure 3. Phylogenetic affiliation of Methanoperedenaceae-related sequences based on 16S rRNA gene. OTUs from the Vault Lake are shown in bold black. Reference sequences are colored coded relating to their detected habitat. Methanopyrus kandleri was used as outgroup. Boot-strap values at inner nodes are given by >90% (black circle), >70% (gray circle), and >50% (white circle). The scale bar represents 10 percent sequence divergence.
Download figure:
Standard image High-resolution image4. Discussion
Vault Lake is a thermokarst lake in the discontinuous permafrost region near Fairbanks Alaska, USA. It is a typical first generation thermokarst lake formed by melting of permafrost ground ice. It has massive ice wedges (figure 4), and steep eroding bluffs and several CH4 seeps that indicate actively deepening. Radiocarbon dating from borehole ebullition clearly reveals a Pleistocene age (∼ 21 kyr) of C–CH4 falling into the typical range of point sources from thermokarst lakes (Walter et al 2007). In contrast, the age of natural ebullition seeps showed a mixture (2 to 28 kyr) of different ages most likely reflecting the production from different aged C sources and, therefore, ebullition from different sediment depths (figure 4) falling into the range of background and point sources (Walter et al 2007).

Figure 4. Schematic of permafrost organic matter degradation and AOM in sediments of the thermokarst lake 'Vault Lake'. The different colors represent the five facies by Heslop et al 2015 : blue = organic-rich mud (0–152 cm), red = lacustrine silt (153–330 cm), green = taberite (331–507 cm), yellow = most recently-thawed taberite (508–555 cm) and purple = transitional permafrost (555–590 cm). Ellipses (brown) show substrates for microbial groups. Rectangles (orange) show microbial processes involved in organic matter degradation and AOM: Ac. Methanogenesis—acetoclastic methanogenesis, AOM—anaerobic oxidation of methane, H. Methanogenesis—hydrogenotrophic methanogenesis, Synt. Fermentation—syntrophic fermentation; Superscript numbers correspond to the following taxa: (1) Saccharibacteria, Actinomycetales, Burkholderiales, and Chloroflexi; (2) Betaproteobacteria (Rhodocyclales), Firmicutes (Clostridiales), Actinobacteria (MB-A2-108, Gaiellales), Bathyarchaeota; (3) Syntrophobacterales, Clostridiales (Ruminococcaceae, Clostridiaceae); (4) Bathyarchaeota (MCG-6); (5) Methanomicrobiales (Methanoregulaceae), Methanocellales (Methanocellaceae); (6) Methanosarcinales (Methanosarcinaceae, Methanosaetaceae); (7) Methanosarcinales (Methanoperedenaceae) and are discussed in the text. The dashed line shows the generalized and simplified trend of AOM rates with depth neglecting really low rates in the taberite. The white circles represent free phase gas bubbles. The light blue/white ellipses in the purple layers represent ice lenses. The transitional permafrost facie is stretched for projecting of degradation processes.
Download figure:
Standard image High-resolution image
Bubbles from the borehole showed highly depleted δ13C–CH4 and δD that point towards biological CH4 production (Whiticar 1999). Even though δ13C–CH4 values indicate hydrogenotrophic methanogenesis, the highly depleted δD values are atypical and might indicate an unusual substrate (e.g. short chain alkanes, Borrel et al 2019), be an effect of higher partial pressure (Bilek et al 2001), or reflect a different methanogenic pathway (e.g. methylotrophic methanogenesis, Sorokin et al 2017). Pore water CH4 from the transitional permafrost, which reflects ice-bearing sediments with a large quantity of unfrozen water in the inter-pore space, had similar δ13C–CH4 values to the borehole ebullition gas. Since the transitional permafrost also showed the highest CH4 concentration, it indicates that this might be a horizon of high in situ CH4 production due to degrading permafrost providing methanogens with substrates. Another possible explanation might be that previously produced CH4 was entrapped during permafrost formation in the Pleistocene and released through thawing. However, based on the cold, dry steppe conditions during Yedoma formation at this site (Heslop et al 2015) and low abundance of methanogens in undisturbed Yedoma sediments (Bischoff et al 2013, Rivkina et al 2016), we interpret the high concentrations of pore water dissolved CH4 to be the result of present-day methanogenesis at the thaw front. The depleted δ13C–CH4 showed similar δ13C–CH4 values (−70.9 to −73‰) to hydrogenotrophic methanogenesis of peatlands (Avery et al 1999, Galand et al 2010, McCalley et al 2014), however, missing δD values from the pore water analysis prevents further interpretation in comparison to methane from the borehole bubbles.
Moving from the transitional permafrost towards recently-thawed taberite, the archaeal community had increasing proportions of methanogens supporting recently found CH4 production in the same sediment layers (Heslop et al 2015). CH4 production occurred most likely from precursors such as acetate and formate as well as H2/CO2. Acetate and formate are known to occur in high concentration in Pleistocene sediments (Strauss et al 2015, Mitzscherling et al 2017), especially in Yedoma regions (Ewing et al 2016). CO2 concentrations measured at the same depth showed values between 120 to 1000 mM (A. Sepulveda-Jauregui, unpublished data). Some bacterial taxa (Planctomycetes and Alphaproteobacteria) in the transitional permafrost, which are often found in peatlands, can be related to aerobic lifestyles and could point to relicts from conditions during the Pleistocene, while many taxa such as Burkholderiales, Saccharibacteria, Myxococcales, Actinomycetales, and Chloroflexi are related to species that are known to anaerobically hydrolyze plant polymers as the first step of organic matter degradation (figure 4). Interestingly, the bacterial communities of the transitional permafrost cluster together with the sample nearest to the surface (10–20 cm, figure S2(b)) that are influenced by fresh organic matter input from lake primary production during summer (Martinez-Cruz et al 2015).
The slight increase in δ13C–CH4 values in the pore water CH4 in the recently-thawed taberite might be due to availability of other substrates such as acetate and could also explain the increase in Methanosaeta (figure 1(c)), which solely uses acetate as substrate (Michał et al 2018). In all taberite layers, we also detected an increase in bacterial groups that are known fermenters (Betaproteobacteria/Rhodocyclaceae/Dechloromonas, Firmicutes/Clostridiales) and syntrophs (Ruminococcaceae, Syntrophobacterales, Clostridiaceae) known to degrade monomers into acetate, hydrogen, carbon dioxide, and formate as precursors for CH4 production (figure 4). Compared to organic decomposition processes in typical active layers (Tveit et al 2012), where fresh material is broken into polymers and monomers and then hydrolyzed and fermented into methanogenic precursors with depth, permafrost organic matter in thermokarst lake talik is decomposed by metabolic processes that occur in the inverse depth order (figure 4). For detailed microbial descriptions, please see the supplementary information.
The taberite facies also showed the most fractionated δ13C–CH4, with enriched CH4 up to 40‰ pointing towards oxidation (Whiticar 1999) and reaching similar values as reported for AOM in other freshwater sediments (Schubert et al 2011, Norði et al 2013, Norði and Thamdrup 2014). Our calculated fraction of CH4 that was oxidized in the taberite facie is consistent with previously reported CH4 measurements and isotopic values from other Alaskan lakes that also assumed CH4 oxidation, but were mainly attributed to aerobic oxidation (Elder et al 2018). Our highest measured potential AOM rates in the taberite suggests this layer is a hotspot for AOM. The archaeal sequence analysis supports this findings as we almost exclusively found Methanoperedenaceae known for nitrate-driven (Haroon et al 2013) or iron-driven AOM (Ettwig et al 2016, Cai et al 2018). To rule out any sequencing artifact, we analyzed the quantity of the functional mcrA, which revealed similar copy numbers to the entire bacterial community and were in the range of river sediments (Vaksmaa et al 2016). Methanogens in this horizon were below the detection limit (<102 copy numbers), even though long-term incubations (>115 days) indicated a reactivation of methanogens (Heslop et al 2015). Measurements for potential electron acceptors revealed no detectable nitrate, in the taberite layers, which might indicate low concentrations in the pore water that could not support AOM or high turnover of nitrate. Interestingly, high nitrite concentrations in the interface of transitional and recently-thawed permafrost could point towards incomplete denitrification of AOM, since Methanoperedenaceae sequences were also found in lower abundances in these layers (figure 1(c)). We also detected unusually high sulfate concentrations in the taberite, while potential sulfate-reducing microorganisms were low in abundance (up to 0.7% relative abundance, data not shown). It is therefore not clear if sulfate is used as electron acceptor coupled to AOM. Other electron acceptors for AOM in freshwater sediments are metal oxides of iron (Weber et al 2017) and manganese that could support Fe(III)-dependent AOM (Ettwig et al 2016, Cai et al 2018). No pore water iron concentration or reactive iron solid phases have been measured for the Vault Lake sediment. However, pore water measurements in other thermokarst lakes showed high Fe(III) concentrations at the thaw boundary (Winkel, unpublished data). Therefore, iron could be involved in AOM by Methanoperedenaceae, as recently been shown (Ettwig et al 2016, Cai et al 2018), and might play a role in deeper sediments (Egger et al 2015).
Potential AOM rates decreased moving towards the surface of the core but started to increase again at 100 cm depth (figure 1(b)), pointing towards a second zone of AOM in near-surface sediments (generalized dashed line, figure 4). AOM activity in surface sediment layers of the Vault Lake was recently ascribed by Martinez-Cruz and colleagues (Martinez-Cruz et al 2017) to an entirely different microbial community, namely aerobic methanotrophs consuming CH4 under anaerobic conditions. Our data support this hypothesis, since we did not find any ANME or NC10 phylum microorganisms (Ettwig et al 2010) that would support a typical AOM community but found low abundances of aerobic methanotrophs (Crenotrichaceae, Methylophilaceae and Methylocystaceae) similar to Martinez-Cruz and colleagues (Martinez-Cruz et al 2017). However, presently undiscovered anaerobic methanotrophs could also be responsible for the second AOM peak. The δ13C–CH4 (mean −65.5 ± 1.8‰) in the lacustrine silt and organic-rich mud facies were similar to the natural ebullition event bubbles, despite a few layers with low (lacustrine silt) or high concentrations (organic-rich mud).
5. Conclusions
We found that AOM occurs in thermokarst lake sediments and mitigates diffusive CH4 emission from these lakes. Previous work suggests that CH4 primarily escapes from talik sediments as bubbles through secondary pore channels (i.e. bubble tubes) (Sepulveda-Jauregui et al 2015). This is largely due to low hydraulic conductivity of the silt-dominated Yedoma sediments, which inhibits diffusion of dissolved CH4 and therefore traps dissolved CH4 in the sediment pore water where it is subject to anaerobic microbial oxidation. As a result, Methanoperedenaceae anaerobically oxidize CH4 at rates similar to other lake sediments (Knittel and Boetius 2009) effectively filtering for dissolved CH4 concentrations despite the near 0 °C temperature conditions. Recent findings on AOM in degrading submarine permafrost that also showed natural enrichments in Methanoperedenaceae-related communities (Winkel et al 2018) support the findings of cold-adapted anaerobic methanotrophic communities. Methanoperedenaceae in thermokarst lakes were mainly found in deep sediment layers and mud volcanos that represents windows to the subsurface (Ruff et al 2018). AOM in thermokarst lake sediments may play an important role in mitigating the release of ancient CH4 as permafrost warms and thaws beneath lakes (Walter Anthony et al 2018). Since our analyses were done on one sediment core and the study lacks certain chemical and physical background data, additional thermokarst lakes need to be investigated in the future to understand if such a mitigation process along the deep permafrost thaw front is widespread. In particular, what kind of electron acceptor is used in the process of AOM should be studied to understand the molecular process in freshwater thermokarst lake environments with many possible electron acceptors such as metal oxides, nitrate and humic acids.
Acknowledgments
We thank Sam Skidmore for granting access to Vault Lake and Anke Saborowski for laboratory support. Funding for M Winkel and K M Walter Anthony was provided by the National Science Foundation ARCSS-1500931. K Martinez-Cruz was funded by Conacyt (Grant no. 330197/233369). The Helmholtz Young Investigators Group of S Liebner is funded by the Helmholtz Gemeinschaft (HGF) (VH-NG-919).
We deposited sequences of the thermokarst lake permafrost metagenome at the NCBI Sequence Read Archive (SRA) with the Project number BioProject ID# PRJNA381521, accession numbers for archaeal 16S rRNA gene sequences were SRX3047230- SRX3047235 and for bacterial 16S rRNA gene sequences were SRX3047223- SRX3047228.