
Abstract
Nabro volcano (13.37°N, 41.70°E) in Eritrea erupted on 13 June 2011 generating a layer of sulfate aerosols that persisted in the stratosphere for months. For the first time we report on ground-based lidar observations of the same event from every continent in the Northern Hemisphere, taking advantage of the synergy between global lidar networks such as EARLINET, MPLNET and NDACC with independent lidar groups and satellite CALIPSO to track the evolution of the stratospheric aerosol layer in various parts of the globe. The globally averaged aerosol optical depth (AOD) due to the stratospheric volcanic aerosol layers was of the order of 0.018 ± 0.009 at 532 nm, ranging from 0.003 to 0.04. Compared to the total column AOD from the available collocated AERONET stations, the stratospheric contribution varied from 2% to 23% at 532 nm.
Export citation and abstract BibTeX RIS

Content from this work may be used under the terms of the Creative Commons Attribution-NonCommercial-ShareAlike 3.0 licence. Any further distribution of this work must maintain attribution to the author(s) and the title of the work, journal citation and DOI.
1. Introduction
The injection of SO2 due to volcanic eruptions is the biggest natural source of perturbations in the stratosphere (Robock 2000). SO2 converts to sulfuric acid which will quickly condense, forming fine sulfate aerosols in the stratosphere. These aerosols have longer residence times (1–3 yr) compared to ash and tropospheric sulfate aerosols (typically days and weeks respectively). Explosive eruptions like Pinatubo in 1991 are the proof of how such events can impact our climate and the global temperature at the surface (McCormick et al 1995).
Due to their extended residence time once injected into the stratosphere, these particles can travel large distances. Global monitoring of the stratosphere is, therefore, of great importance. In particular, ground-based lidar techniques have already been demonstrated to be a powerful method since 1974 (McCormick and Fuller 1975, Shaw 1975, Wandinger et al 1995, Di Girolamo et al 1996).
Lidar observations can be even more meaningful when carried out in coordinated networks as they are fundamental to the study of aerosols on a large spatial scale. This is especially true in cases of aerosol transport and modification phenomena that are relevant for climate and risk management purposes, like in the case of air traffic safety in the event of major volcanic eruptions.
Regardless of the source, the optical properties of stratospheric aerosols must be properly quantified. If neglected, the pertubations caused by these particles can represent an error source in lidar measurements of trace gases in the stratosphere and also in comparative studies of column-integrated versus ground-based measurements such as the DISCOVER-AQ project described in section 4. In fact, it was during DISCOVER-AQ that the stratospheric layers over Maryland, USA were first noticed, which then led to a more comprehensive analysis of the event, finally culminating in this letter.
The changes in the background stratospheric aerosol load, even in the absence of major volcanic eruptions, is the subject of an ongoing debate. Hofmann et al (2009) reports a yearly increase of 4–7% in the aerosol backscatter between 20 and 30 km since 2000 as measured by lidars in Mauna Loa, Hawaii and Boulder, Colorado. From the three main sources of stratospheric aerosol load, i.e. volcanic emissions to the stratosphere, increased tropical upwelling and increase in anthropogenic SO2, the latter case seems to be the most likely cause for the increase. However, there are also indications that smaller volcanic eruptions have more impact in the background stratospheric aerosol load than previously thought (Vernier et al 2009, 2011) and Solomon et al (2011) points out from the CALIPSO record that the so-called stratospheric background seems to be, in general, affected to some extent by volcanic emissions over the last decade.
In this letter we report synergistic measurements from multiple lidar networks and satellite CALIPSO to track the evolution of stratospheric aerosols in the Northern Hemisphere, originating from Nabro's eruption that occurred in Eritrea on 13 June 2011. The particles remained in the stratosphere for months following the eruption. According to satellite (CALIPSO and OMI) records from the months pertaining to this study, the stratospheric signatures here reported were all due to Nabro's eruption, with a couple of exceptions that are discussed further in this letter.
1.1. Nabro volcano, Eritrea
Nabro is a stratovolcano located in the Afar Triangle at the border between northeastern Ethiopia and southern Eritrea. It is a 2218 m high volcano, the highest in the Afar Triangle, sitting at the triple junction between the Arabian, Somalian and Nubian tectonic plates along the East African Rift Zone (Wiart and Oppenheimer 2005).
Nabro's first ever recorded eruption occurred on 13 June 2011 when it spewed copious amounts of ash disrupting the air traffic in Eastern Africa. According to reports from the Smithsonian's Global Volcanism Program (SGVP 2011), after a series of moderate earthquakes struck the region in the evening of 12 June, Nabro started erupting between 0300 and 0500 EAT (East Africa Time=UTC+3 h), with visible plumes rising up to an altitude of 13 km consisting mainly of water vapor and sulfur dioxide gas. Preliminary analysis from the Ozone Monitoring Instrument (OMI) suggested an SO2 release of approximately 1.3 Tg in the first few days (Carn 2011, Krotkov et al 2011) and retrievals from the Infrared Atmospheric Sounding Interferometer (IASI) later indicated a 1.5 Tg load of SO2 (Clarisse et al 2012). Scattered sunlight measurements from the limb-scanning Optical Spectrograph and Infra-Red Imaging System (OSIRIS) shows that Nabro caused the largest stratospheric signature ever measured by this instrument (Bourassa et al 2012).
Weaker eruptions from Nabro continued to be detected by the Toulouse Volcanic Ash Advisory Center (VAAC) until mid-July and the latest activity prior to submission was reported in late September.
1.2. Measurements
Laser remote sensing, i.e. lidar, is an indispensable tool to help assess the vertical distribution of aerosol in the atmosphere. Space-borne lidar, like the Cloud–Aerosol Lidar with Orthogonal Polarization (CALIOP) onboard CALIPSO (Cloud–Aerosol Lidar and Infrared Pathfinder Satellite Observations) (Winker et al 2003), has a narrow swath and therefore does not provide complete global coverage. To fill those gaps in terms of spatial coverage, networks of ground-based lidars such as EARLINET, MPLNET and the Network for the Detection of Atmospheric Composition Change (NDACC) are of extreme value.
The Micro-Pulse Lidar Network (MPLNET) (Welton et al 2001) is a global network of low power lidars providing long-term observations of aerosol and cloud properties. MPLNET data usually requires a correction for the overlap function in the 0–6 km range to account for losses in the near-field receiver efficiency (Berkoff et al 2003). However, all data from MPLNET in this study were in the stratosphere (10–20 km) and therefore, no corrections were needed in that respect. Also, most MPLNET stations are collocated with AERONET (aerosol robotic network) (Holben et al 1998) sites that provide column-integrated properties of aerosols and clouds. The European Aerosol Research Lidar Network (EARLINET), established in 2000 (Bösenberg et al 2003), is presently composed of 27 stations operating simple elastic and Raman lidars as well as advanced multiwavelength lidar systems all over Europe. The Network for the Detection of Atmospheric Composition Change (NDACC) is composed of more than 70 remote sensing research stations with observational capabilities which include lidars, spectrometers, microwave radiometers and ozone and aerosol sondes.
The observations described here are from CALIPSO, MPLNET, EARLINET, NDACC and from the Key Laboratory of Atmospheric Composition and Optical Radiation in Hefei, China, spanning from 14 June until early September, 2011. All lidar stations in this study that observed stratospheric plumes are listed in table 1 and figure 1 shows the temporal and zonal distribution of the observations. Santa Cruz de Tenerife, Kanpur, Trinidad Head, Sede Boker and Goddard Space Flight Center (GSFC) are all MPLNET stations. Universidad de Granada, Universitat Politècnica de Catalunya (UPC), Istituto di Metodologie per l'Analisi Ambientale (CNR-IMAA) are EARLINET stations. Mauna Loa Observatory (MLO) and Observatoire de Haute-Provence (OHP) are members of NDACC.
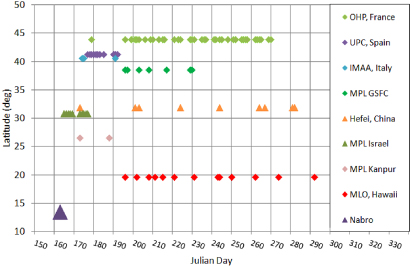
Figure 1. Zonal and temporal distribution of lidar observations from June to October, 2011. Nabro marker represents the location and eruption date.
Download figure:
Standard imageTable 1. Lidar systems description.
| Location | (Lat, Lon) | Elevation (a.s.l.) | System |
|---|---|---|---|
| Sede Boker, Israel | (30.85°N, 34.78°E) | 480 m | MPL @ 523 nm |
| Santa Cruz de Tenerife (Canary Islands) | (28.47°N, 16.25°W) | 52 m | MPL @ 523 nm |
| GSFC, MD, USA | (38.99°N, 76.84°W) | 50 m | MPL @ 527 nm |
| Trinidad Head, CA, USA | (41.05°N, 124.15°W) | 107 m | MPL @ 527 nm |
| Kanpur, India | (26.52°N, 80.23°E) | 150 m | MPL @ 532 nm |
| UPC, Barcelona, Spain | (41.39°N, 2.11°E) | 115 m | Nd:YAG @ 3λ0a +Raman @ 2λN 2b |
| Granada, Spain | (37.16°N, 3.61°W) | 680 m | Nd:YAG @ 3λ0a +Raman @ 2λN 2b |
| MLO, HI, USA | (19.54°N, 155.58°W) | 3397 m | Nd:YAG @ 1064 and 532 nm |
| CNR-IMAA, Potenza, Italy | (40.60°N, 15.73°E) | 760 m | ND:YAG @ 3λ0a +Raman @ 2λN 2b |
| Hefei, China | (31.9°N, 117.2°E) | 30 m | Nd:YAG @ 532 nm |
| OHP, France | (43.93°N, 5.71°E) | 650 m | DIAL @ 355 nm |
aElastic channels at 1064, 532 and 355 nm. b N2 Raman channels at 387 and 607 nm.
2. Timeline of the observations
Backtrajectories were run for each lidar observation using the Hybrid Single Particle Lagrangian Integrated Trajectory model (HYSPLIT—Draxler and Rolph 2012, Rolph 2012) to confirm whether or not the stratospheric layers observed were due to Nabro's eruption. Forward trajectories were also run from Nabro's location to assess the airmass transport during the days immediately following the eruption. All HYSPLIT trajectories were computed using GDAS Meteorological Data, vertical velocity model for vertical motion and maximum run time of 300 h.
The forward trajectories were run from 13 June 00 UTC at altitudes ranging from 16 to 21 km in 1 km increments. The lower airmasses at 16 and 17 km (red and blue lines, respectively) followed an anticyclonic circulation centered over the Middle East. The intermediate airmasses at 18 and 19 km (green and light blue lines, respectively), while also following an anticyclonic pattern, extended farther East as can be seen in figure 2. Sede Boker, Kanpur and Hefei were all in very close proximity to the forward trajectories. The airmasses at 20 and 21 km (yellow and black lines, respectively) traveled westward towards the Atlantic Ocean and the continental US.
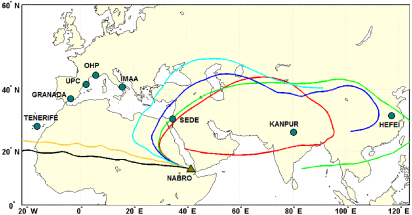
Figure 2. Forward trajectories from Nabro starting on 13 June 2011 at 00 UTC at 16 km (red), 17 km (blue), 18 km (green), 19 km (light blue), 20 km (yellow) and 21 km (black).
Download figure:
Standard imageThe circulation pattern observed in the forward trajectories is due to the Asian summer monsoon circulation which is characterized by a strong anticyclonic vortex in the upper troposphere and lower stratosphere (UTLS) over Asia and Middle East. This anticyclone has been linked to rapid vertical transport of pollution from the surface deep into the stratosphere (Randel et al 2010). In regions surrounding the Tibetan plateau (TP) (which acts as an additional elevated atmospheric heat source at an average altitude of about 4000 m) enhancement of the upward transport of water vapor to the local lower stratosphere has been observed which also helps the development of the aforementioned upper level anticyclonic circulation during the summer season (Wright et al 2011, Wu and Zhang 1998).
Sede Boker MPL in Israel (NE of Nabro) observed the first layers on 14 June between 15 and 19 km of altitude. It also observed distinct layers on 17 June, 23 June and residual layers could be observed until early August. West of Nabro, in the Canary Islands, lower layers (10–13 km) were observed over Santa Cruz de Tenerife on 21 June and from 26 June to 30 June from 15 to 20 km with some stratification. On 22 June the MPL in Kanpur, India (East of Nabro) observed a layer at 19 km of altitude.
In Europe, the first layers were reported on 23 June over Potenza, Italy (CNR-IMAA) at 16 km. A coincident CALIPSO overpass confirmed the layer presence at 16 km of altitude over Italy extending all the way to Southern Nigeria (7.00°N, 6.85°E). CNR-IMAA continued to observe residual signature until late August. In Spain, a layer between 16 and 17 km was first observed over Granada (SE Spain) on 26 June and then in Barcelona (NE Spain) at 17 km. Weak signatures were observed over Granada until 11 July. Over southern France layers were observed from 28 June to 2 July and then again, although with weaker signals, from 15 July until late August. Backtrajectories from the lidar stations in Europe and Asia are presented on figure 3.

Figure 3. Backtrajectories for all sites with exception of the ones located in the United States. The start time and altitudes denoted by each set of red, blue and green lines varies according to the date/time and altitudes of the first stratospheric layers observed by the lidar groups participating in this study.
Download figure:
Standard imageOver the US, to the best of our knowledge, the first layer was observed with a MPL system located at that time at Fairhill (39.70°N, 75.86°W—NE Maryland) on 14 July between 15 and 16 km of altitude and also in the West Coast in Trinidad Head, CA between 13 and 14 km. On 15 July the layers were observed higher, between 17 and 19 km over GSFC with the strongest signature on 22 July and sparse residual signature remaining until mid-August. In MLO, HI, layers were first observed also on 15 July, with the strongest signature on 21 July. A very close CALIPSO overpass on that day showed the plume at 19 km of altitude over the Pacific extending longitudinally for over 2500 km. Figure 4 shows five day averages of scattering ratio profiles in the stratosphere at 532 nm from CALIOP measurements beginning on 17 June 2011 until 16 August. It shows how the layer progressed over the eastern US, indicating a small first perturbation on 7 July between 17 and 18 km that seem to have slightly descended closer to 15 km between 12 July and 17 July, agreeing with the first observation at Fairhill, MD.

Figure 4. Five day averages of CALIOP profiles over the eastern US from 17 June to 16 August—legend in Julian Days.
Download figure:
Standard imageIn Hefei, China, the first and strongest layer was observed on 22 June at 16 km. Later measurements indicated a weaker stratospheric signature on 20 July and the second strongest on 22 July.
3. Stratospheric AOD from lidar data
Depending on the lidar technique utilized, both backscattering and extinction coefficients due to aerosols can be obtained independently of each other, e.g. using the Raman and High Spectral Resolution Lidar (HSRL) techniques, or related to each other by a range-independent extinction-to-backscatter ratio (or lidar ratio, S, in units of steradian—sr) assuming layer homogeneity, e.g. elastic backscatter lidars using Klett–Fernald technique (Klett 1981, Fernald et al 1972) and variations thereof. Many lidar stations participating in this study have Raman lidar capabilities but most of the AOD values here presented were obtained from elastic measurements. The Klett–Fernald method for the case of stratospheric aerosols is able to provide satisfactory results given an assumed value for S. Mattis et al (2010) reported S values in the range of 30–60 sr at 355 nm and 30–45 sr at 532 nm in the stratosphere due to volcanic aerosols measured between 2008 and 2009 over central Europe with a multiwavelength Raman lidar.
The mean S value of 50 sr at 532 nm was assumed by most groups in this study, including MLO, UPC and also in the CALIOP retrievals, with exception to Granada group which assumed values of 45 sr @ 355 nm and 38 sr @ 532 nm—the average S from the ranges reported by Mattis et al (2010). CNR-IMAA was the only group to measure S values utilizing the Raman technique. They measured S values of 48 and 55 sr at 532 and 355 nm, respectively. The lidar ratio values assumed/measured by each group and the respective AOD values obtained from each profile are summarized in table 2.
Table 2. AOD values calculated from the profiles shown on figure 6 (layers) and AERONET colocated measurements of AOD (total column). Subscripts CAL and AERO refer to CALIOP and AERONET, respectively.
| Location | S355 (sr) | AOD 355 | S 532 (sr) | AOD 532 | AOD CAL | AOD AERO |
|---|---|---|---|---|---|---|
| Sede Boker | — | — | 50 | 06/14: 0.17 | 0.012 | 0.33 |
| Tenerife | — | — | 50 | 06/29: 0.019 | — | 0.30 |
| GSFC | — | — | 50 | 07/15: 0.003 | 0.007 | 0.18 |
| — | — | 07/22: 0.008 | — | 0.44 | ||
| Trinidad | — | — | 50 | 07/17: 0.02 | 0.010 | — |
| Kanpur | — | — | 50 | 07/07: 0.015 | 0.018 | — |
| UPC | — | — | 50 | 06/27: 0.04 | 0.012 | — |
| Granada | 45 | 06/26: 0.05 | 38 | 06/26: 0.02 | 0.012 | @500: 0.32 |
| — | @340: 0.42 | |||||
| MLO | — | — | 50 | 07/15: 0.01 | 0.008 | 0.015 |
| — | — | 07/21: 0.022 | — | 0.05 | ||
| — | — | 08/31: 0.011 | — | 0.04 | ||
| CNR-IMAAa | 55 ± 18 | 06/24: 0.04 | 48 | 06/24: 0.03 | 0.010 | @500: 0.11 |
| — | @340: 0.19 | |||||
| Hefei | — | — | 50 | 06/22: 0.023 | — | — |
| — | — | 07/20: 0.011 | — | — | ||
| — | — | 07/22: 0.023 | — | — | ||
| — | — | 08/12: 0.010 | — | — | ||
| OHP |
 b = 53 ± 6 b = 53 ± 6 |
28 June: 0.04 | — | — | 0.012 | 0.24 |
 : 0.013 ± 0.007 : 0.013 ± 0.007 |
— | — | — | 0.20 | ||
 : 0.022 ± 0.005 : 0.022 ± 0.005 |
— | — | — | 0.20 | ||
 : 0.029 ± 0.006 : 0.029 ± 0.006 |
— | — | — | 0.28 |
Figure 6 shows the scattering ratio profiles obtained from lidar measurements pertinent to this study. The scattering ratio (SR) is defined as the ratio between the total backscatter (due to molecular and aerosol contributions) and the molecular backscatter which can be calculated from radiosonde measurements of pressure and temperature or from standard atmosphere models. In the absence of aerosols, SR = 1. The aerosol backscatter profiles for the MPLNET stations in this study were retrieved from the MPLNET level 1 normalized relative backscatter (NRB) product. One hour averages of NRB profiles from nighttime measurements were used to avoid signal-to-noise issues due to residual background light. The aerosol layer is isolated by assuming an aerosol-free atmosphere under and over the layer and the aerosol backscatter profile is then obtained using an iterative method. The algorithm utilized for the retrievals of aerosol backscatter profiles from MPL data in this study was developed independently from the MPLNET retrieval algorithms. The AOD values obtained from MPLNET data are the product of the integrated backscatter coefficient in the aerosol layer with a range-independent S = 50 sr.
OHP (Godin-Beekmann et al 2003) utilizes the DIAL (Differential Absorption Lidar) technique. For this type of system that focuses on stratospheric ozone measurements, it is important to assess the errors due to the presence of volcanic aerosols. The Klett–Fernald technique is used to obtain the optical depth from the 355 nm Rayleigh signal, using a height-dependent S profile derived from an ensemble of measurements of aerosol size distributions performed on March 2010 in Laramie, WY (USA) by Deshler et al (1993). The mean S value between 10 and 25 km was 53 ± 6 sr.
In terms of CALIOP data, the stratospheric aerosol information is retrieved based on an averaging technique combined with a calibration correction and a cloud filtering as described by Vernier et al (2009). Figure 6(d) shows averaged CALIOP scattering ratio (SR) profiles at 532 nm from the closest CALIPSO overpasses to the ground lidar stations, i.e. within five days of the observation dates at the lidar stations and within 60° in longitude and 15° in latitude from their locations. Table 2 lists the AOD at 532 nm obtained from each of these profiles under AODCAL and those values are systematically smaller than AOD532, retrieved with the ground-based lidar systems. As previously mentioned, CALIOP has a very narrow swath, thus precise overpassses with respect to a ground-based station are scarce. The larger discrepancies observed between AODCAL and AOD532 are therefore, most likely due to the non-colocated nature of the observations.
Figure 7 shows the mean aerosol optical depth (AOD) over the entire globe retrieved from CALIOP measurements at 532 nm from 16 July to 31 July. The AOD was retrieved only in the stratosphere between 12 and 20 km which gives an estimate of the contribution of Nabro's volcanic aerosols to the global AOD. Values approximately between 0.012 and 0.03 were observed over most of southern Europe and all over Asia, branching out over the Pacific and towards the West Coast of the US. Although most of the sulfate aerosols due to Nabro's eruption were observed east of Nabro's location, figure 7 shows slightly elevated values of AOD crossing the Atlantic towards the East Coast of the US, which is consistent with the backtrajectories discussion from section 2. It should be noted that CALIOP data was not available from 7–14 June.
4. Stratospheric contribution to total column AOD
AOD measurements from colocated AERONET stations were available for most lidar stations in this study. As mentioned earlier, retrievals of extinction and backscatter coefficients from elastic lidars require an assumption of range-independent lidar ratio. Colocated measurements of AOD can also be utilized as an additional a priori information for retrievals in the lower troposphere. When most of the aerosol load is confined to the lowest troposphere, which is often the case, the AOD can be used as a boundary condition to obtain the best estimate of lidar ratio, since AOD is, by definition, the integral of the extinction profile. However, in the presence of aerosol layers aloft AERONET AOD values will not only represent the tropospheric contribution but also that of the layer.
Most lidar data in this study were obtained at nighttime when no sunphotometer measurements are available. Therefore, to estimate the stratospheric AOD contribution to the total AOD as measured at the colocated AERONET stations, a linear interpolation was considered between the last data points from the day before and the first data points from the day when the layers were observed. Only the last/first 3–5 data points of each day were considered in the interpolation and we utilized the AOD values at 340 nm and 500 nm to compare with the measurements at 355 nm and 532 nm, respectively. The interpolated values of AOD are presented in table 2 as AODAERO. In Santa Cruz de Tenerife the contribution of the stratospheric AOD to the total AOD was about 6%, 2% at GSFC, 12% and 5% in Granada for 355 nm and 532 nm respectively, 22% and 23% at CNR-IMAA for 355 nm and 532 nm respectively. At OHP for the 28 June case the contribution was of 17% at 355 nm and for the monthly averages the contributions were of 6%, 11% and 10% for July, August and September, respectively. At MLO, due to the site's high elevation (∼3 km), the contributions were even larger: 65%, 48% and 26% for 15 July, 21 July and 31 August, respectively.
Determining the optical contribution of the stratospheric layer to the total column AOD was of particular interest at the GSFC site in Maryland, United States. The DISCOVER-AQ project (DISCOVER-AQ 2011, Hoff et al 2012) is a five-year experiment to help improve our understanding in relating column observations to surface conditions for aerosol and trace gases for air quality assessment and regulation. The first experiment took place in the Baltimore–Washington DC corridor in July 2011 and involved many ground-based lidars, sunphotometer and two aircraft that carried out in situ measurements of aerosol and trace gases and also provided nadir-looking lidar profiles up to an altitude of ∼6 km with an HSRL system. During the project, an offset of approximately 0.03 was observed between the AOD values obtained from the HSRL system and the AOD measured by the ground-based sunphotometers (Ferrare et al 2011). Aerosol contribution from altitudes higher than 6 km was believed to be the source of such offset. With this study, we were able to explain at least 0.01 of the offset observed, but Nabro is not likely to be the major factor in this disagreement.
5. Discussion
The MPL profile over Sede Boker (14 June) was the first available profile after Nabro's eruption. It showed the strongest peak in terms of backscatter compared to the other profiles, as displayed in the subplot of figure 6(a) and the highest AOD of 0.17—a 51% contribution to the total AOD. Given the short time between Nabro's first explosive eruption and the first observation at this site, we believe that the layer could be composed of ash and sulfate aerosols. Due to their size compared to sulfate aerosols, ash particles are quickly removed from the stratosphere, which might explain the difference in scattering magnitude from this measurement and all the other measurements from June 2011, which were, most likely, measurements of sulfate aerosols only.
With respect to the source of the layers observed over Santa Cruz de Tenerife on 21 June between 10 and 13 km, backtrajectories (not shown here) suggested long range transport of smoke particles from fires that were occurring in North America in that period. However, given the date and location of observation, one cannot exclude the possibility of contributing ash/sulfate particles from smaller eruptions that followed the major one on 13 June. The AOD obtained for that layer was 0.022, a 5% contribution for the total AOD of that day (0.4 at 500 nm). Unfortunately there were no additional measurements, such as depolarization measurements that could help us determine whether or not ash particles were present in this case. The backtrajectories for 29 June case as shown in figure 3 confirmed Nabro as the source of the layer observed.
Over GSFC, it is interesting to note that the layers observed on 15 July and 22 July over GSFC apparently were transported from different directions. In figure 5 we can see that the layers observed in GSFC (dashed lines) and Trinidad Head on 14–15 July came from the North Pacific Ocean crossing through high latitudes (∼50°N). However on 22 July, the airmass observed at 17.5 and 18 km (blue and green lines, respectively) over GSFC originated from long range transport through the Atlantic, similar to the transport pattern observed for MLO at 17–19 km on 15 July.
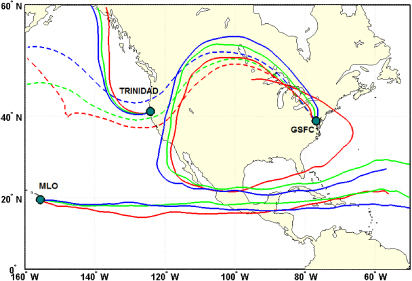
Figure 5. Backtrajectories from GSFC on 15 July and 22 July, Trinidad Head on 14 July and MLO on 15 July.
Download figure:
Standard image
Figure 6. Scattering ratio (SR) profiles from MPLNET (a), EARLINET (b), NDACC and Hefei stations (c) and from CALIPSO's closest overpass to the lidar stations (d). Subplot in (a) represents the SR profile obtained in Sede Boker, Israel. Please note that different scales are used in the subplot of (a) and also in (b).
Download figure:
Standard image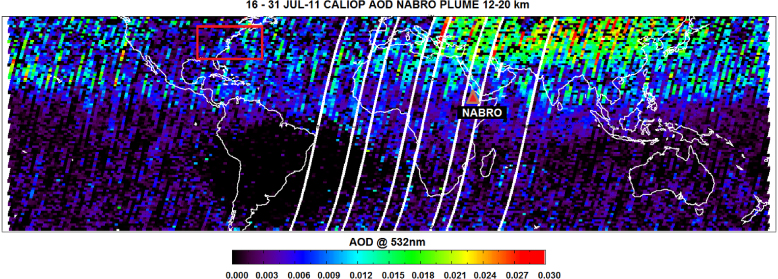
Figure 7. Global CALIOP AOD retrieval from 16 July to 31 July.
Download figure:
Standard imageOn 21 July and 22 July, a similar layer structure was observed in MLO and Hefei, respectively. Figure 6(c) shows that both locations measured two layers in the stratosphere (at ∼13 and 18 km). The backtrajectories from MLO, as shown in figure 5 indicate that the first layers observed at that location were transported through the Atlantic Ocean and across Central America. Figure 7 shows, however, elevated AOD over the Pacific, towards MLO's location, indicating that MLO also observed layers that were transported from opposite directions.
In terms of S values, most groups assumed a value of 50 sr at 532 nm. In Sede Boker's case (14 June) this assumption may not be truly representative if a mix of ash/sulfate was indeed present in the stratosphere. Unfortunately there are not many reports on S values measured from ash particles in the stratosphere due to their relatively short residence time. Pappalardo et al (2004) reported a S value of 55 sr at 355 nm in the lower troposphere and Ansmann et al (2001) reported S values of 50 sr for ash and 40–80 sr for non-ash (fine mode) at 532 nm also in the lower troposphere. One cannot assume however, that those same S values would apply in the stratospheric case since both layers are characterized by completely different dynamics and water vapor content which could greatly influence the S values in cases when hygroscopic aerosols, e.g. sulfates, can be found in the mixture.
6. Conclusion
Ground-based lidar networks are specially valuable during large scale events like long range transport of dust and smoke or major volcanic eruptions. In an effort to facilitate knowledge and data exchange between lidar groups, the Global Atmosphere Watch (GAW) Aerosol Lidar Observation Network (GALION) was formed envisioning the cooperation among existing lidar networks and also independent research institutes that carry lidar measurements across the globe.
The Icelandic volcano Eyjafjallajökull which erupted in 2010 was probably the most important case study to date in terms of large scale synergistic lidar observations. Shortly after the eruption, while airspace was closed for commercial flights, airborne lidar and in situ measurements were carried out in the vicinity of the volcano (Schumann et al 2011) and ground-based lidar stations from the European Aerosol Research Lidar Network (EARLINET) observed volcanic aerosol layers all over Europe (Pappalardo et al 2010, Marenco et al 2011, Ansmann et al 2010, Emeis et al 2011, Sicard et al 2012, Papayannis et al 2012, Mattis et al 2010, Mona et al 2012).
Integrated with satellite observations, coordinated lidar ground-based observations are important to help providing detailed information on the space–time evolution of such particular events and, in particular, multiwavelength Raman lidar retrievals can, for instance, help tracking the evolution of the aerosol properties as they age while transported (Mattis et al 2010, Noh et al 2011, Navas-Guzmán et al 2011, Alados-Arboledas et al 2011).
Due to its vertical resolving capabilities, lidar is also a good validation and/or input tool for SO2 retrievals (Carn et al 2007). Matthias et al (2012) highlights the importance of combining atmospheric transport models with ground-based and airborne measurements, e.g. lidar, sunphotometers and in situ, in order to make a comprehensive analysis of ash concentrations in the atmosphere. Improved knowledge on the vertical distribution of the aerosols following a major volcanic eruption, which are possible from extensive lidar observations, would translate into a better representation of distinct aerosol/ash layers in the transport models, which in turn could aid in the air traffic decision-making process during such events.
In this study, although not formally in the framework of GALION, we showed how the synergy proposed by it would greatly aid the scientific community to rapidly assess the outcome of future (and possibly more explosive) volcanic eruptions. In general, the synergy of coordinated ground-based lidar with aircraft and satellite measurements are of great importance to track and characterize general aerosol transport on continental and/or global scale.
The AOD values obtained from lidar data at 532 nm in this study (excluding Sede Boker) ranged from 0.003 to 0.04, with an average of 0.018 ± 0.009 with S ranging from 38 to 50 sr. At 355 nm (CNR-IMAA, OHP and Granada) AOD ranged from 0.04 to 0.05. CALIOP global retrieval obtained a maximum AOD of 0.03 at 532 nm mostly over Eastern Europe and Asia. As previously mentioned, the AOD calculation from most of our lidar data (with exception of CNR-IMAA group) relies on a reasonable estimation for the S value. 50 sr is likely to be close to the upper limit of acceptable values of S for sulfate aerosols in the stratosphere, which would then result in even lower AOD values. In either case it is unlikely that the aerosol generated after Nabro's eruption would have a significant long-term effect on the radiative balance of the atmosphere like Pinatubo did.
Acknowledgments
The authors would like to thank Simon Carn from the Department of Geological and Mining Engineering and Sciences at Michigan Tech for preliminary SO2 analysis. The authors would also like to acknowledge the NOAA Air Resources Laboratory (ARL) for the provision of the HYSPLIT transport and dispersion model and READY website (www.arl.noaa.gov/ready.php) used in this publication. Lidar work at UMBC was funded by grant NNX10AR38G (DISCOVER-AQ). The NASA Micro-Pulse Lidar Network is funded by the NASA Earth Observing System and Radiation Sciences Program. Lidar work at the Hefei site was funded by the National Key Basic Research Project of China under Grant No. 2007FY110700. Lidar work at Universidad de Granada was funded by grants CGL2010-18782 and P10-RNM-6299. The EARLINET stations are funded by the EU FP7 Project 'ACTRIS'. SNT was supported under the program, Changing Water Cycle funded jointly by Ministry of Earth Sciences, India and Natural Environment Research Council, UK. The OHP lidar measurements are funded by CNRS INSU.