

Abstract
Within the zone of discontinuous permafrost, linear disturbances such as winter roads and seismic lines severely alter the hydrology, ecology, and ground thermal regime. Continued resource exploration in this environment has created a need to better understand the processes causing permafrost thaw and concomitant changes to the terrain and ground cover, in order to efficiently reduce the environmental impact of future exploration through the development of best management practices. In a peatland 50 km south of Fort Simpson, NWT, permafrost thaw and the resulting ground surface subsidence have produced water-logged linear disturbances that appear not to be regenerating permafrost, and in many cases have altered the land cover type to resemble that of a wetland bog or fen. Subsidence alters the hydrology of plateaus, developing a fill and spill drainage pattern that allows some disturbances to be hydrologically connected with adjacent wetlands via surface flow paths during periods of high water availability. The degree of initial disturbance is an important control on the extent of permafrost thaw and thus the overall potential recovery of the linear disturbance. Low impact techniques that minimize ground surface disturbance and maintain original surface topography by eliminating windrows are needed to minimize the impact of these linear disturbances.
Export citation and abstract BibTeX RIS

Content from this work may be used under the terms of the Creative Commons Attribution 3.0 licence. Any further distribution of this work must maintain attribution to the author(s) and the title of the work, journal citation and DOI.
1. Introduction
Ongoing resource exploration in Canada's North produces a dense network of linear disturbances in the form of winter roads, seismic lines, and pipelines with the potential for large cumulative environmental impacts. In a forested permafrost environment the habitat disruption, regrowth of trees, and changes in hydrology along such disturbances depend on the degree of permafrost thaw (Jorgenson et al 2010a). Such consequences may be particularly important along the southern margins of discontinuous permafrost where permafrost is relatively thin (∼10 m) (Burgess and Smith 2000) and ground thermal regimes are vulnerable to disturbance. A wide range of methods can be employed to create seismic lines, the most common type of linear disturbance. Decisions on the most appropriate method for a given situation, and the development of new science-based guidelines for future exploration (e.g. AANDC 2011) both require a clear understanding of potential impacts and feedbacks of seismic disturbance.
Conventional techniques for seismic exploration create 6–10 m wide lines, with coarse woody debris piled in windrows along the edge of the disturbance, often using heavy machinery such as bulldozers to clear the line resulting in uprooting, surface soil removal, and compaction (AECOM 2009). Strategies designed to minimize the impact include reducing disturbance width, restricting exploration to the winter period, and the use of low-impact vehicles or hand clearing techniques (AECOM 2009). Collectively, these strategies have been termed LIS (low-impact seismic) and while they have become commonplace in Alberta and northern British Columbia, they are not widely used in the NWT where adoption by industry has largely been on a voluntary basis (AECOM 2009).
Extensive ground thermal monitoring on the Norman Wells Pipeline south of Fort Simpson, NWT, has shown several metres of vertical permafrost thaw, a complete loss of thin permafrost, ponding, and ground subsidence of more than 2 m (Smith et al 2008). A pipeline is a significant disturbance, with a large (∼25 m) right of way and a pipe that is a continual source of heat. As such, the findings of Smith et al (2008) might not be directly transferable to the case of seismic lines.
The majority of research on seismic line impacts has been conducted in the zone of continuous permafrost (Jorgenson et al 2010a, Kemper and Macdonald 2009, Raynolds and Felix 1989, Hernandez 1973), or conducted from an ecological perspective with regards to tree regeneration (Lee and Boutin 2006, Revel et al 1984), and habitat disruption (Machtans 2006, Dyer et al 2001, James and Stuart-Smith 2000). Consequently, the linkages among linear disturbances, permafrost thaw and changes to hydrology within the discontinuous permafrost zone remain poorly understood (Turetsky and St Louis 2006).
In peatlands, the thermal conductivity and thus the rate of ground thaw is largely determined by its water content due to the large porosity of peat (>0.80) (Guan et al 2010, Woo 1986). In this environment, permafrost remains only where the ground surface remains dry (Kwong and Gan 1994). The ground beneath the frost table (i.e. zero-degree isotherm) is saturated with ice and a small fraction of unfrozen water, and is therefore relatively impermeable to infiltrating water (Woo 1986). The frost table thus controls the rate and pattern of subsurface drainage. Preferential thaw below wet surfaces induce a hydraulic gradient directing flow towards the thaw depression (Wright et al 2009). The ground thermal regime is thus dependent on feedbacks with soil moisture and micro-topography (Jorgenson et al 2010b) and disturbance-related changes in frost table and soil water have the potential to feedback positively on one another to send linear disturbances on permafrost into an unstable and degrading state.
The goal of this research is to assess this possibility and increase the understanding of permafrost thaw-induced changes to land cover and drainage patterns caused by linear disturbances. This will be accomplished through the following specific objectives: (1) assess the spatial variability of the ground thermal regime along linear disturbances in relation to undisturbed sections of plateau by measuring active layer thaw, permafrost depth, soil moisture, ground surface subsidence, and snow depth; (2) use surface subsidence as a proxy for the degree of site degradation, and examine the controls on subsidence with regards to different disturbance ages, types, and surrounding plateau properties; and (3) measure the storage and movement of surface water along a linear disturbance to better understand how disturbances alter the hydraulic function of peat plateaus.
2. Study site
The study site is located 50 km south of Fort Simpson, NWT, in the headwaters of Scotty Creek (61°18'N,121°18'W) (figure 1). As is typical of the southern margin of permafrost in Canada, Scotty Creek is a peatland environment where ∼10 m thick permafrost (McClymont et al 2010) gives rise to plateaus that are elevated ∼1–2 m above the surrounding permafrost-free flat bogs and channel fens. The elevated plateaus allow them to develop an unsaturated peat layer near the ground surface, which thermally insulates the underlying permafrost and results in an active layer typically between 0.5 and 0.8 m (Wright et al 2009). Plateaus support an open black spruce canopy (Picea mariana), a shrub layer dominated by Labrador Tea (Rhododendron groenlandicum), and a surface cover of lichens (Cladina mitis and Cladina rangiferina are dominant) and Sphagnum mosses. Fens and bogs have water tables near or above the ground surface and generally do not support trees, although in some cases larch (Larix laricina) will form a thin canopy.
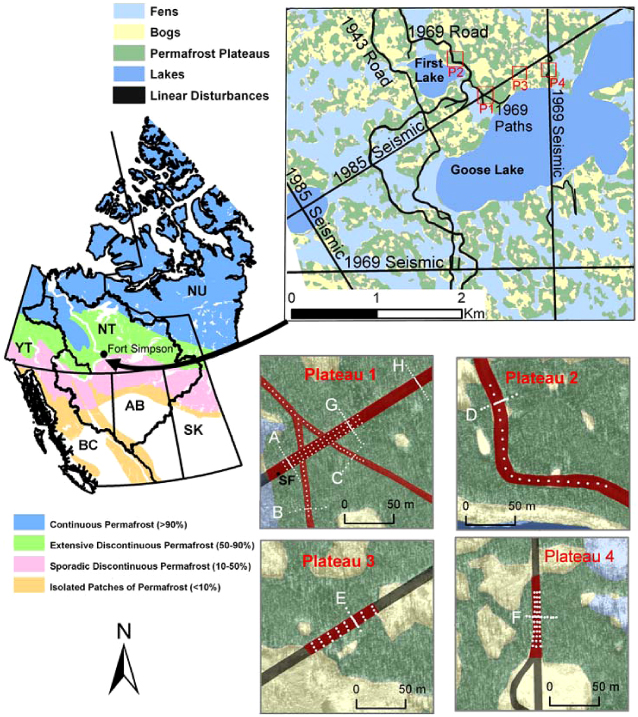
Figure 1. Location of the study site in the zone of discontinuous permafrost, with data obtained from the Geological Survey of Canada (2002), south of Fort Simpson, Northwest Territories, Canada. The four measurement plateaus are located on land cover maps interpreted from WorldView2 satellite imagery. P1 and P2 have large intersections with linear disturbances (each >375 m), while P3 and P4 are small sections of plateau with short intersections (80–85 m). White dots represent individual measurement points, and the eight cross-section transects are labelled (A)–(H). Transects located parallel to disturbances were positioned on the middle of the disturbance, as well as 1 m from the disturbance edge in the case of the three grids on Plateaus 1, 3, and 4. The streamflow measurement location (SF) is located on the west side of Plateau 1, basin drainage is towards the northwest from Goose Lake into First Lake.
Download figure:
Standard imageThe hydrology at Scotty Creek is controlled by the distribution of these three land cover types, which generally have unique functions to either generate runoff (plateaus), store water (bogs), or act as the basin drainage network (channel fens). At the basin scale, permafrost plateaus act as obstacles to basin drainage that channel fens must negotiate like a braided stream around gravel bars. As such, permafrost plateaus increase the tortuosity of flow paths along channel fens that drain towards the basin outlet. A study by Quinton et al (2003) of five similar peatland basins near Scotty Creek showed higher runoff ratios over a four-year period in basins with a greater percentage area of channel fens. The density of linear disturbances within Scotty Creek is 0.875 km km−2 (Quinton et al 2011); about five times the natural drainage density of the basin. If such disturbances function as channel fens to connect adjacent wetlands, they would have a major impact on the cycling and storage of water within the basin.
Three types of linear disturbances exist at Scotty Creek (figure 1): abandoned winter roads (1943, 1969) up to 15 m wide, seismic lines (1969, 1985) 7–10 m wide, and access paths (1969) 5–6 m wide. All seismic lines at Scotty Creek were created using conventional techniques for seismic exploration. However, the narrow paths appear to provide a useful analogue for more modern LIS techniques in which impact on the ground surface is minimized. The purpose of creating the narrow paths is unknown, but we do know that not all their trees were cleared from the disturbance, as some of them were found by tree-ring analysis to be over 90 years old, suggesting that large machinery was not used to create these paths.
3. Methods
3.1. Field data
Beginning on 23 March 2011 on each of the four measurement plateaus (figure 1), transects located along and across 1985 and 1969 seismic lines, a 1969 winter road, and a 1969 path measured snow depth (snow probe) and snow water equivalent (ESC snow tube and calibrated scale). As snowmelt increased, so did the frequency of snow measurement surveys, and by 29 April each site was being measured every 1–2 days to provide the rate of snowmelt. Upon the snow-free condition, frost table depth below the ground surface (2 m graduated steel rod), depth-integrated soil moisture from 0 to 5 cm (site-calibrated Delta-T Theta-Probe ML2x), and the water table depth below the ground surface or height above it (metal ruler) were measured on all transects. Snowfall and rainfall during the measurement period (after 23 March) were measured within a large canopy gap on Plateau 2 using a precipitation gauge (Geonor T-200B). Frost table depth measurements continued on a daily basis until 4 June, and were measured once in July (between 24 and 26 July), and again in August (between 29 and 31 August). The depth of the frost table at the end of August is assumed to represent the maximum extent of seasonal thaw and the location of the permafrost table. When large increases (>20 cm) were observed in the frost table depth over a single day, the previous day measurement is assumed to represent the base of the active layer. Early onset of this condition represents a greater potential for permafrost thaw to occur and sites were compared based on the percentage of points that had observed this active layer thaw (%ALT).
All measurement points were located using differential GPS (up to ±0.06 m horizontal accuracy) and referenced to a digital elevation model (DEM) derived from airborne LiDAR with a 1 m horizontal resolution, in order to determine ground surface elevation at each point. At each site, the dominant surface cover was characterized using the following categories: lichen, moss, Labrador Tea, bare ground, or coarse woody debris.
Stream flow discharge was measured from 7 to 27 May across a small channel located on the south side of the 1985 seismic line at Plateau 1, which was the only measurement plateau to contain surface stream flow. Flow velocity was measured once a day using an acoustic Doppler velocimeter (YSI SonTek FlowTracker). The discharge was calculated using the velocity-area method,
where Q is the discharge, n is the number of sections used to divide the stream, vi is the average velocity of the section taken as the velocity at 0.6Di, Di is the depth of the section, and Δwi is the section width. Given the very narrow stream width, which ranged from 30 to 75 cm, we used just 3 equally sized sections to divide the stream. The uncertainty of each velocity measurement was diagnosed by the instrument and given as a standard error. The standard error of time averaged velocity measurements ranged from 0.001 to 0.002 m s−1.
3.2. DEM analysis
A LiDAR derived DEM was collected for Scotty Creek (Applied Geomatics Research Group, NS, Canada) on 8 August 2011 using an Airborn Laser Terrain Mapper (ALTM 3100). Data acquisition occurred at a flight level of 1500 m, with a scan angle of ±20°, and a pulse repetition frequency of 50 kHz, resulting in ∼2 returns m−2. All data were referenced to the UTM zone 10, NAD83 datum. The detection of the tree canopy by the LiDAR was used to measure the canopy gap fraction as described by Chasmer et al (2011).
Ground surface subsidence was calculated by averaging ground surface elevations from three 25-m-long transects; one located down the middle of a disturbance and two transects parallel to the disturbance on the undisturbed plateau at 5 m away from each edge. The depth of subsidence was calculated by subtracting the average elevation of the two undisturbed transects from the middle of disturbance transect. Because plateaus rise to different heights above their surroundings, the percentage of subsidence was also calculated by dividing the depth of subsidence by the plateau height above the surrounding wetlands. The procedure was repeated at 10 different locations for seven different linear disturbances within a 25 km2 area, for a total of 70 measurements of ground surface subsidence.
The impact of this ground subsidence on surface hydrology flow connections was examined with topographic profiles that started and ended on the edges of plateaus where they met surrounding wetlands and followed the lowest elevation path along the linear disturbance. A total of 40 profiles were selected, 10 each for the 1943 and 1969 roads, and 1969 and 1985 seismic lines. In order to exclude small depressions and data errors from the analysis, the elevation of each point along the profile was expressed as a 5 m running average and we assumed that any depressions <20 cm deep were filled. In order to function analogous to a channel fen and connect adjacent wetlands, the profile must slope in one direction along the entire length of the disturbance.
The DEM was also used to identify the drainage area of linear disturbances by computing a flow direction for each cell in ArcGIS, and breaking the plateau into multiple sub-basins with outlets either on the edge of the plateau or within internally draining bogs. Upstream of the gauging location on Plateau 1 (figure 1), daily water table measurements on the seismic line, interpolated across the entire surface using an inverse distance weighted technique, were used to measure the ability to fill depression storage along the seismic line. The interpolated water table was then compared with the ground surface elevation, using the cut-fill tool in ArcGIS to calculate the volume of water stored above the ground surface in depression storage.
3.3. Statistical analysis
To quantify how hydrological and cryotic variables differed as a function of disturbance type (undisturbed, 1985 seismic line, 1969 path, 1969 winter road, 1969 seismic line) or location perpendicular to a disturbance (off disturbance, windrow, exposed disturbance) we used a principal component analysis (PCA) which included the following variables measured at each point: frost table depths on 10 May, 30 May, 24 July and 29 August 2011, soil moisture on 10 May and 24 July 2011, snow-free date, ground surface subsidence, ground cover and active layer thaw date. Snow-free date and active layer thaw were converted to Julian dates and dummy variables were created for dominant ground covers (lichen, moss, Labrador Tea, bare ground, coarse woody debris). The resulting sites scores were then divided in two ways: by location and by disturbance type. For each classification, we tested for differences in site scores using a univariate analysis of variance (ANOVA).
We were also interested in determining which disturbance features were most influential in determining the degree of ground surface subsidence at a particular point in a disturbance. To do this, we used data derived from the LiDAR DEM analysis in a multiple linear regression analysis to model (a) ground surface subsidence (in metres); and (b) ground surface subsidence characterized as a per cent of the adjacent plateau height (two identical ground surface subsidence values can result from different proportional loss if plateau height differs). We ran 14 models using combinations of disturbance age, type, width, orientation, contributing plateau drainage area, length of intersection with plateau, and surrounding canopy density (gap fraction derived from LiDAR). Model selection was based upon the corrected minimum Akaike Information Criterion (AICc) and associated statistics (Burnham and Anderson 1998, Anderson 2008). Lower AICc values indicate a more parsimonious model (Burnham and Anderson 1998, Anderson 2008); ΔAICc values were calculated in relation to the minimum AICc model. Model likelihoods and evidence ratios were then calculated to identify which model had the greatest support. All statistical analyses were conducted using R (2.13.1, The R Foundation for Statistical Computing, Vienna, Austria).
4. Results
4.1. Linear disturbance effects on hydrologic and cryotic properties
With the exception of the 1969 paths, linear disturbances substantially increased soil moisture, depth to permafrost, and resulted in active layer thaw prior to the end of August (table 1, figure 2). The extent of permafrost thaw across linear disturbances corresponds closely to the edge of the disturbance, as defined by the change in vegetation and topography, with the exception of windrows that maintain permafrost near ground surface (figure 2). The only sites to consistently maintain permafrost within 2 m of the ground surface are the 1969 paths on Plateau 1 (figures 2(b), (c)), and the 1985 cutline on the small Plateau 3 (figure 2(e)). Even where permafrost was not found within 2 m (figures 2(a), (d), (f)), subsidence was not to the level of the surrounding wetlands, suggesting deeper permafrost may be present.
Table 1. Measured cryotic and hydrological variables summarized by location (off disturbance, windrow, exposed disturbance) and measurement site (large Plateaus 1 and 2, small Plateaus 3 and 4). Variables include: median frost table (FT) depth, percentage of measurement points where the active layer (previous winter freezing) had thawed (ALT), median snow free (SF) date, and the mean volumetric soil moisture (SM) from 0 to 5 cm expressed in May as an average of six days of measurement between 8 and 22 May and in July for a single measurement day between 24 and 26 July; soil moisture variance is expressed as ± standard error and 'nd' indicates no data. On exposed parts of the disturbances, frost tables often exceeded 200 cm and as such were recorded as >200; we could not as a consequence calculate standard errors for these values.
| n | Median FT depth (cm) | ALT (%) | Med. SF date (days) | Mean vol. SM (%) | ||||||
|---|---|---|---|---|---|---|---|---|---|---|
| 10 May | 30 May | 24–26 July | 29–31 Aug | 30 May | 24–26 July | 8–22 May | 24–26 July | |||
| Off disturbance | 74 | 9.8 ± 1.0 | 16.1 ± 0.7 | 37.9 ± 1.7 | 49.9 ± 1.6 | 0 | 1 | 6 May ± 0.2 | 41.7 ± 1.8 | 25.7 ± 1.6 |
| Windrow | 37 | 8.9 ± 0.7 | 17.4 ± 1.0 | 40.0 ± 7.8 | 53.2 ± 7.4 | 3 | 3 | 2 May ± 1.2 | 41.2 ± 2.2 | 21.9 ± 2.1 |
| Exposed disturbance: | ||||||||||
| Plateau 1 1969 path | 44 | nd | 20.0 ± 1.0 | nd | 61.8 | 0 | nd | nd | nd | nd |
| Plateau 1 1985 seismic | 61 | 5.8 ± 1.1 | 29.0 | >200 | >200 | 39 | 87 | 5 May ± 0.5 | 72.0 ± 1.7 | 59.2 ± 3.2 |
| Plateau 2 1969 road | 26 | 7.6 ± 2.2 | 29.2 | >200 | >200 | 46 | 100 | 4 May ± 0.4 | 67.7 ± 3.1 | 69.5 ± 3.4 |
| Plateau 3 1985 seismic | 18 | 5.6 ± 0.9 | 18.9 | 173.3 | 187.4 | 22 | 61 | 8 May ± 0.5 | 58.1 ± 4.3 | 43.9 ± 5.5 |
| Plateau 4 1969 seismic | 38 | 5.7 ± 0.8 | 18.8 | >200 | >200 | 5 | 76 | 8 May ± 0.3 | 58.2 ± 2.7 | 48.3 ± 3.5 |
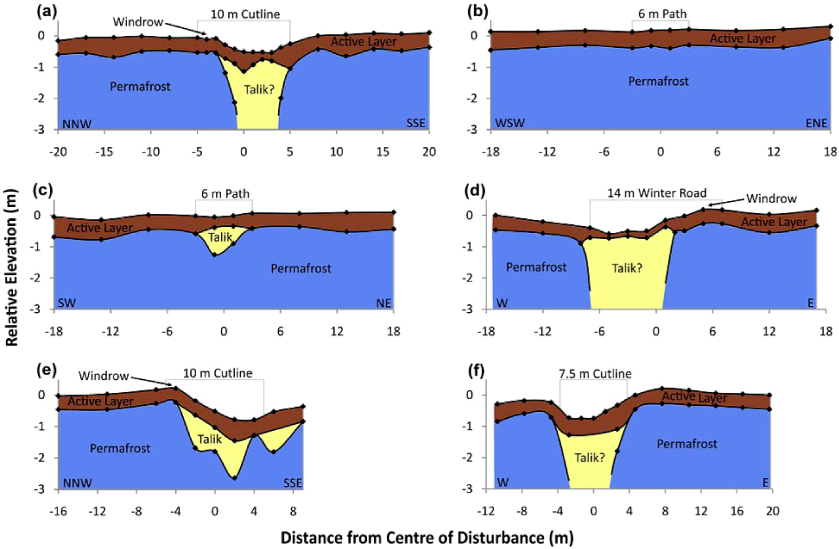
Figure 2. Ground surface elevation, active layer thickness, and permafrost table depth measured on six cross-sections (located in figure 1) for (a) 1985 seismic line on Plateau 1, ((b), (c)) 1969 paths on Plateau 1, (d) 1969 winter road on Plateau 2, (e) 1985 seismic line on Plateau 3, and (f) 1969 seismic line on Plateau 4. Yellow shaded regions represent perennially unfrozen peat; however, where end of August measurements exceed the 2 m limit of the frost probe, these cannot be confirmed as taliks due the potential of it being free of permafrost.
Download figure:
Standard imageThe PCA indicated strong clustering based on the degree of disturbance at the site (figure 3). When the PCA scores were divided based upon location (off disturbance, windrow, or exposed disturbance) there was a clear distinction between exposed and off disturbance sites (figure 4). Windrow sites ranged from conditions similar to undisturbed to those that overlapped with exposed disturbance. In general, undisturbed sites had later active layer thaw dates, lower soil moisture and shallower frost table depths on all measurement dates (figure 4). When the PCA scores were divided as a function of disturbance type, the 1969 seismic line, 1969 winter road and, to a lesser extent, the 1985 seismic line clustered together sharing earlier active layer thaw dates, higher soil moisture contents, and deeper frost tables than undisturbed sites or those on the 1969 path (figure 3). It should be noted that approximately half of the 1985 seismic line sites clustered with the undisturbed and 1969 path sites, largely due to permafrost being maintained on the windrow and on the small Plateau 3 site (figure 2). The first principle component, which was determined entirely by soil moisture, frost table depths and active layer thaw dates, explained 75% of variation among sites (figure 3) and only the first and second axes were significant.

Figure 3. Principle components analysis of 11 hydrologic and cryotic variables measured on various linear disturbances and on undisturbed permafrost plateaus. For clarity, the site loadings have been divided based upon the disturbance type: undisturbed, 1985 seismic line, 1969 path, 1969 seismic line, and 1969 winter road. Variables explaining significant site variation among the first two axes are depicted in (B). ANOVA results indicated that disturbance type was a highly significant predictor of site scores along the first axis (P < 0.0001).
Download figure:
Standard image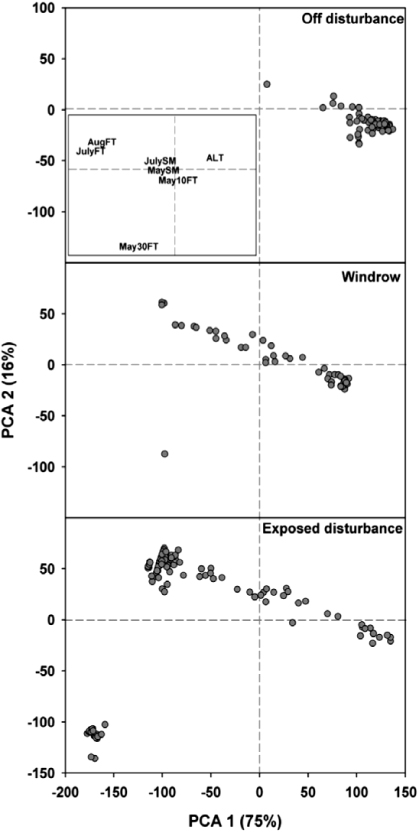
Figure 4. Principle components analysis of 11 hydrologic and cryotic variables measured on various linear disturbances and on undisturbed permafrost plateaus. For clarity, the site loadings have been divided based upon the location along the disturbance: undisturbed, windrow, and exposed disturbance. Variables explaining significant site variation among the first two axes are depicted in the inset. ANOVA results indicated that location along the disturbances was a highly significant predictor of site scores along the first axis (P < 0.0001).
Download figure:
Standard image4.2. Drivers of ground surface subsidence in linear disturbances
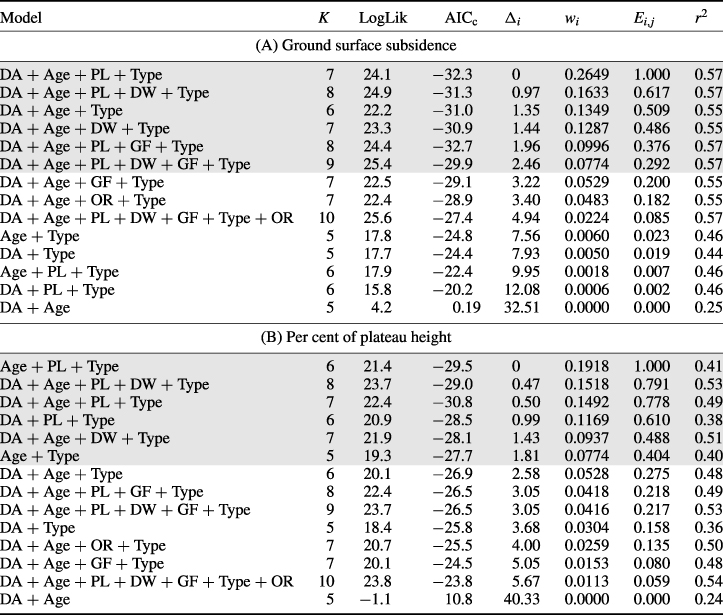
Field observations suggest that ground surface subsidence is a reasonable indicator of areas that have undergone permafrost thaw (figure 5). Analysing subsidence from 70 different locations, there were five and six models with delta AICc values below 2 and reasonably comparable model likelihoods and evidence ratios for ground surface subsidence and subsidence expressed as a per cent of adjacent plateau height, respectively (table 2). When considering total ground surface subsidence, three variables were consistently included in all high-ranking models: drainage area (increased subsidence with increased drainage area), disturbance age, and disturbance type. The model with greatest support (i.e., minimum AICc) also included the plateau length intersected by the disturbance.
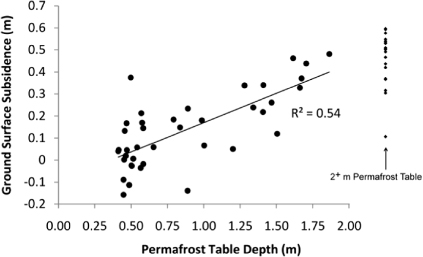
Figure 5. Relationship between ground surface subsidence and permafrost table depth (linear regression, y = 0.27x − 0.10,R2 = 0.54, P < 0.0001) along linear disturbances for measurement points on cross-sections A–H. Subsidence for locations where the permafrost table exceeds 2 m is plotted on the right-hand side of the graph, but is not included in the linear regression. A negative ground surface subsidence indicates a point where the ground surface is elevated above the surface of the surrounding plateau.
Download figure:
Standard imageTable 2. AIC-based rankings from best to worst for 14 multiple linear regression models predicting (A) total ground surface subsidence and (B) ground surface subsidence as a per cent of plateau height. Rankings were based upon model probabilities (wi) and evidence ratios (Ei,j) (see Burnham and Anderson 1998 and Anderson 2008 for details). Also shown are the parameter penalty term (K), log-likelihood values (LogLik), corrected AIC values (AICc) and the differences between each model and the minimum AICc model (Δi). Predictors included drainage area (DA), disturbance age (1943, 1969, 1985; Age), length of the plateau that the disturbance traverses (PL), disturbance width (DW), the gap fraction (GF), disturbance type (cutline, winter road, path; type), and the orientation of the disturbance at the measurement point (N–S, E–W, NW–SE, NE–SW; OR).
|
When subsidence was considered as a per cent of adjacent plateau height, the minimum AICc model included the same three variables as mentioned above: drainage area, disturbance age, and disturbance type, though of these variables only disturbance type was included in all top-ranking models (table 2). On average, winter roads subsided by 0.62 ± 0.06 m (an average of 80% of plateau height), seismic lines subsided by 0.53 ± 0.03 m (60%), and the paths by 0.09 ± 0.02 m (13%). Older disturbances show somewhat greater subsidence than more recent disturbances when disturbance type is accounted for (table 2).
4.3. Surface runoff processes along subsided disturbances
The variation in ground surface subsidence between different linear disturbances influences the topographic profile along these disturbances. Overall, the profiles indicated low connectivity between adjacent wetlands. For example, by filling all depressions up to a 20 cm threshold, only 4 of the 40 topographic profiles were hydrologically connected throughout their entire length of disturbance, and sloped in a single direction. These properties are present in channel fens and are necessary for efficient flow conveyance. Of these four profiles, three of them were on the 1943 winter road, the disturbance with the greatest amount of subsidence.
The profile along the 1985 seismic line on Plateau 1 typifies those studied as it has multiple depressions and slopes towards each of its two adjacent wetlands (figure 6(a)). The discharge hydrograph for a single channel flowing along the west end of the seismic line peaked immediately following snowmelt (figure 7). The 6 May flow velocity was not measured, but the water level was the same as it was on 7 and 8 May, suggesting similarly high flows for all three days. Assuming this was the case, then that three-day period accounted for ∼50% of the cumulative discharge measured until 3 June.
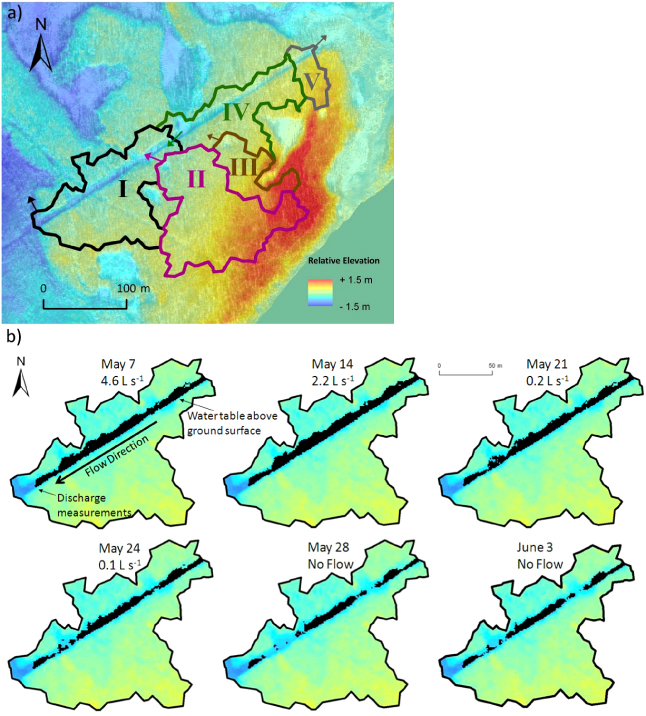
Figure 6. (a) The contributing area for the 1985 cutline on Plateau 1 divided into five sub-basins based on analysis of a LiDAR DEM in ArcGIS. Sub-basins II–IV are defined as being internally drained due to the presence of small isolated bogs. Arrows represent the potential outlets for each sub-basin, and the DEM is overlaying WorldView2 satellite imagery. (b) Ground surface saturation along the 1985 cutline within Plateau 1, Sub-basin I as interpreted from water table measurements for six days early in the spring. The volume of water stored above the ground surface (shaded in black) is noted for each day. Flow direction is towards the southwest where the sub-basin outlets into an adjacent channel fen.
Download figure:
Standard image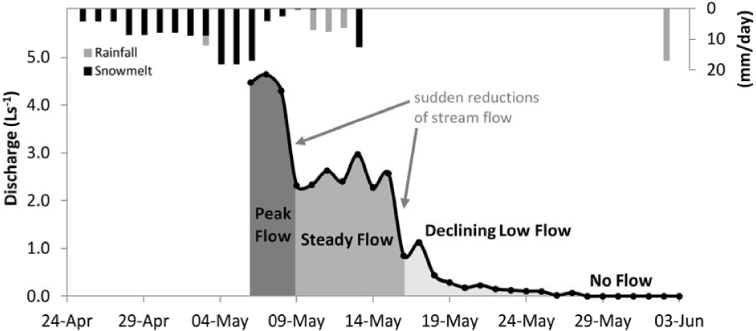
Figure 7. Discharge measured daily across a small channel flowing off the 1985 seismic cutline on Plateau 1 during the early spring. A secondary vertical axis shows the daily snowmelt and rainfall inputs measured on the plateau.
Download figure:
Standard imageFollowing the rapid decline in discharge on 9 May was a relatively steady period of approximately 2.5 l s−1 until 16 May when discharge declined to a period of low flows (figure 7). The absence of any precipitation between 14 May and 1 June resulted in a continued lowering of the water level on the seismic line and reduced discharge into the channel fen. Figure 6(b) shows that as the water table lowered and the spatial extent of ground surface saturation decreased, the seismic line gradually became hydrologically disconnected from surface and shallow subsurface flow interaction with the channel fen. By 28 May, the topographic depressions on the cutline continued to support standing water, although surrounding higher micro-topography inhibited flow along the seismic line. On 2 June, a 17 mm event of rain and wet snow produced an average water table rise on the seismic line of 54 mm above the pre-storm level; however, this was still not enough to connect the surface pathways and initiate surface runoff (figure 7).
The cumulative measured snowmelt and rainfall input by the end of May was 196 mm. When surface runoff is expressed in terms of only the area for sub-basin I (13 955 m2) (figure 6(a)), the cumulative runoff was 215 mm. Not accounting for the remaining outputs of water (evaporation, subsurface flow, groundwater recharge), this suggests the drainage area of the small channel flowing over the seismic line extends well beyond sub-basin I. Expressed over the entire area of sub-basins I–IV (44 345 m2), the cumulative runoff by the end of May represents 68 mm, or 35% of snowmelt and rainfall inputs.
During the peak runoff period daily discharge from the seismic line was three times the total volume of water stored above the ground surface on the portion of the seismic line within sub-basin I. However, over the final eight days of declining flow (20–27 May), the volume of surface runoff (84 m3) was similar to the volume of water loss from depression storage in sub-basin I (72 m3) suggesting a substantial decline in the input of water to the seismic line. The sudden reductions in discharge noted in figure 7 may represent hydrological disconnections between sub-basins I, II, and IV (figure 6(a)). Once the sub-basins became disconnected, the declining flow drained the water stored above the ground surface on the seismic line within sub-basin I until the declining water level prevented further stream flow.
5. Discussion
As observed for linear disturbances in continuous permafrost (Jorgenson et al 2010a), permafrost thaw beneath linear disturbances at Scotty Creek is greatest where the soil moisture is highest. However, unlike disturbances on thick, stable permafrost where there is an increased active layer thickness and eventual recovery to the pre-disturbance state (Jorgenson et al 2010a, Kemper and Macdonald 2009), linear disturbances in the discontinuous permafrost zone have the potential to completely remove permafrost and dramatically transform the overlying land cover type. McClymont et al (2010) observed 3–4 m of permafrost thaw along the 1969 winter road at Scotty Creek. In the present study, the ground thermal regimes of the seismic lines and the abandoned winter roads were similar, with degrading permafrost that shows little sign of regeneration. Active layer thaw dates (the time when summer thaw matches the previous winter freezing depth) occurred well before the end of summer. The lack of permafrost regeneration results from a positive feedback with ground surface subsidence and water impoundment that prevents the formation of the unsaturated surface layer required to maintain permafrost in this environment (Jorgenson et al 2010b, Kwong and Gan 1994).
Variation in permafrost thaw and subsidence along linear disturbances created depressions within the topographic profiles that generally prevented the disturbances from functioning to connect adjacent wetlands analogous to channel fens. The temporal pattern of runoff from the Plateau 1 seismic line suggests the possibility of 'fill and spill' type drainage mechanisms (Spence and Woo 2003). In order for the plateau to efficiently drain into the fen via the seismic line, the cumulative storage capacity of the depressions along the seismic line must first be overcome so that water can flow unimpeded over the ground surface. Additionally, the contributing plateau area to this disturbance, and thus the volume of water input available to fill this depression storage, depends on whether the small internal bogs within the plateau are connected with the seismic line.
The fill and spill process on linear disturbances at Scotty Creek is controlled by the position of the relatively impermeable frost table and seasonal variations in the availability of water. Since snowmelt represents 45% of the annual precipitation (MSC 2012), the large amount of water available early in the thaw period increases the likelihood of filling depressions. Additionally, the position of the frost table early in the thaw season promotes higher water levels. As a result, the observed seismic line functioned as a seasonally connected bog that is hydrologically connected through surface pathways to the channel fen only during periods of high water availability early in the thaw season. At present, linear disturbances do not appear to have substantially increased the hydrological connectivity between adjacent wetlands. However, as permafrost continues to thaw along linear disturbances and more subsidence occurs, there is greater potential for them to function similarly to channel fens and increase the drainage basin efficiency. We made no measurements of subsurface ground water flow in our study. This is expected to be negligible along most disturbances early in the thaw season due to position of the frost table near the ground surface. However, the potential for subsurface flow increases later in the summer and may also be present through the winter given the observed taliks. This is an area where future research is required.
Despite being less of a disturbance than pipelines, the processes leading to the subsided, wet, and permafrost-degraded seismic lines is similar to those reported along the Norman Wells pipeline south of Fort Simpson (Smith et al 2008). Given the concerns surrounding the impact of linear disturbance density on wildlife (Dyer et al 2001, James and Stuart-Smith 2000), the lack of recovery of these disturbances from conventional exploration techniques provides future management challenges in the study region.
6. Management implications
Our results indicate that the spatial variation in ground thaw and subsidence at Scotty Creek is dependent on the initial degree of disturbance, the age which affects the progression of thaw, and the morphology (size and shape) of individual peat plateaus which control the water supply to the disturbance. This suggests that best management practices for reducing the impact of these disturbances should focus on minimizing the degree of disturbance to the ground surface and avoiding changes in drainage patterns. The following recommendations suggests ways in which future exploration may accomplish this and reduce the environmental impact:
- (1)Route planning: exploration in such a discontinuous permafrost environment should avoid areas of permafrost whenever possible, particularly large permafrost plateaus that provide a greater supply of water to the disturbance. Given the lack of regeneration that is occurring, future exploration in this environment could also make use of pre-existing disturbances that have already experienced considerable thaw. These disturbances may be wet with thin seasonally frozen layers and should be treated with the same level of caution as bog and fen wetlands with regards to heavy machinery over potentially unstable surfaces.
- (2)Surface preparation: care should be taken to prevent compaction of the ground surface caused by heavy machinery and to avoid uprooting and other damage to the soil surface. Exploration should only occur when the ground is frozen and there is an adequate snow cover to protect the ground surface. A complete removal of trees across wide disturbances likely contributes to increased soil moisture near the ground surface due to decreased evapotranspirational water loss (Vitt et al 1999), therefore, narrow disturbances and selective removal of trees, as opposed to removing all trees from the entire width of the cutline, would increase the likelihood for a quick regeneration of the disturbance.
- (3)Brush disposal: windrows maintained permafrost directly below the pile of debris; however, they also act as a barrier to drainage that likely contributes to increased soil moisture and permafrost thaw on the opposite side of the disturbance. Care should be taken to avoid changes in the surface topography, but if windrows are used, they should be restricted to the upslope side of the disturbance whenever possible.
7. Conclusions
Linear disturbances at Scotty Creek have undergone substantial permafrost thaw, ground surface subsidence, and changes in soil moisture. Disturbances that have experienced permafrost thaw do not appear to be in a process of regeneration. Once permafrost thaw occurs, the ground surface subsides, causing it to become wet and acting as a positive feedback to thaw. As long as the disturbances remain wet, summer thaw exceeds winter freezing and the black spruce canopy is unable to regrow, altering the land cover type and creating a wetland environment that is more typical of bogs or fens.
Overland flow along these disturbances is largely governed by a fill and spill process in which there must be a sufficient water supply to fill depression storage along the disturbance before a continuous saturated path develops at the ground surface. Surface runoff is more likely to occur on larger plateaus that contribute substantial volumes of water to the disturbance, and early in the thaw season when the frost table is near the ground surface and snowmelt supplies large volumes of water. Thus, it appears that many of these disturbances are unlike channel fens as they are seasonally connected to their surrounding wetlands.
Acknowledgments
We wish to acknowledge the financial support of the Canadian Foundation for Climate and Atmospheric Sciences, and the Natural Sciences and Engineering Research Council. We also acknowledge the logistical support provided by the National Water Research Institute (Saskatoon) and by Gerry Wright and Roger Pilling of the Water Survey of Canada (Fort Simpson). The Aurora Research Institute is gratefully acknowledged for their assistance in obtaining a research licence. We also wish to thank the Denedeh Resources Committee, Dehcho First Nations, Fort Simpson Métis Local #52, Liidlii Kue First Nation and the Village of Fort Simpson for their support of this project. In particular we thank Allan Bouvier and Allen Bonnetrouge of the Liidli Kue First Nation, and Chief Stanley Sanguez of the Jean-Marie River First Nation for continued support. Julian Kanigan of Aboriginal and Northern Development Canada and Aaron Berg of University of Guelph are also thanked for their insightful comments on earlier versions of this manuscript, as are two anonymous reviewers who improved the quality of this paper.