
Abstract
Climatic warming of about 0.5 ° C in the global mean since the 1970s has strongly increased the occurrence-probability of heat extremes on monthly to seasonal time scales. For the 21st century, climate models predict more substantial warming. Here we show that the multi-model mean of the CMIP5 (Coupled Model Intercomparison Project) climate models accurately reproduces the evolution over time and spatial patterns of the historically observed increase in monthly heat extremes. For the near-term (i.e., by 2040), the models predict a robust, several-fold increase in the frequency of such heat extremes, irrespective of the emission scenario. However, mitigation can strongly reduce the number of heat extremes by the second half of the 21st century. Unmitigated climate change causes most (>50%) continental regions to move to a new climatic regime with the coldest summer months by the end of the century substantially hotter than the hottest experienced today. We show that the land fraction experiencing extreme heat as a function of global mean temperature follows a simple cumulative distribution function, which depends only on natural variability and the level of spatial heterogeneity in the warming.
Export citation and abstract BibTeX RIS

Content from this work may be used under the terms of the Creative Commons Attribution 3.0 licence. Any further distribution of this work must maintain attribution to the author(s) and the title of the work, journal citation and DOI.
1. Introduction
The recent decade has seen an exceptional number of extreme heat waves around the world that caused severe damage to society and ecosystems (WMO 2011, Coumou and Rahmstorf 2012). Examples of such events include the European heat wave of 2003 (Schär et al 2004), the Greek heat wave of 2007 (Founda and Giannakopoulos 2009), the Australian heat wave of 2009 (Karoly 2009), the Russian heat wave of 2010 (Barriopedro et al 2011), the Texan heat wave of 2011 (Rupp et al 2012) and the US heat wave of 2012 (NOAA 2012). These events were highly unusual with temperatures typically three standard deviations warmer than the local climatology lasting for several weeks (see SOM figure 1 available at stacks.iop.org/ERL/8/034018/mmedia).
Statistical studies have shown that extremely warm monthly and seasonal temperatures associated with persistent heat waves can now largely be attributed to the observed climatic warming over the last 50 years (Hansen et al 2012, Coumou et al 2013), which has been about 0.5 ° C (Betts et al 2011). In the 1960s summertime extremes of more than three standard deviations warmer than climatology were practically absent, covering less than 1% of the Earth's land surface. Now such extremely hot seasonal temperatures typically cover about 10% of the land area (Hansen et al 2012). At the same time, the number of record-breaking monthly temperatures increased strongly, in agreement with the increase expected by a shift in the mean towards warmer values (Coumou et al 2013). The rapid increase in frequencies of very warm seasonal temperatures have directly been attributed to the human influence on climate using advanced climate models (Jones et al 2008, Stott et al 2011). In addition, attribution studies of individual heat waves, like the one in Europe in 2003 (Schär et al 2004, Stott et al 2004), in Russia in 2010 (Rahmstorf and Coumou 2011, Otto et al 2012) and in Texas in 2011 (Rupp et al 2012) have shown that their occurrence-probability had increased several fold due to greenhouse gas forcing.
The limited global warming to date thus already strongly increased the frequency of heat extremes on monthly to seasonal time scales, exacerbating societal impacts. This raises the question how and how rapidly this trend is likely to continue under future warming, which is expected to be substantially larger than the 0.5 ° C observed so far. To address this question, we analyze extremes in the state-of-the-art CMIP5 (Coupled Model Intercomparison Project) climate projections for the 21st century (Taylor et al 2011). Recent extreme heat waves in different parts of the world have caused monthly temperatures to exceed the local mean by three standard deviations over extended regions (SOM figure 1). Monthly mean temperatures beyond the three standard deviation threshold (i.e. 3-sigma events) during summertime can therefore be considered as proxies for such severe heat waves. Here we analyze extremes exceeding thresholds at different levels defined by the local historically observed natural variability (sigma). Because summertime heat extremes will have the biggest impact on humanity and since the bulk of the global land mass is located in the northern hemisphere, we focus on extremes in boreal summer in this letter. Results for austral summer (DJF) are given in the supplementary material (available at stacks.iop.org/ERL/8/034018/mmedia), where we note that over the southern hemisphere land mass the changes in extremes for DJF are very similar to those for JJA.
2. Methods
For each of the 29 CMIP5 simulation runs (Taylor et al 2011) available for both the RCP2.6 and RCP8.5 scenarios, we determine for each calendar month the local standard deviation due to natural variability of the monthly mean surface temperature. To do so, we first use a singular spectrum analysis to extract the long-term (periods of 30 years or greater) non-linear trend over the 20th century. Next we detrend the 20th century monthly time series by subtracting the long-term trend, which gives the year-to-year variability. From this detrended signal, monthly standard deviations are calculated, which are then averaged seasonally (i.e., seasonally averaged monthly standard deviations) (World Bank 2012). In the present analysis, we calculated the standard deviation using the last 60 years (1951–2010), however, we found that this estimate was robust with respect to different time periods. Following Hansen et al (2012), we use 1951–1980 as the reference time period, which has the advantage that it was a period of relatively stable global mean temperature prior to rapid global warming.
3. Results
During the 2000–2012 period, a sizable percentage of summer months exceeded 3-sigma, mainly in tropical regions but also over western Europe, the Mediterranean and the Middle East (figure 1). Such heat extremes have only recently emerged, but now cover about 5% of the global land surface (figure 2). Upward trends in more moderate extremes (i.e. 1- and 2-sigma events) can be detected further back in time, starting around 1980. Such extremes now cover about 40% and 15% of the global land surface, respectively, mainly concentrated in the tropics, Mediterranean and Middle East. The CMIP5 multi-model mean accurately captures the timing of the observed increase in the land fraction experiencing extremes since the 1970s for all three threshold levels (figure 2). Also the modeled spatial patterns are similar to those observed, though smoother because an average of 29 models is taken.
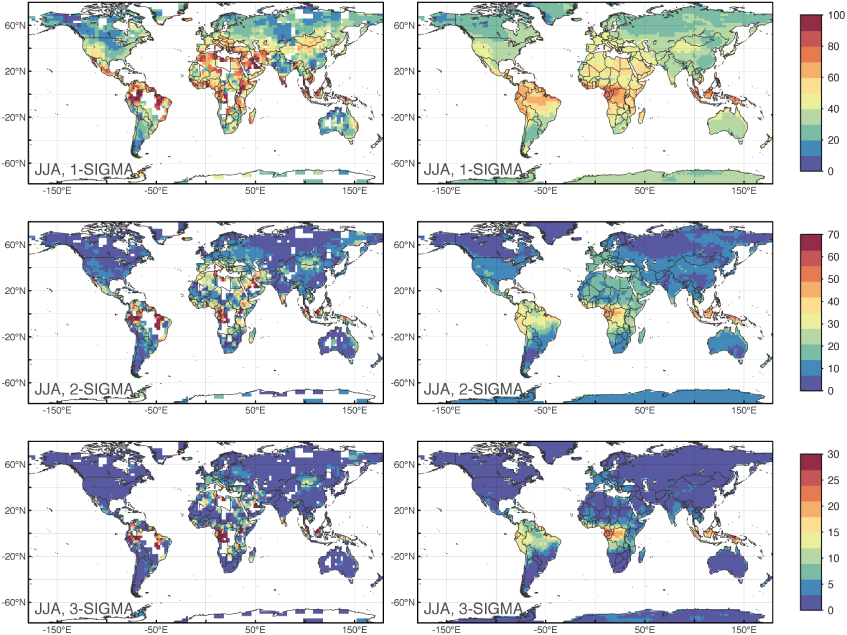
Figure 1. Percentage of boreal summer months in the time period 2000–2012 with temperatures beyond 1-, 2- and 3-sigma (top, middle and bottom, respectively) for observations (left) and the CMIP5 multi-model mean (right). Please note the different color bar ranges for the different threshold levels. Figures showing results for boreal winter months (DJF) can be found in the supplementary material (available at stacks.iop.org/ERL/8/034018/mmedia).
Download figure:
Standard image High-resolution image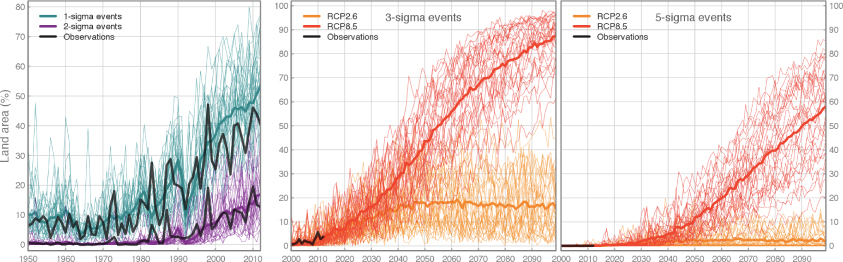
Figure 2. Percentage of global land area during boreal summers with monthly temperatures beyond different sigma-thresholds for historic (left) and 21st century (middle and right). The CMIP5 multi-model mean (thick colored lines) accurately reproduces the observed increase in 1-, 2- and 3-sigma extremes in the GISS surface temperature data (solid black lines). Future projections are given for 3-sigma (middle) and 5-sigma (right) for scenarios RCP2.6 and RCP8.5.
Download figure:
Standard image High-resolution imageThe favorable agreement between observations and models suggests that the multi-model mean can provide reasonable estimates of future changes in heat extremes on monthly time scales. The projections show that in the near-term such heat extremes become much more common, irrespective of the emission scenario. By 2020, the global land area experiencing temperatures of 3-sigma or more will have doubled (covering ∼10%) and by 2040 quadrupled (covering ∼20%). Over the same period, more-extreme events will emerge: 5-sigma events, which are now essentially absent, will cover a small but significant fraction (∼3%) of the global land surface by 2040. These near-term projections are practically independent of emission scenario.
The rise in the frequency of extremes becomes strongly dependent on the emission scenario only by mid-century. Under the low emission scenario (RCP2.6), the number of extremes stabilizes at 2040-levels. This implies that in the tropics, including South America, western Africa and the Maritime continent, 3-sigma heat effectively becomes the new norm (about 50% of summer months, see figure 3) and 5-sigma heat will be common (about 20% of summer months). In the extra-tropics, 3-sigma extremes will also increase, occurring for example in western Europe in roughly 20% of summer months, but 5-sigma events will still be essentially absent. In the southern hemisphere, the increase in monthly heat extremes is essentially independent on the season. Here, the spatial patterns and magnitudes of the increase in frequency for austral summer extremes (DJF) are very similar to those for JJA (compare SOM figure 4, available at stacks.iop.org/ERL/8/034018/mmedia, with figure 3).
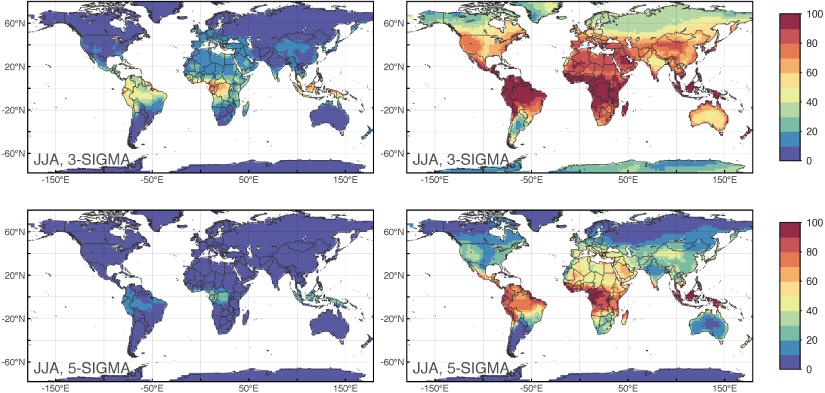
Figure 3. Multi-model mean of the percentage of boreal summer months in the time period 2071–2099 with temperatures beyond 3-sigma (top) and 5-sigma (bottom) under RCP2.6 (left) and RCP8.5 (right).
Download figure:
Standard image High-resolution imageUnder the high-emission scenario (RCP8.5), the area of land experiencing 3- or 5-sigma events grows by roughly 1% yr−1 after 2040. By 2100, 3-sigma heat covers about 85% and 5-sigma heat about 60% of the global land area. The occurrence-probability of months warmer than 5-sigma reaches up to 100% in some tropical regions. Over extended areas in the extra-tropics (Mediterranean, Middle East, parts of western Europe, central Asia and the US) most (>70%) summer months will be beyond 3-sigma, and 5-sigma events will be common.
To understand how threshold-exceeding extremes increase in a warming world, we compare the percentage of land covered by temperatures greater than a given sigma level with global mean temperature (figure 4). The CMIP5 data broadly follows a cumulative density function with a rapid onset of extremes at low temperatures (also seen in observations) followed by a more gradual asymptotic behavior towards maximum land fractions at high temperatures. This behavior can be understood with a first-order equation for the percentage of land area (A) covered by heat beyond a certain threshold (x):

Figure 4. Percentage of global land area during boreal summers with monthly temperatures beyond a specified threshold level in terms of standard deviation (sigma) versus the mean summer land surface temperature (primary horizontal axis) and the global annual mean temperature (upper horizontal axis) for GISS surface temperature data (black symbols), CMIP5 data (colored symbols) and equation (1) (solid lines).
Download figure:
Standard image High-resolution image
In this equation, which assumes Gaussianity of the underlying probability density functions, ΔT is the land-mean surface warming, σn is the mean monthly standard deviation over land due to natural variability (which is about 1 ° C for JJA), and x is the threshold level in units of sigma. σw captures the increasing variability, i.e. broadening, of the land temperature anomaly distribution curve due to spatially heterogeneous warming. Its value is estimated from the model output assuming that warming at any location scales linearly with ΔT (see supplementary material available at stacks.iop.org/ERL/8/034018/mmedia). Equation (1) shows that 50% of the land area will experience threshold-exceeding extremes beyond level x when ΔT = xσn. Thus, for 3-sigma events this happens at 3 ° C of land surface warming (2.2 ° C of global warming) and for 5-sigma events at 5 ° C of land surface warming (3.7 ° C of global warming). The rate of increase of the cumulative density curves depends both on σn, assumed to be constant, and σw, which increases for higher levels of warming. Since 5-sigma events appear at higher levels of warming, their rate of increase is smaller than more moderate extremes. This also affects the onset of extremes, i.e., the temperature anomaly at which a particular extreme first becomes detectable: the onset of the 5-sigma curve occurs at 1.5 ° C land surface warming, only 1.0 ° C warmer than the onset of the 3-sigma curve.
Equation (1) closely follows the center of the model spread over most land fractions for the lower threshold levels, with an overall RMSE of 3.7 percentage points. This implies that, on a global scale, the increase in extremes can largely be explained by equation (1), and thus by a shift in the mean of the local temperature distributions to warmer values, with spatially heterogeneous warming but essentially no change in the local variability. Land fractions of the 5-sigma threshold as predicted by the simple analytical equation begin to deviate from the mean model predictions above 20–30% land fraction slightly overestimating the land area compared to the mean model predictions (though the curve is still within the model uncertainty range). At such high levels of warming the basic underlying assumptions of equation (1) fail and non-linearities are likely to become dominant.
4. Discussion
Though recent heat waves in the northern hemisphere extra-tropics have received much scientific and media attention (Jones et al 2008, Rahmstorf and Coumou 2011, WMO 2011, Duffy and Tebaldi 2012, Otto et al 2012, Petoukhov et al 2013), it is the tropics that have actually seen the strongest increase in threshold-exceeding heat extremes, with the threshold defined by the historic variability. This can be explained by the relatively small year-to-year natural variability in the tropics. This is consistent with numerical studies that have highlighted the vulnerability of the tropics to such extremes (Diffenbaugh and Scherer 2011, Sillmann et al 2013). Here we report that this 'tropical fingerprint' can already be detected in surface temperature observations of the 2000–2012 period.
Apart from the tropics, the Mediterranean has also seen a strong increase in extremes in recent years (figure 1). Models project strong increases in heat extremes for this region by the end of the century (Sillmann et al 2013) (figure 3), but simulations of the historic period underestimate the number of heat extremes seen in observations (figure 1). The historic rise in heat extremes in the Mediterranean is accompanied by a long-term drying trend (Hoerling et al 2012). Possibly, the models either fail to reproduce this drying trend or underestimate the non-linear feedbacks between precipitation and temperature (Schär et al 2004, Coumou and Rahmstorf 2012).
We show that the frequency of summer months with extreme heat (3-sigma) and unprecedented heat (5-sigma) will strongly increase under expected future global warming. Even strong mitigation (RCP2.6) cannot stop the increase in occurrence-frequency of 3-sigma heat by a factor four in the near-term. Also, 5-sigma events will emerge and become common in some tropical regions. Mitigation however can strongly reduce the expected number of heat extremes in the second half of the 21st century. The impacts to societies and ecosystems of the projected increase in extremes beyond thresholds defined by the historic variability will be different depending on the region. In the tropics, natural variability is generally small and hence a 3-sigma event might not be a large anomaly in absolute temperatures. Also the vulnerability to extreme heat can differ strongly between regions (Bouwer et al 2007, Kershaw and Millward 2012, Bouwer 2013). Nonetheless, in general, society and ecosystems are adapted to extremes experienced in the past and much less so to extremes outside the historic range. For example, most of the 3-sigma extremes that have occurred in recent years resulted in serious impacts to society, causing many heat-related deaths, massive forest fires or harvest losses (Robine 2008, Karoly 2009, WMO 2011, Coumou and Rahmstorf 2012). Thus, the expected future increase in extremes beyond thresholds defined by the historic variability, as reported here, is likely to pose serious adaptation challenges. The metric used here can be useful to identify regions for which adaptation strategies are needed.
Acknowledgments
We thank two anonymous reviewers for constructive comments on an earlier version of this letter. We acknowledge the World Climate Research Programme's Working Group on Coupled Modelling, which is responsible for CMIP, and we thank the climate modeling groups for producing and making available their model output. For CMIP the US Department of Energy's Program for Climate Model Diagnosis and Intercomparison provides coordinating support and led development of software infrastructure in partnership with the Global Organization for Earth System Science Portals.