
Abstract
The influence of geometrical and operating parameters on the electrical characteristics of dc microcavity discharges provides insight into their controlling physics. We present here results of such a study on silicon-based microcavity discharge devices carried out in helium at pressure ranging from 100 to 1000 Torr. Different micro-reactor configurations were measured. The differences include isolated single cavities versus arrays of closely spaced cavities, various cavity geometries (un-etched as well as isotropically and anisotropically etched), various dimensions (100 or 150 µm cavity diameter and 0–150 µm depth). The electrode gap was kept constant in all cases at approximately 6 µm. The applied electric field reaches 5 × 10⁷ V m−1 which results in current and power densities up to 2 A cm−2 and 200 kW cm−3, respectively. The number of microcavities and the microcavity depth are shown to be the most important geometrical parameters for predicting breakdown and operation of microcavity devices. The probability of initiatory electron generation which is volume dependent and the electric field strength which is depth dependent are, respectively, considered to be responsible. The cavity shape (isotropic/anisotropic) and diameter had no significant influence. The number of micro-discharges that could be ignited depends on the rate of voltage rise and pressure. Larger numbers ignite at lower frequency and pressure. In addition, the voltage polarity has the largest influence on the electrical characteristics of the micro-discharge of all parameters, which is due to both the asymmetric role of electrodes as electron emitter and the non-uniformity of the electric field resulting in different ionization efficiencies. The qualitative shape of all breakdown voltage versus pressure curves can be explained in terms of the distance over which the discharge breakdown effectively occurs as long as one understand that this distance can depend on pressure.
Export citation and abstract BibTeX RIS
1. Introduction
For 'unique features resulting from their ability to sustain large current densities and power depositions on a continuous basis' [1] and evident reasons of lower cost and simplified operation in comparison with their low-pressure counterparts, high-pressure (about atmospheric pressure) plasma processes are of great interest [2]. In many technological applications, a non-thermal plasma operating in the glow mode is required [3, 4]. However, maintaining such a stable diffuse glow discharge plasma at high pressure is challenging due to their susceptibility to transition to an arc [5]. One way to stabilize such a high-pressure plasma is to spatially confine it to dimensions below about 1 mm, leading to the so-called world of microplasmas. The stable operation of a microplasma can be explained through the pd similarity law, where p and d represent, respectively, the pressure and the discharge gap (which corresponds to the electrode separation if care is taken to prevent 'long-path breakdown'). This Paschen law [6] states that the breakdown voltage depends on pd product instead of depending individually on p and d. At low pressure, stable operation of glow discharges is possible for pd in the range of about 1–10 Torr cm where the breakdown voltage is minimum. In this way, for stable operation at high pressure, one only needs to decrease the discharge gap while keeping the pd value in the same range to allow ignition at low voltages. Indeed, discharge operation is unstable at high pressure while keeping the same d as in the low-pressure case, which corresponds to pd values higher than 10 Torr cm. It is due to the high current density, particularly in the cathode sheath, which is a source of instability and may lead to the glow-to-arc transition (GAT). Also, the dominance of boundary phenomena in such microplasmas, with small volume-to-surface ratio compared with low-pressure plasmas probably plays a stabilizing role. However, in spite of pd similarity of the microplasma and its low-pressure counterpart, the current densities in the former one are much higher, making microplasmas not simply a scaled down version of a low-pressure plasma.
Many different microplasma types exist depending on the device structure and operating mode. Several reviews have already been published on that topic [7–9]. The present studied devices are of 'MHCD' (micro hollow cathode discharge) type. That acronym historically refers to a specific mode of discharge operation, the 'hollow cathode' mode in which the discharge has a negative differential resistance. The first 'MHCD' was obtained by scaling the well-known hollow cathode discharge to a submillimetre size [10] before it was shown [11] that the hollow cathode effect was not effective in the MHCD. Thus, that nomenclature might be misleading because that kind of micro-discharge is generally operated in the normal or abnormal glow mode. Some authors encourage instead the adoption of names such as 'microplasma', 'microcavity plasma' or 'microdischarge'.
Despite their interesting properties—stability, high-pressure operation, non-equilibrium, high power density—their small size could drastically limit their range of applications. However, it is possible to enlarge the plasma volume either by arranging such micro-discharges in arrays, by extending it when used as a plasma cathode with a third electrode positively biased and located some distance away [12] or using both techniques [13]. One method used to ignite arrays of micro-discharges is to limit the current driven by each micro-discharge through the use of either individual [14] or distributed [15] ballast resistors. Another way, without use of any ballast, is to 'force' the micro-discharge to operate under conditions where the slope of the V–I characteristic is positive, that is in an abnormal regime. This is possible by limiting the cathode surface area [10, 16, 17].
The first reported micro-discharge device fabricated in silicon consists in a single closed cavity 200–400 µm in diameter and 0.55 mm in depth [18]. Operated in dc and using the silicon substrate as the cathode, thus limiting the cathode area because of the finite cavity depth, it showed a stable operation in Ne and N2 from a few hundred Torr up to atmospheric pressure. Moreover the V–I characteristic exhibited a positive differential resistance over the entire current and pressure range. It opened the way to operation of silicon-based micro-discharge arrays. Shi et al [15] succeeded in igniting Si-integrated micro-discharge arrays (4 × 4) in dc, without limiting the cathode area, using silicon (resistivity of 1200 Ω cm) for anode material as a distributed resistive ballast. Many other studies have been carried out on silicon-based microplasma reactors, e.g. [19–21]. No systematic study of the influence of geometrical and operating parameters on breakdown and operation of microcavity discharges has been done yet. Chen et al [20] studied the operation of three different cavity shapes made within silicon with the same cross-sectional opening area. The conclusions concerning the influence of geometrical and operating parameters on the operation of the discharge are the following. Whatever the microcavity shape (planar, inverted pyramid or vertical cavity), experiments show that the higher the cathode surface the higher the current driven by the microcavity discharge for a given voltage. It is about one order of magnitude higher for the deepest cavity compared with the non-etched one. The operation of the non-etched cavities has been shown to be more sensitive to pressure compared with both etched ones, requiring more voltage to drive a given current as the pressure decreases. In the case of arrays, with the same microcavity shapes, the higher the number of cavities, the higher the total current driven for a given voltage. Concerning breakdown voltage, it has only been mentioned that in the case of arrays it does not vary significantly with the array size.
In our lab, we make use of conventional semiconductor micro-fabrication technologies to design microcavity reactors integrated in silicon substrate and take advantage of the intrinsically limited cathode area of the etched cavities to ignite arrays of micro-discharges [22]. The features of the present studied microdevices are the use of silicon as the micro-reactor cathode, the limitation of the cathode area (due to the closed cavity), the opening diameters from 150 to 25 µm and the use of a very thin dielectric thickness (∼6 µm) inducing an applied electric field as high as 5 × 10⁷ V m−1.
This study has been undertaken to better understand the influence of geometrical and operating parameters on the breakdown and operation of such microcavity discharges.
2. Experimental set-up
2.1. Micro-reactors
As an example, the upper portion of figure 1 shows the front view of a micro-reactor consisting in a 1024 microcavities array with opening diameter D = 100 µm. The chip is about 1.5 × 1.5 cm2. It consists of an electrode/dielectric/electrode sandwich structure containing cavities. Silicon substrate (n-type, resistivity of 5000 Ω cm) is used as one electrode and nickel as the other. SiO2 is used as the dielectric. The thicknesses of layers are about 6, 6 and 500 µm for the nickel, the SiO2 and the silicon, respectively. Figure 1 (upper part) shows three different square zones. The inner and intermediate ones are both the nickel layer and the third one is the silicon oxide layer. Both the intermediate one and the outer one are covered with photoresist to prevent edge breakdown. The fabrication process used has already been detailed [22, 23]. Several micro-reactor configurations are realized as single cavity, 16 × 16 = 256 and 32 × 32 = 1024 cavities arrays with different opening diameter and a few others which have not been used in this study. The cavity opening diameter is ranging from 25 to 150 µm. For array configurations, the distance between cavities, from edge to edge, is the same as the corresponding cavity diameter. The cavity shape can be isotropic or anisotropic (figure 1 (bottom)) depending on the etching process used [22]. Using the anisotropic process, it is possible to etch cavities to a depth of a few hundred micrometres or even through the silicon substrate. The volume of such a cavity is of the order of a few 10−3 mm3.
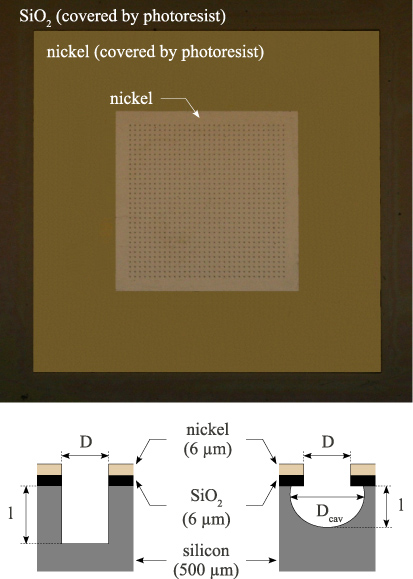
Figure 1. (top) Front view of a 1024 microcavities array with D = 100 µm; (bottom) cross-sectional view of the structure of both types of cavity.
Download figure:
Standard image2.2. Electrical circuit and experimental procedure
The experiments are carried out in a ∼2 litre stainless-steel cylindrical chamber. It is equipped with a pumping system (diaphragm and molecular pumps) allowing the chamber to be evacuated to a few 10−6 mbar. A gas input system allows experiments in different gases or mixture of gases (proportions controlled by partial pressure). Pressures could be set from a few tens to 1000 Torr. It is also equipped with an electrical input for the connection with the power supply/measurement circuit, a few windows for the operating control of the discharge and optical diagnostic and a micro-reactor positioning system. In this study, experiments are performed with helium within the pressure range 100–1000 Torr. A Baratron gauge and a Pirani gauge are used for measurement of working and base pressures respectively.
The micro-reactors are powered using a dc power supply. The electrical set-up is complemented with equipment for measurement of electrical parameters. The powering/measurement electrical circuit is shown in figure 2. The powering part includes a 1500 V/150 mA dc power supply unit and a ballast resistor Rb to limit the current. For the present experiments Rb = 39 kΩ. The power unit can be controlled manually or using an external function generator. The function generator was used to generate a triangular voltage signal for acquiring the V–I characteristics and for breakdown voltage measurements. To obtain the V–I characteristics for both increasing and decreasing current, the discharge voltage and current are acquired during one period of the triangle wave. For the determination of the breakdown voltage, the acquisition of discharge voltage and current during eight periods was made in order to obtain an average value, for each pressure. The signal frequency used for V–I characteristic acquisition f is either 50 mHz or 200 mHz depending on the study. For breakdown voltage determination, f = 200 mHz in all cases which corresponds to a voltage rate of about 200 V s−1. The measurement part of the circuit includes a resistance in series with the micro-reactor for its current measurement Rm = 1 kΩ, a digital oscilloscope and high voltage probes for voltage measurements. The anode VA and cathode VC voltages are recorded. The discharge voltage Ud = VA−VC and current Id = VC/Rm are deduced from those measurements. On the breakdown voltage versus pressure curve Vbr = f(P), each plotted point represents the average of eight voltage values. The error bars, shown on all graphs, are considered as random errors and obtained considering Gaussian distribution of experimental values and taking the width of the approximated distribution profile. That uncertainty in measurement is calculated individually for each pressure to check for a possible dependence of the distribution width on pressure.
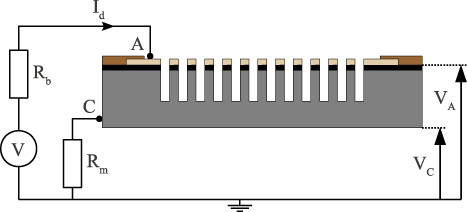
Figure 2. Powering and measurement circuit.
Download figure:
Standard image3. Results
3.1. Geometrical parameters
3.1.1. Cavity shape
To investigate the influence of the cavity shape on the operation of micro-reactors, we have tested two micro-reactors with the same configuration, that is arrays of 32 × 32 = 1024 cavities with opening diameter D = 100 µm, but with different cavity shapes. One is anistropically etched and the other isotropically etched as shown in figure 3 after operation. Note that the complete micro-reactor structure (electrode set separated with dielectric) is not visible in the pictures because the nickel electrode has been removed during the cleavage of the micro-reactors. The upper layer corresponds to the dielectric (SiO2) and the lower one, holding the cavity is the Si electrode. The geometrical features of cavities of both types of micro-reactors are indicated in table 1. For calculation of each cavity cathode surface area and cavity volume, they are considered either as cylindrical (anisotropic cavity) with diameter Dcav = D = 100 µm and depth l = 150 µm or as hemispheric (isotropic cavity) with diameter Dcav = 130 µm (due to a symmetrical undercut of about 15 µm). The cathodic surface and volume of the isotropic cavity are both half the anisotropic ones. Breakdown voltage measurements have been done in helium at a pressure ranging from 50 to 1000 Torr. The electrodes separation (dielectric thickness) is about 6 µm for all the micro-reactors tested in this study which corresponds to a range of the pd product, for the anisotropic case of 0.03–0.6 Torr cm. Actually, these values are given as an indication but are not well defined because of the non-uniformity of the electric field. For that reason and the non-similarity of electric field of the different studied cases, the breakdown voltage curves are presented with respect to pressure. In the isotropic case, due to an undercut of about 15 µm and if we consider the electrode gap as the shortest distance between electrodes, i.e. d ∼ 20 µm, the corresponding pd range is 0.2–2 Torr cm. With respect to the well-known Paschen's curve for breakdown voltage, in the case of parallel plane electrodes, in helium gas, we are located, in both cases in the region of the left branch
 . Figure 4 shows the averaged breakdown voltages Vbr versus pressure P for both types of micro-reactors. We can immediately note that, although the cavity shapes are very different, the corresponding breakdown curves versus pressure are very similar and match quite well, with a small tendency for higher values for the isotropic case. Generally speaking, during each voltage period, a few micro-discharges ignite one after the other and operate together at the highest driven current, which ranges between a few mA to 20 mA maximum (in order to not damage the micro-reactors). Their number varies from one to five and remains very small with respect to the total number in the arrays (1024). For determination of breakdown voltage curves, only the first breakdown voltage values of each ramp have been used. Figures 5 and 6 show the discharge voltage and current versus time and the corresponding V–I curves, obtained in He at P = 500 Torr for anisotropic and isotropic cavity micro-reactors respectively during one period of powering voltage signal. There are similarities in both cases. First, after breakdown has occurred, the micro-discharge enters in an abnormal glow regime, with a linear increase in discharge voltage with current. The immediate entrance in abnormal regime (which is one of the necessary conditions for operation of micro-discharge array [17]) is due to the intrinsic limited coverage of the cathode surface inside the microcavity. The extension of the cathode sheath area being limited by the cavity surface, the discharge current Id can only increase if the externally applied voltage increases. Second, the abnormal regime allows successive ignition of a few micro-discharges in both cases. We can notice that, even if the number of ignited discharges remains small in both cases, the tendency in the isotropic case is to ignite more micro-discharges (generally, two times more: 4 compared with 2). On the other hand, the voltage drop after the successive ignitions is in general lower in the isotropic case, which is characterized by an abnormal regime whose differential resistance is slightly higher (r ∼ 25 kΩ) compared with the anisotropic cavity (r ∼ 17 kΩ). That difference in differential resistance might be due to the smaller cathode surface in the case of isotropic cavities (steeper abnormal regime in that case). This can explain the slightly higher number of micro-discharges ignited in the isotropic case because it is faster in that case to reach again the breakdown voltage. The voltage drop after breakdown, i.e. the gap between breakdown voltage and the sustaining voltage immediately after breakdown, together with the differential resistance of the abnormal regime are key parameters for ignition of micro-discharges in parallel. But those differences do not seem to come as much from the cavity shape (anisotropic/isotropic) as from the available surface area of the cathode surface. Indeed, as indicated in table 1, the cathode surface in the isotropic case is half of that in the anisotropic case and Dufour et al [17] have shown that the smaller the cathodic surface, the more emphasized the abnormal glow regime. Concerning the ignition of microcavity discharges in array configuration, it is worthwhile to say that we could probably control the number of ignited micro-discharges with variation of the slope and amplitude of the voltage ramp.

Figure 3. SEM cross-section views of anisotropic (a) and isotropic (b) D = 100 µm opening diameter cavity after operation.
Download figure:
Standard image
Figure 4. Breakdown voltage Vbr versus pressure P for the two micro-reactors (1024 array with D = 100 µm) with different cavity shapes: anisotropic and isotropic.
Download figure:
Standard image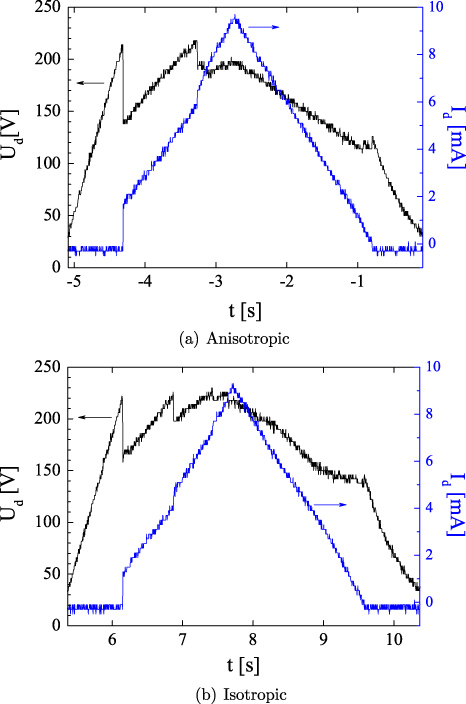
Figure 5. Discharge voltage and current versus time for the 1024, D = 100 µm cavities array micro-reactor, in both anisotropic (a) and isotropic (b) cases, during a period of the voltage power supply (f = 200 mHz, T = 5 s), in He at P = 500 Torr.
Download figure:
Standard image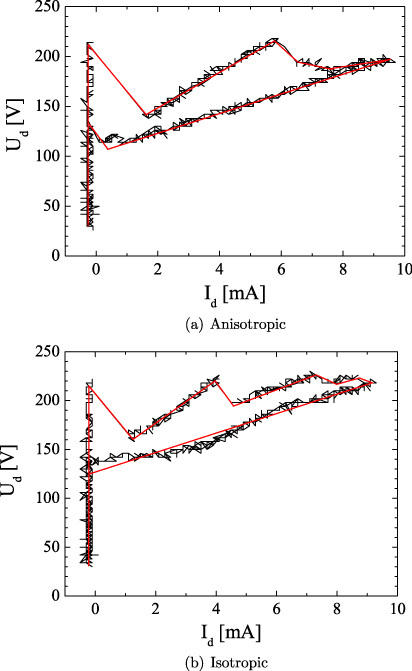
Figure 6. IV curves for the 1024 D = 100 µm cavities array micro-reactor, in both anisotropic (a) and isotropic (b) cases, during a period (f = 200 mHz, T = 5 s), in He at P = 500 Torr.
Download figure:
Standard imageTable 1. Geometrical features of the cavities (shown in figure 3) of the micro-reactors (32 × 32 = 1024 with D = 100 µm) used for cavity shape study; D: opening diameter, dn: distance to the nearest neighbour cavity, Dcav: inner diameter, l: depth, Scath: wall surface (cathode surface), V: volume.
| D (μm) | dn (μm) | Cavity type | Dcav (μm) | l (μm) | Scath (mm2) | V (mm3) |
|---|---|---|---|---|---|---|
| 100 | 100 | Anisotropic | 100 | 150 | 0.055 | 1.18 × 10⁻³ |
| 100 | 100 | Isotropic | 130 | 75 | 0.027 | 0.58 × 10⁻³ |
3.1.2. Micro-reactor configuration
The influence of the micro-reactor configuration on both breakdown and operation of micro-discharges has been studied using three micro-reactors consisting of identical cavities but with different configurations: 1024 cavities array, 256 cavities array and single cavity. The cavities are identical in shape (anisotropic) and dimensions (diameter D = 100 µm, depth l = 150 µm). The breakdown voltage curves versus pressure obtained in helium for pressure ranging from 100 to 1000 Torr are shown in figure 7(a). Qualitatively the three curves have the same shape and also the same shape as those obtained in the study of the cavity shape. Nevertheless, the values of breakdown voltage for the single-cavity configuration is about 100 V higher than that for the two array configurations over the full pressure range. Two hypotheses may be given to explain this observation. The first one originates from the fact that gaseous electrical breakdown is a stochastic process. That is to say: its actual occurrence depends on the probability that an initiatory/seed electron will be available and that it will lead to an avalanche of sufficient size for the development of a conductive breakdown channel in the gas. That initiatory electron must be available in a suitable location (preferably close to the cathode) for maximum electron amplification. As we already stated, the measurement of the breakdown voltage is carried out by powering the micro-reactor using an increasing voltage ramp. The rise time is 2.5 s. During this period, the discharge can only be ignited if the electron density reaches a critical value. The real time needed to reach that critical value after the voltage has reached the minimum static breakdown voltage, Vs, that is the lowest breakdown voltage which would ignite the discharge after a sufficiently long application time, is the breakdown delay time [24]. It is statistically distributed and consists of two parts t = ts + tf: the statistical time ts which is the time that elapses from the moment when Vs is reached until an initiatory electron appears in the high-field region to initiate the discharge, and the formative time tf which is the time required for the breakdown to develop once initiated. The overvoltage is the difference (Vp − Vs) between the peak voltage Vp, at which breakdown is measured, and the minimum static breakdown voltage Vs. The statistical time ts depends on the amount of preionization in the gap which in turn depends upon the size of the gap and the sources producing the seed electrons. In our case, no external source exists, and the initiatory electrons originate only by natural external ionizing radiation, i.e. cosmic rays and natural radioactivity of materials. The rate of initiatory electron generation by such external radiation is about 4 × 10⁻⁵ electrons s−1 cm−3 Pa−1 in most gases [25]. At atmospheric pressure (∼105 Pa), the electron generation rate in each cavity with a volume of about ∼10−3 mm3 is about 4 × 10⁻⁶ s−1 which corresponds to a prohibitively long statistical time. In the case of the 1024 cavities micro-reactor, the electrons generation rate in the volume corresponding to the sum of the 1024 cavity volumes (which are powered in parallel) is about 103 higher. The probability for initiatory electron generation in the array case is 103 higher and the statistical time ts in that case could be reduced compared with the single-cavity case. This could induce a lower overvoltage and explain the difference of breakdown voltage in figure 7. However, that much smaller statistical time for single cavity should be accompanied by larger error bars than for 1024 cavities which is not observed. That huge difference in initiatory electrons' generation rate and consequently in the statistical time between array and single case is not met in the breakdown voltage. This could be due to the fact that ts decreases with increasing overvoltage [24]. The second hypothesis is the possible presence of electron field emission. The voltage, just before breakdown is about 220 V for both the 1024 and 256 microcavities array and is applied through a 6 µm thick dielectric which corresponds to an electric field of about 5 × 10⁷ V m−1. The possible presence of cathode surface ripples (scalloping) of a few tens of micrometres, due to alternating between etching and passivation steps in the etching process [23], would enhance locally the electric field and could induce electron field emission. The probability of encountering such surface irregularities might be higher in the array case compared with the single-cavity case. The field emission effect could reduce the statistical time and consequently the overvoltage by providing seed electrons.
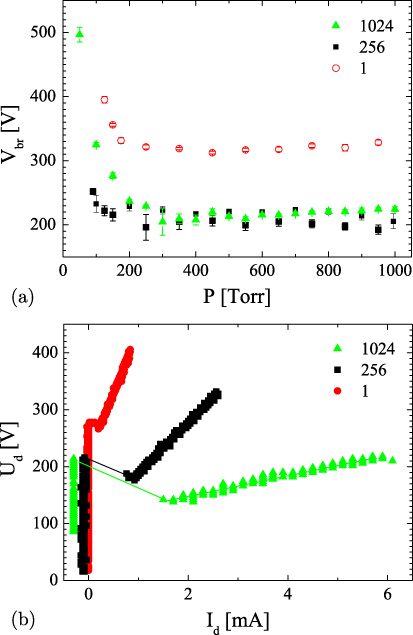
Figure 7. Electrical characteristics of three different micro-reactor configurations consisting of same cavities (anisotropic, D = 100 µm, l = 150 µm): (a) breakdown voltage versus pressure and (b) V–I curves at P = 500 Torr, in helium, for f = 200 mHz.
Download figure:
Standard imageFigure 7(b) presents the V–I curves corresponding to the three micro-reactors. As already observed in figure 7(a), the breakdown voltage of both array micro-reactors is similar to each other, of the order of 220 V and much less than that of the single-cavity micro-reactor. As expected from the limitation of the cathode area, the discharge enters in an abnormal regime in the three cases. But this abnormal regime depends on the configuration. It is less pronounced when the number of cavities increases. In other words, the differential resistance characterizing the abnormal regime in which the first ignited discharge enters, decreases as the number of cavities increases. Moreover, the voltage drop after breakdown differs depending on the configuration. The field emission effect by itself could explain as an additional electron source both observations. For exactly the same cavity features, depending on the micro-reactor configuration, the maximum current driven by a single cavity is quite different. It is 1, 2.5 and 6 mA for the 1, 256 and 1024 cavities micro-reactor, respectively. It is worth noting that, despite exhibiting a smaller voltage drop and a larger slope in the abnormal regime than the 1024 cavity array, only one micro-discharge in the 256 cavity array ignited. We speculate that this could be due to the stochastic nature of gas breakdown.
3.1.3. Cavity opening diameter
Here we report results obtained varying the cavity opening diameter. In the case of anisotropically etched cavities, the opening diameter is equivalent to the inner cavity diameter. The influence of that parameter on the electrical discharge characteristics has been studied using a multi-diameter micro-reactor consisting in anisotropic cavities l = 150 µm deep. For that case, two diameters D = 100 and 150 µm have been tested. The geometrical characteristics of both cavities are indicated in table 2. For surface and volume calculations, the cavity was considered to be cylindrical. The corresponding breakdown curves with respect to pressure and the I–V curves at 500 Torr are shown in figures 8(a) and (b), respectively. The breakdown voltage curves match quite well over the full pressure range. For that type of cavity (anisotropic l = 150 µm deep), experiments show that the cavity opening diameter does not influence the breakdown voltage. 2D axisymmetric electric field simulation using the finite element method (FEMM [26]) shows that opening diameter does not influence the geometrical electric field strength distributions significantly. The I–V curves of figure 8(b) show that a single micro-discharge ignites in both cases and the abnormal regime in which it enters does not depend on diameter. However, we also observed in other experiments, considering diameter ranging from 25 to 150 µm that opening diameter does have an influence on ignition. The smaller diameter cavities tend to ignite first at higher pressures while bigger diameter cavities ignite preferentially at lower pressures.

Figure 8. Electrical characteristics of two 256 cavity arrays having the same cavity shape and depth (anisotropic, l = 150 µm) but different diameters (D = 100 and 150 µm): (a) breakdown voltage versus pressure and (b) I–V curves at 500 Torr, in helium, for f = 200 mHz.
Download figure:
Standard imageTable 2. Geometrical features of the cavities of the two micro-reactors (16 × 16 = 256) used for cavity opening diameter study; D: opening diameter, dn: distance to nearest neighbour cavity, l: depth, Scath: wall surface area (cathode surface), V: volume.
| D(μm) | dn (μm) | l(μm) | Scath (mm2) | V(mm3) |
|---|---|---|---|---|
| 100 | 100 | 150 | 0.055 | 1.18 × 10⁻³ |
| 150 | 150 | 150 | 0.088 | 2.65 × 10⁻³ |
3.1.4. Cavity depth
The influence of cavity depth has been tested using two micro-reactors having the same configuration (1024 cavities arrays, diameter D = 150 µm, but with different cavity depths, l = 70 µm and l = 0 µm (non-etched)). The breakdown voltage curves between 100 and 1000 Torr and the corresponding I–V characteristics at 500 Torr are shown in figure 9. What is quite obvious is the much lower (60–70 V) breakdown voltage for the non-etched (0 µm deep) cavity micro-reactor compared with the etched one. It is approximately 160 V over the pressure range (200–1000 Torr), the curve shape being qualitatively the same as that of the etched cavity. Some effect must compensate the higher statistical time expected in the non-etched case due to a lower electron generation probability (because of the smaller cavity volume) which should have increased the breakdown voltage. The most straightforward explanation could come from the difference between electric field strength distribution in the etched and non-etched cases. 2D axisymmetric simulation of geometrical (before breakdown) electric field using the finite element method [26] shows similar electric field strength distributions for voltage drop Vac between electrodes of 225 and 160 V for the 70 µm deep and non-etched cavities respectively. Figure 10 shows the electric field strength distribution with isovalues in the range 0–5 × 10⁶ V m−1. The darker zone thus corresponds in both cases to an electric field strength higher than 5 × 10⁶ V m−1. From that plot, it can be seen that the electric field distributions are quite similar in both cases. Compared with the non-etched cavity, 65 V more in voltage drop between electrodes is required for the etched cavity to obtain similar electric field distribution. They could consequently provide similar conditions for electron multiplication.
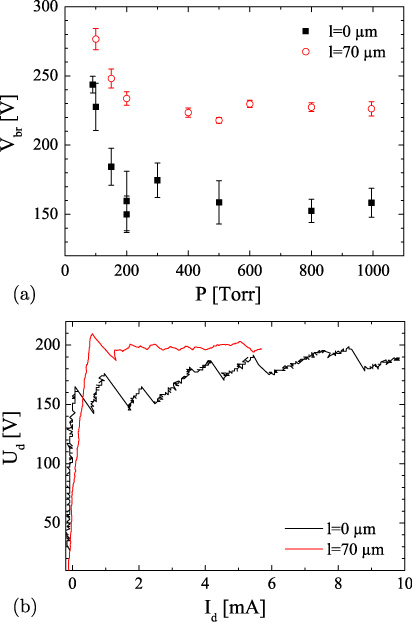
Figure 9. Electrical characteristics of two 1024 cavities arrays with same cavity shape and diameter (anisotropic, D = 150 µm) but different depths l = 70 and 0 µm: (a) breakdown voltage versus pressure and (b) V–I curves at P = 500 Torr, in helium, for f = 200 mHz.
Download figure:
Standard image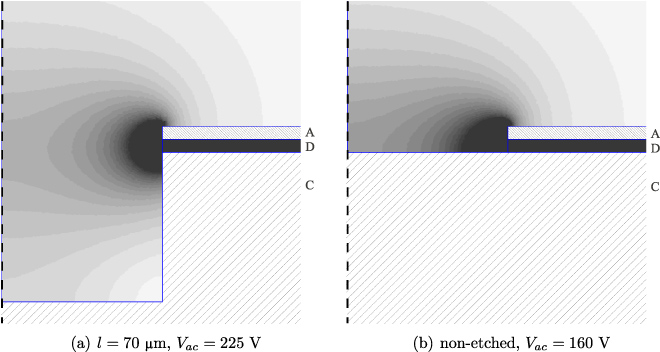
Figure 10. 2D geometrical electric field in a single cavity with diameter D = 150 µm; A (nickel), D (SiO2) and C (silicon) stand for anode, dielectric and cathode respectively; the dotted line represents the cylindrical symmetry axis; the darker zone in the electric field strength distribution corresponds to values higher than 5 × 10⁶ V m−1.
Download figure:
Standard image3.2. Operating parameters
3.2.1. Rate of the voltage ramp
All I–V curves presented in the last sections are obtained by applying a triangular voltage waveform to the micro-reactors and acquiring the discharge voltage and current signals over one period. Therefore, we have investigated the influence of the voltage rate of rise on the I–V characteristics by varying the waveform frequency (period) while keeping the amplitude constant. Measurements have been carried out using a 1024 array of D = 100 µm isotropic cavities as shown in figure 3(b). Figure 11 is a plot of the I–V curves, obtained for two different frequencies, f = 50 and 200 mHz, in He at 500 Torr. Those waveform frequencies correspond to waveform period T = 20 s and 5 s, respectively, and voltage rise rates of 60 V s−1 and 240 V s−1, respectively. First, the number of micro-discharges which ignite depends on the voltage rate of rise. It increases with decreasing rate of rise: three cavities ignited for f = 200 mHz while eight ignited for 50 mHz. The longer the waveform period, the larger the number of ignited micro-discharges. This can be explained through the statistical generation time ts (section 3.1.2). For the same initiating electron generation rate from natural sources (same micro-reactor configuration, same cavity volume, same pressure), the probability of appearance of electrons is higher in the case when the voltage application time is longer.
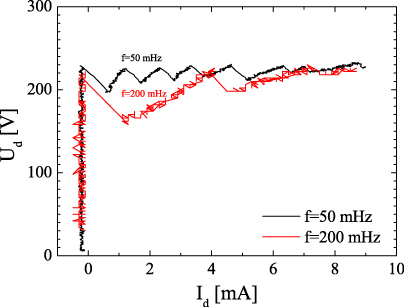
Figure 11. I–V characteristics of a 1024 cavities array micro-reactor with isotropically etched cavity with diameter D = 100 µm (figure 3(b)) obtained in helium at P = 500 Torr for two different voltage signal frequencies f = 200 mHz (T = 5 s) f = 50 mHz (T = 20 s).
Download figure:
Standard image3.2.2. Pressure
To test the influence of pressure on operation of micro-reactors, we used the same micro-reactor as in section 3.2.1. The I–V characteristics have been obtained in helium for pressure ranging from 100 to 1000 Torr from which the I–V curves at two representative pressures have been plotted in figure 12(a). Here, the waveform frequency is f = 50 mHz. Only the increasing phase of the voltage waveform is shown in figure 12 (that is half the period: T/2 = 10 s) in order to emphasize the effect on micro-discharge ignition. For the same voltage rate of rise (same signal frequency f = 50 mHz and same amplitude), the number of micro-discharges which ignite (indicated by arrows) during that time interval varies with pressure, more ignite at lower pressure. The time interval between successive ignitions being quite constant at a given pressure, we can speak in terms of ignition frequency. In other words, the ignition frequency decreases as the pressure increases as shown in figure 12(b). That tendency has also been observed for anisotropic cavities. The efficiency of the ionization process is known to depend on the reduced electric field, E/n, which decreases with increasing pressure as we observed.

Figure 12. Influence of helium pressure on ignition of a 1024 cavities array micro-reactor with isotropically etched cavities with diameter D = 100 µm and depth l = 150 µm (figure 3(b)): (a) V–I characteristics (the arrows indicate microcavity discharge ignition: the small ones for 500 Torr and long ones for 750 Torr), (b) microcavity discharge ignition frequency, for the same voltage rate (f = 50 mHz).
Download figure:
Standard image3.2.3. Polarity
All the results have been obtained so far by biasing negatively the silicon (which we will term 'direct' polarity). As we explained in section 1, the reason is it takes advantage of the inherent limitation of the cavity surface area to force the micro-discharge to enter an abnormal glow regime and ignite many micro-discharges in parallel. We studied the effect of polarization on the electrical characteristics of micro-reactors and the results obtained using a single cavity (anisotropic, D = 100 µm, l = 150 µm) are presented in figure 13. The breakdown voltage is clearly higher over the full pressure range for reverse polarization. By reversing polarities, we change the cathode from silicon to nickel. It is known that the cathode material and topography affects the breakdown voltage. The secondary emission coefficient, γ, of the material, which provides information on the efficiency of electron emission from the cathode due to ion bombardment, can have a large impact on the breakdown voltage [27]. The surface roughness of the nickel layer and silicon cavity might also influence the electron emission and consequently the breakdown voltage. It is noteworthy that these results were obtained using a previously tested micro-reactor rather than a new one. Indeed, the cathode surface topography evolves with operation time and may give results which have some level of variance. A rougher surface in the used micro-reactor case could enhance the emission of electrons from the cathode surface through field emission, thus reducing the breakdown voltage as observed in figure 13(a). On the other hand, we note the close correlation with figure 7(a). This indicates that the single cavity of these experiments was not unduly affected. In addition, it has already been shown [28] that the electrode polarity, when using non-uniform field, could have a large influence on the breakdown voltage. Concerning the I–V characteristics, first, the two different polarizations give two different shapes of curves. Compared with the direct polarization where the discharge is clearly in an abnormal glow regime identified by its positive slope I–V relationship, the reverse polarity is clearly in a normal glow regime as can be seen by the nearly zero slope of the I–V relationship and was expected. It is due to the possibility for the discharge, in the reverse polarity case compared with the direct one, to spread over the cathode surface when increasing current, keeping constant the current density. Second, the order of magnitude of the maximum current driven by the single micro-discharge is very different depending on polarities. It is approximately 20 times larger in the reverse polarity case. The dependence of secondary electron emission on cathode material and topography can be proposed as an explanation, but the difficulty of finding the secondary electron emission coefficients for both materials makes the explanation speculative. The non-uniform electric field distribution in the present electrode configuration could produce, by changing polarities, different ionizing efficiency due to differences in charges trajectories, which has already been stated in 2D electric field distributions [28].
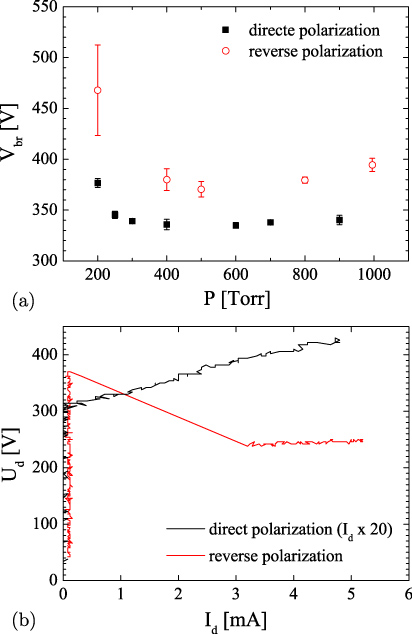
Figure 13. Electrical characteristics of a single-cavity micro-reactor (anisotropic, D = 100 µm, l = 150 µm): (a) breakdown voltage versus pressure and (b) I–V curves at P = 500 Torr, in helium for direct and reverse electrode polarization, for f = 200 mHz.
Download figure:
Standard image4. Discussion
All breakdown voltage curves versus pressure, obtained by varying cavity shape, diameter, depth, micro-reactor configuration and polarization have the same qualitative shape. They all present two distinct parts: at small pressures, basically below 200–300 Torr, the breakdown voltage rapidly increases with decreasing pressure and at high pressure >200–300 Torr, the breakdown voltage remains almost constant.
Paschen [6] has shown experimentally, in the case of parallel electrodes (uniform electric field), that, for a given gas and cathode material, the breakdown voltage Vbr only depends on the product pd(p: pressure, d: electrodes gap). We must point out that the relationship Vbr = f(pd) is valid only for a given temperature and that for a more general applicability, that is to be valid in case where temperature is varying, it should be written in terms of nd, where n is the number density of gas, in order to have a temperature-independent relationship. Here we assume that, during the measurement of the breakdown voltage, the temperature is constant, that is we can speak in terms of pressure without ambiguity. The theoretical model he used to explain that dependence, based on electronic avalanche phenomenon, takes into account two physical processes. One is a volume process which occurs in the electrode gap (electronic impact ionization). The other is a surface process and occurs at the cathode surface (secondary electron emission). Each of these processes is characterized by a parameter, respectively the ionization coefficient (first Townsend coefficient α) and the secondary electron emission coefficient of the cathode (second Townsend coefficient γ) which both depend on the reduced electric field E/p. The second process is necessary for maintaining the discharge since otherwise the initial population of electrons (produced by the first process) would be quickly collected by anode and not replaced fast enough to sustain the discharge. The breakdown or the self-sustaining condition depends on both those parameters through the relation γ[m − 1] = 1 where m = exp(∫Sα(s) ds) = exp(αd) is the electronic multiplication. Using the semi-empirical expression α/p = f(A, B, E/p) for the ionization coefficient, where A and B are gas dependent and determined experimentally, the breakdown voltage can be written
 . It follows that for a given electrode system with cathode material (with a specific γ) and a given gas (with specific A and B coefficient), Vbr is only a function of the product pd.
In the case of a parallel electrode system, the distance over which the discharge occurs is well defined—assuming care has been taken to prevent long-path breakdown for low values of pd(which correspond to the left branch of the Paschen curve). This distance corresponds to the electrode separation d because electrons will drift in the electric field direction, which in this case is perpendicular to the electrodes. With such a system, it is possible to get the pd dependence of Vbr due to the possibility to fix independently p and d.
In the microcavity case, despite a well-defined electrode separation which is the thickness of the dielectric, it is difficult to define accurately the effective discharge gap d for breakdown. The distance over which the discharge occurs might change, depending on the pressure, allowing a low breakdown voltage even if the pressure changes from the value that favours the minimum electrode spacing. Indeed, from the Paschen model, there exists a value (pd)min of the pd parameter, for which the breakdown voltage is minimal. It corresponds to a value of the reduced field (E/p)min = B which corresponds to an optimum electron energy giving a maximum ionization probability. Thus, the conditions for breakdown are the easiest at (pd)min because the conditions for electron multiplication are optimal. For helium, in the parallel electrode configuration, (pd)min ∼ 5 Torr cm.
It follows that, in the same way, there should exist in the present electrode configuration, a value
 providing optimal conditions for breakdown with minimal breakdown voltage. It means that for a given pressure p, the discharge should strike over a distance d such that
 . The geometry of the micro-reactor used here (height of the cavity side wall) is such that the gap width over which the discharge can ignite varies over a certain range. It means that for two different pressures p1 and p2 > p1 the distance d over which the breakdown occurs can adapt itself to d1 and d2 < d1, respectively in such a way that the parameter pd remains constant:
 permitting the lowest breakdown voltage
 . This should be possible within a certain pressure range. In this study, that range is 300–1000 Torr. Beyond, limitations should appear which would probably induce an increase in the breakdown voltage. At a certain higher pressure, the discharge gap for breakdown could not be reduced more, limited by the electrode separation. For a pressure even higher, the pd parameter could not be kept constant and would increase, inducing, according to the Paschen model, an increase in breakdown voltage. At pressure lower than about 200–300 Torr, the observed increase in breakdown voltage with decreasing pressure may be explained in terms of limitation of the breakdown distance gap. Indeed, due to some geometrical limitations, d cannot further increase while decreasing pressure, leading to a decrease in the pd parameter inducing, still according to the Paschen model, an increase in breakdown voltage.
5. Conclusion
Breakdown of micro-discharges ignited in silicon cavities has been studied. Different micro-reactor configurations, cavity shapes, sizes and operating conditions have been investigated. The cavity shape (whether anisotropic or isotropic) as well as the cavity opening diameter have been shown not to be important parameters determining breakdown voltage. No significant influence by either of those parameters was observed in breakdown voltage or in the I–V characteristics. In contrast, the configuration and the cavity depth have a big influence on both measurements. The delay time and electron field emission have been proposed as explanations of the differences in breakdown voltage in the three investigated configurations. Also, much lower breakdown voltages have been obtained for non-etched cavities as compared with etched cavities. As shown by finite element modelling, the geometrical electric field distribution might enhance electron multiplication in non-etched cavities. Moreover, changing the voltage rate of rise or the pressure has been shown to have an impact on the number of micro-discharges that could be ignited. This can be explained through arguments utilizing the delay time and the reduced electric field, respectively. Finally, the difference in breakdown voltage and I–V characteristic observed when inverting polarization was found to be due to the different cathode materials and surface topography as well as the non-uniformity of the electric field.
Acknowledgments
This work is financially supported by the French Agence Nationale de la Recherche through the contract No ANR-09-JCJC-0007-01 under the name SIMPAS project and supported by the RENATECH network. We would like to thank CTU-IEF team for their valuable help.