Abstract
This paper presents the design, microfabrication, modeling and characterization of a piezoelectric energy harvester (PEH) system with a wide operating bandwidth introduced by mechanical stoppers. The wideband frequency responses of the PEH system with stoppers on one side and two sides are investigated thoroughly. The experimental results show that the operating bandwidth is broadened to 18 Hz (30–48 Hz) and the corresponding optimal power ranges from 34 to 100 nW at the base acceleration of 0.6g and under top- and bottom-stopper distances of 0.75 mm and 1.1 mm, respectively. By adjusting the mechanical stopper distance, the output power and frequency bandwidth can be optimized accordingly.
Export citation and abstract BibTeX RIS
1. Introduction
Advances in autonomous sensors open many promising application fields in environment control and monitoring, emergency response, and healthcare monitoring. An embedded autonomous system which includes wireless sensor nodes normally has no access to an outside power source. Hence, an onboard power supply is necessary. Energy harvesting from the ambient environment provides an attractive solution as it offers a clean and regenerative power source in comparison with a battery which has a limited life span [1–3]. Vibration-based energy harvesters (EHs) transform ambient kinetic energy into electric power using piezoelectric, electromagnetic and electrostatic mechanisms [4–10]. Although environmental vibrations are ubiquitous and sufficient for scavenging, the practical application of vibration-based EHs is limited by the following factors. Firstly the ambient available vibrations are of low frequency; secondly different vibration sources provide vibrations of different frequencies and amplitudes; thirdly most of the generated amplitudes from these vibration sources are small due to the small acceleration available; and finally vibrations from different sources normally contain various cyclic movements in different directions.
Most EHs have been designed to vibrate at relatively high resonant frequency in order to achieve high output power [11–15], since the power efficiency is proportional to the vibration frequency, which needs to match with their resonant frequency. From the studies of Roundy et al [16] and Miller et al [17], most environmental vibrations are in the low frequency range (<200 Hz) with low level acceleration ( < 1g). In order to achieve a significant power level at a relatively lower frequency, the frequency up-conversion (FUC) approach has been proposed by Kulah and Najafi [18]. The prototype employs a magnet attached to a diaphragm moving at a low frequency vibration. The magnet periodically catches and releases a magnetic strip mounted on a cantilever, resulting in a high frequency self-oscillation of the cantilever and hence increasing the efficiency of the energy harvesting. A microfabricated version of this device was also reported by Sari et al [19]. Galchev et al [20, 21] subsequently developed electromagnetic and piezoelectric EH devices using a bi-stable mechanical structure with similar magnetic-based up-conversion mechanisms. The main disadvantage of these structures is the extra requirement of bulky magnets, leading to large device volume and a complicated process of fabrication and assembly. Zorlu et al [22] demonstrated a novel FUC method eliminating the use of an extra magnetic mechanism. The self-oscillation of the high frequency cantilever was realized by directly impacting and releasing from the low frequency diaphragm. However, this method has not been implemented in a real device.
The maximum power generated for rectification and storage occurs only when the environmental vibration falls within the bandwidth near the resonant frequency of the EH. Outside this bandwidth, the output power drops dramatically and is too low to be utilized. In situations where the environmental vibrations are irregular and within a frequency range, vibration-based EHs with various frequency-tunable or frequency-widened-bandwidth (FWB) mechanisms have been developed. Leland and Wright [23] proposed a tunable-resonance EH by applying axial compressive loads to a piezoelectric bimorph in order to lower its resonant frequency. Challa et al [24] designed a piezoelectric cantilever with magnets placed around it such that the attractive or repulsive magnetic force could be applied to shift the center frequency of the cantilever. Sebald et al [25] presented a duffing oscillator with strong nonlinear frequency response behavior used for energy harvesting by placing magnets above and below the piezoelectric cantilever. Soliman et al [26, 27] developed an electromagnetic EH prototype with FWB behavior by using a mechanical stopper. The piecewise linear motion of the EH is dominated by the changes of the spring stiffness and damping during impact between the EH and the stopper. Liu et al [28, 29] realized wideband MEMS piezoelectric energy harvester (PEH) devices by using the assembled metal package and cantilever as mechanical stoppers. Suzuki et al [30] proposed a MEMS electret generator with electrostatic levitation and nonlinear springs to realize a wideband frequency range. The frequency response of such a system is converted from linear to nonlinear by employing fixed–free secondary springs. Nguyen et al [31] and Hajaji et al [32] achieved wideband MEMS piezoelectric and electrostatic EHs separately by exploiting different nonlinear spring structures.
2. Device configuration and operating mechanism
An impact-based MEMS PEH system integrates a high frequency PZT cantilever (termed as top PEH and denoted as PEH-T) and a low frequency PZT cantilever (termed as bottom PEH and denoted as PEH-B) arranged face-to-face with a pre-determined space as shown in figure 1(a). PEH-T as shown in figure 1(b) is a silicon supporting beam attached to a silicon supporting base, which has a high resonant frequency of 618 Hz. It was microfabricated by using an SOI wafer with 5 µm Si device layer, 1 µm buried oxide layer and 400 µm Si handle layer. It started with multiple-layer depositions of the SiO2 isolation layer (0.3 µm), the Pt/Ti bottom electrode layer (0.2 µm), the 100-oriented PZT thin film layer (3 µm) and the Ti/Pt/Ti top electrode layer (0.2 µm). For the detailed process flow the reader is referred to [28, 33]. The multiple layers were patterned as ten PZT elements parallel arrayed on the supporting beam. Likewise, PEH-B as shown in figure 1(c) has the same supporting beam as PEH-T, but exhibits a much lower resonant frequency of 36 Hz due to an additional proof mass attached to the end of the supporting beam. The structural parameters of the PZT cantilever are shown in table 1. The supporting bases of PEH-T and PEH-B are separately attached to their spacer chips and further assembled on their metal packages. Figure 1(d) illustrates the operation principle of the presented impact-based PEH system which integrates the FWB and FUC mechanisms simultaneously. As seen in figures 1(a) and (d), PEH-T which acts as a top-stopper is arranged above the proof mass of PEH-B with a top-stopper distance d1 and a lateral overlapping length l. The distance between the bottom of the proof mass and the package base (acting as a bottom-stopper) is fixed to be a bottom-stopper distance d2. When PEH-B is excited with sufficiently large amplitude, the proof mass will impact the top-stopper, i.e., PEH-T, and the bottom-stopper, i.e., the metal package, in each vibration cycle. This impact results in a retardation of the vibration amplitude but broadening of the operating frequency bandwidth of PEH-B. When the proof mass impacts the stopper, the frequency responses diverge from each other and the effective stiffness of PEH-B increases abruptly. The higher effective stiffness increases the effective resonant frequency of PEH-B and enables the resonance to extend over a wider interval of the frequency spectrum. In the meantime, PEH-T is excited by the impact effect and oscillated at its higher resonant frequency. The cyclic deformation of the PZT layer on the supporting beams of PEH-B and PEH-T will be transformed into electricity due to the piezoelectric effect.
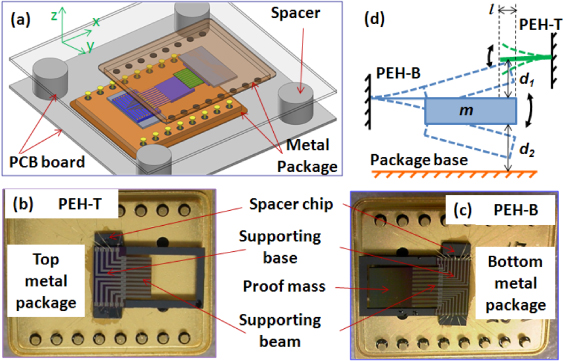
Figure 1. (a) Device configuration of an impact-based PEH system. (b) Operation mechanism of the impact-based PEH system. (c) Top view of the bottom PEH device. (d) Top view of the top PEH device.
Download figure:
Standard imageTable 1. Structure parameters of the piezoelectric PZT cantilever.
| Parameter | Value |
|---|---|
| Length of supporting beam | 3 mm |
| Width of supporting beam | 5 mm |
| Thickness of supporting beam | 5 µm |
| Length of proof mass | 5 mm |
| Width of proof mass | 5 mm |
| Thickness of proof mass | 0.4 mm |
| Young's modulus of silicon | 190 GPa |
| Length of individual PZT layer | 3 mm |
| Width of individual PZT layer | 0.24 mm |
| Thickness of PZT layer | 3 µm |
| Young's modulus of PZT | 72 GPa |
| Relative dielectric constant of PZT | 1000 |
| Piezoelectric constant | −50 pm V−1 |
3. Modeling
3.1. Output voltage and power
For a vibration-based PEH operating in the 3–1 mode, an applied mechanical stress σ1 in the longitudinal direction, i.e., denoted as the 1-axis, induces an electrical displacement D3 across the piezoelectric layer, i.e., an electrical field generated along the normal direction to the cantilever (3-axis). Meanwhile, the applied electrical field E3 across the piezoelectric layer in turn affects the mechanical strain ξ1. The relationship between the electrical displacement D3 and the mechanical strain ξ1 is given by the piezoelectric constitutive equations as


where s11, ε33 and d31 are the axial elastic compliance under a constant electric field, the transverse dielectric coefficient measured at a constant stress and the transverse–axial piezoelectric constant, respectively.
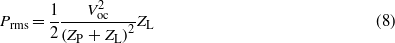
The open circuit voltage can be derived [34] from equation (1) as
where Y is the Young's modulus of the piezoelectric material, te is the thickness of the piezoelectric layer, lb is the length of the supporting beam and ξ1(x) is the strain distribution along the top surface of the supporting beam. Considering that PEH-B is subjected to a base acceleration, a concentrated force is assumed to be applied at the middle of the mass. The strain distribution ξ1B(x) in terms of the mass tip displacement δB of PEH-B is given by
where x refers to the variable distance from the beam anchor to the beam tip, lm is the proof mass length, lb and tb are the supporting beam length and thickness, respectively. It is assumed that PEH-T is subjected to a concentrated force applied at the free end of the supporting beam. The strain distribution ξ1T(x) in terms of the beam tip displacement δT of PEH-T is given by
For detailed derivations of the strain distributions for PEH-B and PEH-T the reader is referred to [34–36]. The open circuit voltages in terms of the mass tip displacement of PEH-B and the beam tip displacement of PEH-T are expressed as

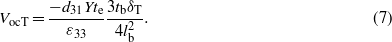
Hence, the average power delivered to the connected load is
where ZP and ZL are the complex impedances of the piezoelectric capacitor and connected load, respectively. The maximum power transfer occurs when the load impedance ZL matches with the piezoelectric impedance, i.e., ZL = ZP. In a situation where the connected load is purely real, i.e., ZL = RL, the maximum average power transfer occurs when the load resistance matches the magnitude of the piezoelectric impedance, i.e., RL = |ZP|.
3.2. Mechanical model
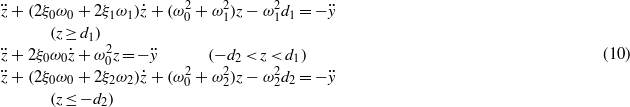
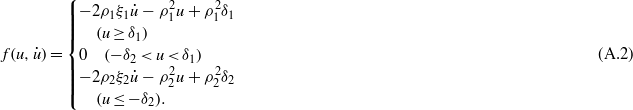
Figure 2 illustrates a piecewise linear model of the impact-based PEH system with stoppers on two sides. PEH-B, which is modeled as a primary suspension system, consists of a proof mass m suspended by a spring k0 and a damper c0. PEH-T and the metal package are considered as secondary suspension systems and are assumed to have spring stiffnesses of k1 and k2 and damping factors of c1 and c2, respectively. PEH-T is mounted above the proof mass with a top-stopper distance of d1 while the metal package is mounted below the proof mass of PEH-B with a bottom-stopper distance of d2. The top-stopper distance d1 is assumed to be smaller than the bottom-stopper distance d2, i.e., d1 < d2. These secondary suspension systems limit the relative movement of the mass and prevent the mass from excessive travel. In the model, the base excitation y(t) causes the proof mass to move relative to the housing as z(t). The relative motion of the proof mass can be divided into three stages. In the first stage (stage I), assuming that the relative motion of the mass is smaller than the stopper distances of d1 and d2, the system retains an overall stiffness and damping of k0 and c0, respectively. When the relative mass motion exceeds d1 but is smaller than d2, the top-stopper, i.e., PEH-T, will be engaged (stage II). The overall stiffness and damping of the system are then increased to k0 + k1 and c0 + c1, respectively. In the third stage (stage III), when the relative mass motion exceeds d2, the top-stopper and the bottom-stopper (the metal package) will both be engaged. The overall stiffness and damping will then be increased to k0 + k2 and c0 + c2 as the downward motion exceeds d2 and change to k0 + k1 and c0 + c1 as the upward motion exceeds d1.
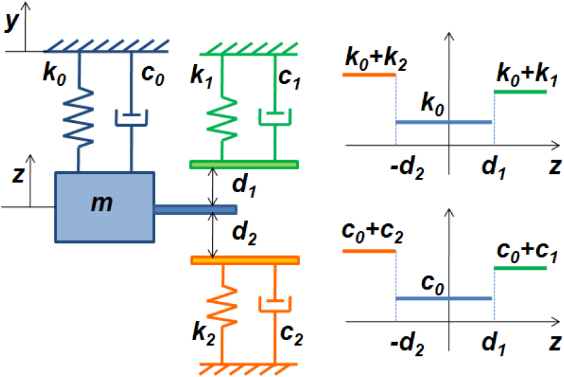
Figure 2. Piecewise linear model of the impact-based PEH system with stoppers on two sides.
Download figure:
Standard image3.3. Frequency response
3.3.1. Stoppers on two sides.
The differential equation of motion of the impact-based PEH system with stoppers engaged on two sides can be written as [37]
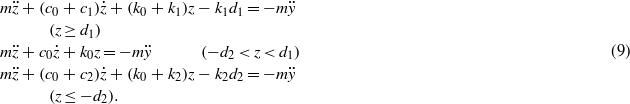
Equation (9) can be rearranged as follows:
where y(t) = Ysin(ωt), Y is the amplitude of the base excitation, ω is the excitation frequency, ξ0 and ω0 are the primary suspension damping and frequency characteristics, and ξ1, ξ2 and ω1, ω2 are the secondary suspension damping and frequency characteristics, which can be further defined as  ,
,  ,
,  ,
,  ,
,  ,
,  . In order to study the frequency response of the impact-based PEH system, we use dimensionless variables
to obtain the following dimensionless equation of the mass motion:

where
The frequency response function, which describes the dimensionless amplitude a with respect to frequency ρ, is obtained as

where

φ1 = sin−1(δ1/a) and φ2 = sin−1(δ2/a) are the phase angles when the proof mass engages the top- and bottom-stoppers, respectively. Detailed derivations are shown in the appendix.
3.3.2. Stopper on one side.
In the situation where only a stopper on one side is involved in the impact-based PEH system, the dimensionless differential equation of motion can be rewritten as

where i = 1 or 2 represents the situation where the mass motion engages either the top-stopper or the bottom-stopper, respectively.


An implicit equation for the amplitude a as a function of the excitation frequency ρ is given by

where


φi = sin−1(δi/a) is the phase angle when the proof mass engages the top- or bottom-stopper.
3.4. Analytical solution
3.4.1. Stopper on one side.
In the case where the impact-based PEH system employs a stopper on one side, the frequency response can be solved analytically using equation (19). The metal package is assumed to be the only stopper with a bottom-stopper distance of 1 mm in the simulation. The base acceleration is set as 0.4g; the damping ratios are assumed to be ξ0 = 0.025 and ξ2 = 0.1; the frequency characteristics are supposed to be f0 = 35.8 and f2 = 100. According to the simulated results, the frequency response of the mass motion is divided into two stages as shown in figure 3. Initially, the mass motion follows the frequency response of a linear spring–mass–damper model and increases monotonically from A to B as the excitation frequency increases (stage I). At point B, the relative motion reaches a displacement of 1 mm and the proof mass starts to engage with the bottom-stopper, hence the mass motion behavior transforms to a piecewise linear model with a stopper on one side where the frequency response follows the trace from B to C (stage II). The overall stiffness and damping in stage II are much higher than those in stage I, thus the operating bandwidth is significantly extended beyond the original frequency bandwidth. When the excitation frequency sweeps to point C, the mass motion amplitude drops immediately to point D, and reverts to the original trace of the linear model (without stopper) in stage I. Subsequently, the mass motion amplitude decreases monotonically from D to E along with up-sweeping frequencies.
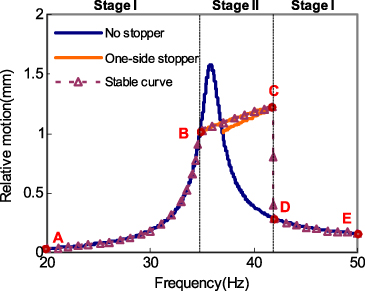
Figure 3. Analytical simulation of the relative mass motion of the PEH system against frequency with a stopper on one side.
Download figure:
Standard imageIn this model, certain parameters such as the base acceleration a, secondary suspension damping ξ2, secondary suspension frequency characteristics ω2 and bottom-stopper distance d2 show strong influences on the frequency response. As shown in figure 4, each of these four parameters has been studied separately by keeping the other three parameters fixed. The other parameters in the simulation, such as ξ0, f0, remain the same as in the case of figure 3. Figure 4(a) shows that, for fixed values of ξ2, ω2, and d2, the base acceleration has a strong influence on the frequency operating bandwidth. For instance, when the base acceleration increases from 0.4g to 0.6g, the operating bandwidth is widened from 7 to 14 Hz. Likewise, figure 4(b) shows the frequency response with different frequency characteristics of the bottom-stopper, i.e., 70, 100 and 130 Hz. Since the frequency characteristic is related to the spring stiffness according to  , it is seen that a higher stiffness of the bottom-stopper results in a wider frequency bandwidth. However, as the stiffness increases, the rate of amplitude increas decreases. In figure 4(c), as the damping ratio of the bottom-stopper increases from 0.05 to 0.1 to 0.2, the frequency bandwidth decreases from 11 to 7 to 4 Hz. Hence, a lower damping ratio is necessary to realize a wider frequency bandwidth. The frequency response with various bottom-stopper distances is shown in figure 4(d). As can be seen, a lower stopper distance results in a wider frequency bandwidth at the expense of a reduction in the relative mass motion. From the above observation, it is seen that the FWB behavior is strengthened by a decrease in the damping and an increase in the stiffness of the stopper. In addition, a high base acceleration is also preferred to realize a better performance (wider operating bandwidth and higher power output). There is a trade-off for the stopper distance, since it affects the frequency bandwidth and mass motion amplitude with opposite trend.

Figure 4. Parameter effects on the frequency response of the PEH system with a stopper on one side.
Download figure:
Standard image3.4.2. Stoppers on two sides.
For the impact-based PEH system with stoppers on two sides, the frequency response can be solved analytically by using equations (13) and (19). Similarly to the simulation for a stopper on one side, initially the base acceleration is set as 0.4g; the damping ratios are assumed to be ξ0 = 0.025, ξ1 = 0.03, ξ2 = 0.1; the frequency characteristics are supposed to be f0 = 35.8, f1 = 35.8, f2 = 100; the top- and bottom-stopper distances are set to be 0.5 mm and 1 mm, respectively. As shown in figure 5, the relative mass motion of PEH-B is divided into three stages. In stage I, the mass motion follows the frequency response of a linear model and increases monotonically from A to B with up-sweeping frequency. At point B (d1 = 0.5 mm), the mass starts to engage with the top-stopper. Hence, the mass motion transforms into a piecewise linear model with a stopper on one side in stage II. The mass motion amplitude increases gradually from point B until it impacts the bottom-stopper at point C with d2 = 1 mm. At this stage, the mass motion transforms into a piecewise linear model with stoppers on two sides in stage III. Since the overall stiffness and damping factor in stage III are higher than those in stage II, the mass motion amplitude increases slightly from C to D. At point D, the mass motion amplitude drops immediately to point E and reverts to the original trace of the linear model in stage I and subsequently the mass motion amplitude decreases monotonically to point F along with up-sweeping frequencies.
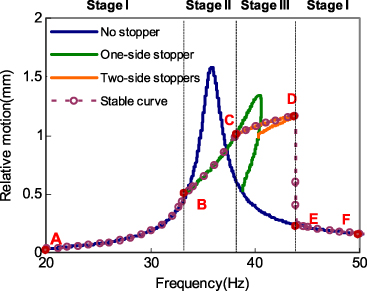
Figure 5. Analytical simulation of the relative mass motion of the PEH system against frequency with stoppers on two sides.
Download figure:
Standard imageFigure 6 shows the frequency response of the system with stoppers on two sides for various parameters. Similarly to the simulation for a stopper on one side in Figure 4, one of the four parameters (a, ξ1, f1, d1) is varied while maintaining the other three constant. The stiffness and damping are varied only for the top-stopper. The other parameters in the simulation, such as ξ0, ξ2, f0, f2, d2, remain the same as in figure 5. Figure 6(a) shows the frequency responses under accelerations of 0.4g and 0.6g. A higher base acceleration results in a wider operating bandwidth which is manifested mainly in stage III. In figure 6(b), as the stiffness of the top-stopper (in terms of the frequency characteristic) increases from 35.8 to 50 to 70 Hz, the operating bandwidth in stage II is broadened from 4 Hz (34–38 Hz) to 7 Hz (34–41 Hz) to 13 Hz (34–47 Hz), respectively, while the starting frequencies of the operating bandwidth in stage III are shifted accordingly from the ending frequencies in stage II, i.e., 38, 41 and 47 Hz. Figure 6(c) shows that the lower the damping of the top-stopper is, the wider the operating bandwidth as reflected in stage III is. Figure 6(d) shows the frequency responses of different top-stopper distances. As can be seen, a smaller stopper distance results in a wider operating bandwidth in stage II and a shift of the stage III operating bandwidth to a higher frequency range. A higher stiffness and a larger stopper distance will cause a larger bandwidth shift in stage III. In addition, a higher base acceleration and a lower damping will result in a larger operating bandwidth and mass motion amplitude.
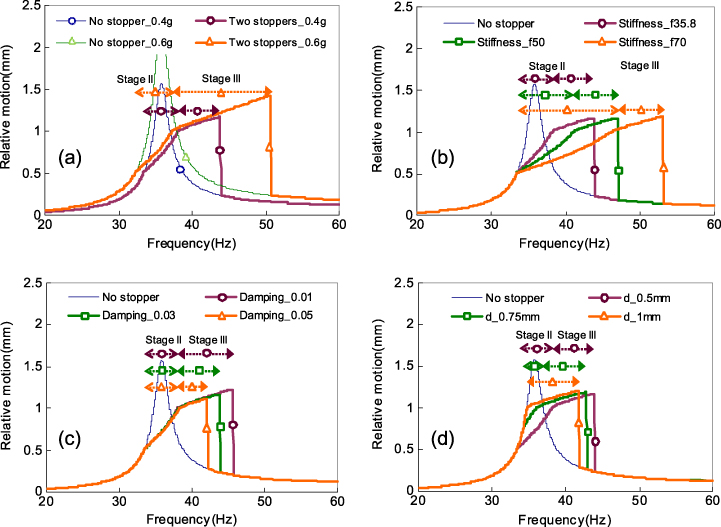
Figure 6. Parameter effects on the frequency response of the PEH system with stoppers on two sides.
Download figure:
Standard image4. Experiments and discussion
4.1. Experimental setup
To study the FWB and FUC characteristics of the PEH system experimentally, a fine-adjustment (FA) mechanism was fabricated to arrange PEH-B and PEH-T such that the top-stopper distance d1 could be precisely adjusted. As shown in figure 7(a), the FA mechanism consists of top and bottom L-shaped aluminum plates mounted on a microstage, such that the relative position of these two plates can be finely adjusted in the x- and z-directions. PEH-B and PEH-T are fixed in the bottom and top breadboards respectively and further attached to the bottom and top L-shaped plates. Under such an assembly, the lateral overlap distance and vertical stopper distance of PEH-B and PEH-T can be varied accurately. The entire FA mechanism is mounted on a vibration shaker as shown in figure 7(b). The vibration frequency and amplitude of the shaker are controlled by a dynamic signal analyzer through an amplifier. The output voltages of PEH-B and PEH-T are recorded separately by the dynamic signal analyzer and an oscilloscope. The capacitances of the PZT layers of PEH-B and PEH-T are 4.3 nF and 0.72 nF, respectively. The internal impedances of the dynamic signal analyzer and oscilloscope are both 1 MΩ. Therefore, the measured output voltages of PEH-B and PEH-T are considered as the load voltages instead of the open circuit voltages. In the following sections, the PEH systems with stoppers on one side and two sides are studied in detail.
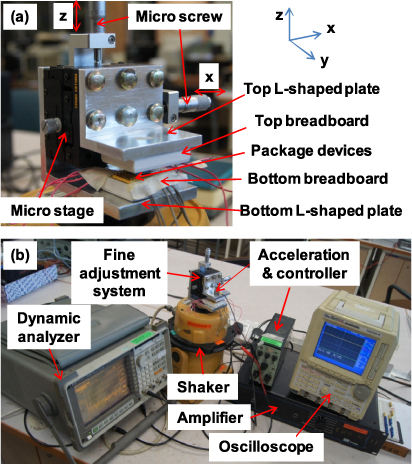
Figure 7. Experimental setup for the dynamic characterization of the PEH system. (a) Assembled fine-adjustment mechanism. (b) Vibration testing setup.
Download figure:
Standard image4.2. Configuration I—stopper on one side
In configuration I, only the bottom-stopper, i.e., metal package of PEH-B, is employed, with a bottom-stopper distance of 1.1 mm, as shown in figure 8(a). The output rms voltages against excitation frequencies from 20 to 60 Hz with different accelerations are shown in figure 8(b). At a low acceleration of 0.1g, PEH-B oscillates freely and does not engage with the bottom-stopper, and a maximum output rms voltage of 65 mV is generated at a low resonant frequency of 36 Hz. As the base acceleration increases, the vibration amplitude of PEH-B increases accordingly. When the base acceleration increases to 0.2g, the proof mass of PEH-B impacts the bottom-stopper. The frequency response exhibits a broad operating bandwidth in the neighborhood of its original resonant frequency. The operating bandwidth continues to widen with increasing acceleration and widens to a frequency range of 10 Hz (32–42 Hz) at an acceleration of 0.6g. The output rms voltage steadily increases from 83 to 106 mV within this frequency range.

Figure 8. (a) Vibration behavior of the PEH system with a stopper on one side. (b) Voltage output against frequency for configuration I under different base accelerations.
Download figure:
Standard image4.3. Configuration II—stoppers on two sides
In configuration II as shown in figure 9, PEH-T is employed as a top-stopper and mounted above the proof mass of PEH-B with different top-stopper distances of 0.75 and 0.5 mm. The overlap distance between the proof mass tip of PEH-B and the beam tip of PEH-T is 0.1 mm. Figure 10 shows the output rms voltages of PEH-B against frequencies under accelerations of 0.2g, 0.4g and 0.6g. In figure 10(a), the top- and bottom-stopper distances to the proof mass are 0.75 mm and 1.1 mm, respectively. At a base acceleration of 0.2g, as the excitation frequency sweeps up, the output rms voltage increases monotonically until the proof mass impacts the top-stopper where the vibration amplitude of the proof mass reaches 0.75 mm. Thereafter, the frequency response transforms into the stage II behavior for the model with a stopper on one side described previously, and the output rms voltage increases steadily from 60 mV at 34 Hz to 83 mV at 40 Hz. At the base acceleration of 0.4g, when the vibration amplitude of PEH-B reaches 0.75 mm, the proof mass starts to engage the top-stopper (stage II). Thereafter, the vibration amplitude increases continuously until it reaches 1.1 mm at 40 Hz, when the proof mass engages the bottom-stopper as well (stage III). In stage II, the output rms voltage increases from 60 to 83 mV as the frequency sweeps from 32 to 40 Hz. In stage III, the output rms voltage increases slightly from 83 to 92 mV as the frequency sweeps from 40 to 46 Hz. Since the stiffness of the bottom-stopper is much higher than that of the top-stopper, the voltage increment in stage III is significantly lower than that in stage II. For an acceleration of 0.6g, the operating bandwidths in stages II and III are broadened to 31–40 Hz and 40–49 Hz, respectively, while the corresponding output rms voltages are increased to 60–83 mV and 83–97 mV. When the top-stopper distance is reduced to 0.5 mm as shown in figure 10(b), the maximum rms voltages in stage II are not significantly reduced except at the initial operating phase of stage II. The voltage increment in stage II becomes steeper and the frequency range is widened significantly from both sides. At around the excitation frequency of 44 Hz, PEH-B begins to engage with the bottom-stopper (stage III) and the output rms voltage curve becomes relatively flat. As a result, decreasing the top-stopper distance would increase the operating frequency range in stage II and shift the onset of stage III to a higher frequency range.

Figure 9. Vibration behavior of the PEH system with stoppers on two sides.
Download figure:
Standard image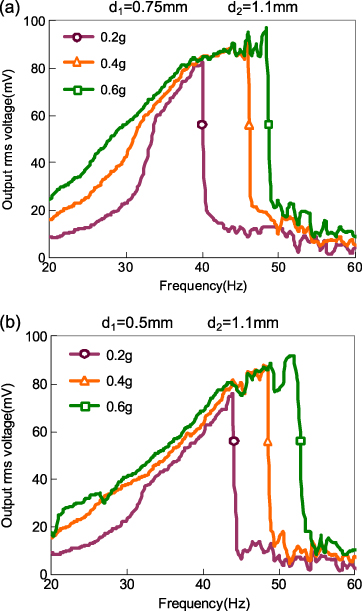
Figure 10. Voltage output against frequency for configuration II under different base accelerations and stopper distances.
Download figure:
Standard imageFigure 11(a) shows the real-time output voltages of PEH-B and PEH-T at an excitation frequency of 38 Hz and with a base acceleration of 0.6g and d1 = 0.75 mm and d2 = 1.1 mm. As can be seen, PEH-B oscillates according to the base excitation at 38 Hz. During each vibration cycle, PEH-B impacts the supporting beam of PEH-T, resulting in a self-oscillation of PEH-T at its high resonant frequency of up to 618 Hz. The average peak-to-peak voltages of PEH-B and PEH-T are 226 mV and 76 mV, respectively. From figure 11(a), the beam tip displacement of PEH-T and the mass tip displacement of PEH-B are calculated by using equations (6) and (7) and are shown in figure 11(b). Critical positions in each oscillation cycle of PEH-B as shown in figure 9 are also indicated in figure 11(b). The dashed lines indicate the corresponding positions of PEH-T in figure 9. We consider a particular instant of an oscillation cycle when the proof mass is at its lowest point at position ①. It then starts to move to position ② where the proof mass starts impacting the supporting beam of PEH-T. Then the proof mass forces the supporting beam to bend upward until position ③, where the proof mass reaches its maximum amplitude and the supporting beam reaches its maximum upward deflection. Subsequently, the proof mass together with the supporting beam move downward to position ④, where the supporting beam is released at its maximum downward deflection. Thereafter, the proof mass continues its downward movement to position ① during which the supporting beam of PEH-T self-oscillates at its high resonant frequency. The cycle is repeated as the proof mass moves toward position ② again. Such impact-based FUC behavior is realized in each oscillation cycle as long as the vibration amplitude of the proof mass is larger than the top-stopper distance (0.75 mm). If the vibration amplitude is increased further to 1.1 mm, the proof mass will also impact its metal package base. In figure 11(b), the average peak amplitudes of PEH-B and PEH-T are derived as 0.78 mm and 0.03 mm, respectively, which are in good agreement with the desired values.
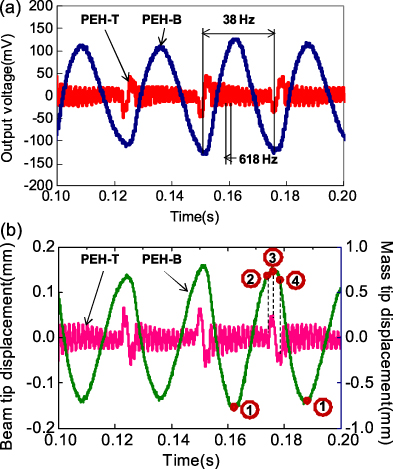
Figure 11. Real-time output voltages (a) and tip displacements (b) of PEH-B and PEH-T at an excitation frequency of 38 Hz and a base acceleration of 0.6g for configuration II.
Download figure:
Standard image4.4. Output power and comparison
By using equation (8), the optimal power outputs against frequency for configurations I and II are calculated with a base acceleration of 0.6g as shown in figure 12(a). For configuration II (d1 = 0.75 mm and d2 = 1.1 mm), the output power varies from 34 to 100 nW within a wideband range of 30–48 Hz. For configuration I, the output power is relatively higher from 72 to 114 nW within a narrower bandwidth ranging from 32 to 42 Hz. Figure 12(b) shows the optimal power at an excitation frequency of 38 Hz derived from the real-time voltages of configuration II (figure 11(a)) at 0.6g. The average peak powers of PEH-B and PEH-T are around 140 and 20 nW respectively. The results indicate that PEH-T has a much lower output than PEH-B. This is mainly due to the much smaller displacement of PEH-T and the energy loss during the impact process. On the other hand, we define the power efficiency as the mean value of output power divided by the tip displacement of the cantilever. Therefore, from the average peak amplitudes of PEH-B and PEH-T, it is observed that the power efficiency of PEH-T at 667 nW mm−1 is higher than that of PEH-B at 186 nW mm−1. Hence, PEH-T would generate a considerably higher power output than PEH-B under the same amplitude, i.e., tip displacement of the cantilever. A power electronic converter [38] can be used to condition the outputs of PEH-B and PEH-T and to provide the required DC output to electronic loads such as wireless sensor nodes or microsystems.

Figure 12. (a) Optimal power outputs against frequency for configurations I and II. (b) Real-time optimal powers of PEH-B and PEH-T for configuration II.
Download figure:
Standard image5. Concluding remarks
This paper has analytically and experimentally investigated the wideband frequency response of a PEH system with stoppers on one side and two sides. The key parameters for the frequency response, including base accelerations, damping ratios, frequency characteristics and stopper distances, have been studied based on our mathematical model. The experimental results show a qualitative match to the modeling results. The performance can be further improved by optimizing the stopper distances, overlapping tip distance, beam stiffness and damping characteristics. It is noteworthy that the proposed MEMS device provides the major advantage of utilizing both the FWB and FUC mechanisms at the same time.
Acknowledgments
This work was supported by MOE AcRF Tier 1-FRC grant (MEMS energy harvesting mechanisms for collecting energy from vibrations) and MOE 2009-T2-2-011 (R-263000598112) at the National University of Singapore.
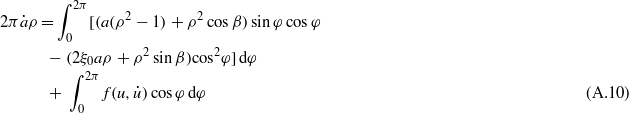
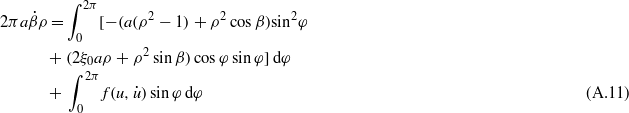
Appendix.: Frequency response of the PEH system with stoppers on two sides
The dimensionless equation for the mass motion of the impact-based PEH system with stoppers on two sides is

where
The first-order approximate solution of (A.1) is assumed to be


where a(τ) is a slowly varying amplitude, and β(τ) is a slowly varying phase difference between the base excitation and the response. Equations (A.3) and (A.4) imply that

Substituting equations (A.3) and (A.4) into (A.1) yields

Solving equations (A.6) and (A.7) for  and
and  , we have


Since the variables  and
and  vary slowly, we may suppose that their average values remain constant over a cycle period of 2π:
where
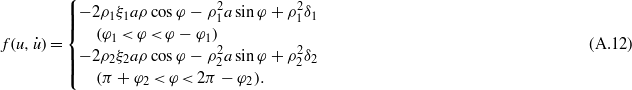
φ1 = sin−1(δ1/a) and φ2 = sin−1(δ2/a) are the phase values when the proof mass engages the top-stopper and bottom-stopper, respectively.
For the steady-state response solution of the system, the time derivatives on the left-hand sides of equations (A.10) and (A.11) are considered to be zero. Hence integration of equations (A.10) and (A.11) gives

Combining equations (A.13) and (A.14), the implicit equation for the amplitude a as a function of the excitation frequency ρ is given by

where X1 and X2 are in the right-hand sides of equations (A.13) and (A.14), respectively. Based on the frequency response function (A.15), the dimensionless amplitude a with respect to frequency ρ can be obtained accordingly.